
Conceptualising And Measuring Public Hospital Servicescape


Abstract
It is acknowledged that servicescape influences behaviour responses in the multiple studies. However, servicescape that is apparent to patients in public hospitals, remains elusive. This paper investigates public patients’ perception of servicescape in three major cities in Malaysia. The study employs a two-level analysis, 1) EFA to explore possible servicescape factors, and 2) CFA to validate servicescape factors. Seven servicescape factors were observed in the hospital setting. The study attested the dimensionality through 95% boosted-corrected intervals and compared chi-square of the seven-factor model with alternative models. Patients perceived Cleanliness, Noise Control and Lighting as important servicescape factors, because they represented the ideal ambient condition in the hospital setting. Facilities and Entrance reflected the layout design condition of the physical environment that suited public patients. Sign & Label and Directional Guide could help patients to find and reach their targeted location. Significant differences are found and supported the multi-dimensionality of servicescape, suggesting that each of the seven factors is distinctive yet they can be best characterised as the collective factors that represent servicescape in a hospital setting.
Keywords: Servicescapepublic hospitalexploratory factor analysisconfirmatory factor analysis
Introduction
With the growing competitive economy, contemporary globalisation and public accountability, it becomes vital for not-for-profit organisations, for example, government-funded organisations, non-governmental organisations and public institutions to mirror the process of the business model structure. Indeed, to remain relevant public institutions such as public hospitals need to produce healthcare service that yields public acceptance, satisfaction and trust. For many years, producing good healthcare service has become a major challenge for public hospitals, since it has been observed to influence satisfaction, perceived value and recovery performance (Chahal & Kumari, 2010).
Given the dramatic transformations of national public policy in the area healthcare industry, providing good service delivery, meeting patients’ expectation of healthcare service, advancing greater accountability to the health-related program are among the few that attribute to this paradigm shift (Sahoo & Ghosh, 2016). Because of the importance of such attribution, a patient’s service experience leading to his visit a public hospital may be an integral mean of connecting service expectation.
Problem Statement
Since producing very good service in public hospitals which resembles healthcare service that needs to be consumed simultaneously, such service can be packaged and represented with its physical environment, or servicescape (Mari & Poggesi, 2013). Evidence that is apparent in the studies of Sahoo and Ghosh (2016) and Pai and Chary (2013), suggests the development of servicescape has emerged and it has the potential of influencing patients’ expectation of good healthcare service.
Further examination is required into the servicescape that represents patients’ expectation of physical environment in public hospitals. However, identifying relevant servicescape has become elusive because prior servicescape studies tend to focus on for-profit organisations. For example, researchers have investigated the relationship between servicescape and customers’ emotion, intention and attitude in a restaurant context (Ortinau, Babin & Chebat, 2013) and servicescape and behavioural intention in a hotel context (Durna, Dedeoglu & Balikçioglu, 2015). Although the link between servicescape and customers’ behaviour has been established in for-profit organisations, the identification of those servicescape factors and their applicability in not-for-profit organisations have remained understudied but they are important to understanding patients' expectation of physical environment in public hospitals.
Research Questions
We develop the research questions as follow
Which servicescape is important to public patients?
Which servicescape is new and is consistent with the existing knowledge?
Can servicescape be addressed in a unidimensional or multi-dimensional model?
Purpose of the Study
This paper intends to 1) examine the servicescape factors from the perception of public patients; 2) explore new servicescape factors that are applicable in the public hospital setting; and 3) investigate the dimensionality of the servicescape. We organise and continue with literature review, and then a research methodology section. Subsequently, we have a section on data analysis and then we proceed with discussion and implications
Literature Review
In the servicescape literature, Bitner (1992) suggests a framework that maps servicescape typology, integrating three major dimensions; 1) ambience; 2) design and layout; 3) signs, symbols & artefacts. The ambient condition, as the first dimension, refers to the physical environment that evokes emotional responses through five senses (Bitner, 1992). Internal and external temperature, types of lighting, sound volume, music effects and scents can represent ambient condition. Typical acts of coordinating ambient condition, especially in fast food restaurants, shopping outlets and retail shops, are the good examples that justify for the needs to use these cues to complementing and reinforcing favourable buying behaviours (Lai, Chong, Ismail &Tong, 2014). This is because the implications of the ambient condition are often great and unpredictable and existed only in customers’ subconscious mind (Harris & Ezeh, 2008).
The second dimension is the design condition which is also defined equally as layout design, comprises the arrangement of equipment, furniture and machinery such as benches, coffee makers, ice boxes, tables, chairs, and cashier counter based on spatial relationships (Bitner, 1992). Layout can also be defined as the organisation of equipment (Turley & Milliman, 2000). Harris and Ezeh (2008) define design condition as the overall functional appearance which includes allocation of space, placement of information, message and photo, and is consistent with the studies of Mari and Poggesi (2013) and Rashid, Ma’amor, Ariffin, and Achim (2015).
The third dimension is Signs, Symbols & Artefacts condition which refers to labels (e.g. name tag, logo and place identification), directional signs (arrow signs), communication rules and policy, and artefacts (artwork). Bitner (1992) indicates that adequate appearance signs may lead customers to perceive the physical environment in a more relax and less stressful manner. The use of appropriate signs such as company name, directional guide and wayfinding can be used to enhance the service environment and to convey an overall impression. For example, sufficient size of company signage board and proper identification may reduce perceived risk leading to overall image formation. Furthermore, adequate signage allows customers to evaluate, evoke and associate if as the physical environment holds meaningful meanings to them which subsequently leads to the formation of overall impression about the company (Arredondo, Castaneda, Elder, Slymen, & Dozier, 2009).
Research Methods
Instrument Development
We decided to explore and to build a pool of possible items (Table
Subsequently, we sent the list to two administrative officers from public hospitals and two post-graduate students from the local university, who, had experience in the topic understudied but they were not involved with the current study. The list was critically examined to qualify those items based on 1) comprehensiveness, 2) suitability in the hospital setting, 3) clarity; 4) number of items; 5) redundant items, and to avoid 6) technical terms; 7) bias; 8) double meaning items; and 9) leading questions. Next, we elicited 20 respondents to read each of the items and to indicate the extent respondents could understand and could be applied in the context of hospitals. From the initial 69 items, 21 items were excluded because of the following reasons 1) redundancy (6 items); for example, sound control item was found to appear in different sources; and 2) suitability (15 items), for example, items on canopy, escalator, and smoking area were excluded.
Data Collection
The final survey of 48 items was conducted in three major cities, Pulau Pinang, Kuala Lumpur and Johor Bahru, Malaysia. Our sampling frame closely mirrored demographic profile of Malaysia, i.e. male to female (50:50) and Malay-Chinese-Indian (67-25-8) percentage (Department of Statistics. 2016). Walk-in patients and those who were waiting at the entrance, parking area and canteen were sought for their participation. To establish factor structure of the servicescape, we followed Hair, Black, Babin and Anderson’s (2010) procedures of data estimation via two-level analysis, i.e. 1) Exploratory-Factor-Analysis (EFA) to explore possible servicescape factors that are important to patients; 2) Confirmatory-Factor-Analysis (CFA) to the assess each factor’s properties. A two-level EFA-CFA analysis was adopted following the studies of Blankson (2008) and Thien, Razak and Ramayah (2014). Two levels of data collection had been collected, which covered 200 respondents for EFA, and subsequently 500 respondents for CFA.
Findings
Data Analysis
Exploratory Factor Analysis (EFA)
We applied EFA using maximum likelihood estimation (MLE) with oblimin rotation. Since it had become elusive to which servicescape factors remained relevant in the context of public hospitals, we concurred with the idea of exploring the possible antecedents, which was apparent in the studies of Lyu, Hu, Hung and Mao (2017). MLE is our choice of factor extraction because of two reasons; 1) MLE can provide consistent results across models; 2) MLE has remained the preferred estimator across settings (Byrne, 2010). We select oblimin rotation because of its flexibility to allow certain associations among factors (Hair et. al., 2010).
We observed three criteria for qualifying the number of factor extraction via 1) a minimum of 50% of variance explained, as the base consideration for social science studies; 2) a minimum eigenvalue of 1, as the basis for retaining a factor and 3) factor interpretability, as the factor extraction as recommended, should be relevant to the nature of studies (Hair et. al., 2010).
We retained seven factors from the initial solution of EFA that indicated 1) 69% of variance explained; 2) although there were 8 factors that show eigenvalue above 1, the last factor has been excluded for having less than two items; 3) the factors retained were logical and relevant to the healthcare environment. Subsequently, we analysed the pattern-loading matrix. The study’s objectives are to examine and explore servicescape factors in the context of public hospitals. For meeting these objectives and to ensure the quality of the factor extraction, we set a minimum of 0.40 absolute value for item retention and excluded those items that were cross-loaded into other factors. We examined the pattern-loading matrix closely and we found no cross-loaded items. Then, we re-tabulated the matrix and it enlisted 26 items.
We computed the reliability of each factor using Cronbach Alpha value, to examine whether the items were without errors and had the capability to produce consistent results on different trials. Hair et. al. (2010) further suggested 0.70 as the benchmark value for observing good reliability of items. We analysed the item-total correlation for each item under each factor. No items were deleted because all the factors’ Cronbach Alpha value exceeded 0.70 with the lowest value of 0.83 (factor 7) and highest value of 0.92 (factor 6). Final tabulation of the pattern matrix suggested seven factors and they were named to reflect the items that converged on that factor.
Confirmatory Factor Analysis (CFA)
Hair et. al. (2010) suggested that CFA is a technique to validate the structural factors and their relationships. We proposed that seven factors from the outcome of EFA, to be tested in a structural equation model via AMOS version 24. We adopted AMOS because of its allowed graphical examination of the structural equation model. We adopted CFA because 1) the number of factors had been pre-determined via EFA; 2) the factors understudied were apparent in prior literature, but their associations with one another were not known.
The seven factors from EFA were regarded as latent constructs. Hair et. al. (2010) defined latent constructs as the factors understudied that are indirect and represented by at least three items. For example, Cleanliness was an indirect measure because the construct could not be observed precisely, but the items might indicate and could assess how specific the overall hygiene and cleanliness condition affected patients’ perception. By summating the responses to these items, we could obtain a reasonable assessment of hygiene and cleanliness condition.
We used CFA to strengthen the assessment of the construct validity and reliability. Besides, it helped us to assess whether the items were specifying the latent construct (Hair et. al., 2010). Assessment of fit between the data and hypothesised model was examined through estimation of the CFA and was quantifiable via model fit indices. There were three broad categories of model fit indices, 1) Absolute Fit, we assessed the χ2, Goodness-of-Fit (GFI), Root-Mean-Square-Error (RMSEA) and Normed χ2 because these indices were regarded as the most fundamental for cross-examining between matrices, accommodating the sample size and for being less sensitive to model complexity; 2) Incremental Fit, where Comparative-Fit-Index (CFI) had been used widely and been insensitive to model complexity; and 3) for Parsimony Fit, we adopted Adjusted-Goodness-Fit-Index (AGFI) that accommodates the differing degree of freedom of estimation model (Byrne. 2010). We adopted the benchmark model fit values, following the suggestion of Anderson and Gerbing (1988) and Ho (2006), i.e. GFI > 0.90, RMSEA < 0.06, CFI > 0.90, AGFI > 0.80 and Normed χ2 < 3.
We began the assessment of model by defining each construct independently. This step was pivotal to examine whether the items in a construct were reliable and valid, as well as, to serve as the foundation for the hypothesised model (Hair et. al., 2010). Subsequently, we followed with linking all the constructs for model fit assessment. We examined the model on 1) standardised-regression-weight (SRW), that signifies the loading coefficient of each item on the designated factor with a minimum of 0.50; 2) cross-loading items via modification index (MI), in which each removal of the cross-loading item should significantly improve the model fit; 3) normality of data via skewness +/- 3.0 and kurtosis +/- 5.0; and 4) outliers (D2 value/items) (Byrne, 2010).
We had also examined priori models as a base for building measurement model for this study. The purpose of examining previous models from servicescape literature was to reinforce the needs for explaining the measurement model based on theory, in which we adopted Bitner’s (1992) servicescape typology and for confirming its equivalency to existing models. The initial loading coefficient of all items onto their designated constructs was significant at p<0.001. However, one item (Sign & Label 6) obtained SRW of 0.383. We reserved SRW’s minimum benchmark value of 0.50 and we excluded Sign & Label 6 item as it might pose a problem to the construct’s validity and reliability (Byrne, 2010).
Next, we assessed MI for the potential problem that may be initiated from cross-loading items. The MI suggested item Noise Control 4 as having high cross-loading coefficient value (163.01). Hair et. al. (2010) recommended that any removal of items shall be supported with significant changes of model fit. For this purpose, we compared the χ2 before and after removal of any cross-loading items. The removal of Noise Control 4 showed a statistically significant difference, before (χ2: 667.03, d.f. 254) and after (χ2: 604.54, d.f. 231), with ∆ χ2: 62.49 and ∆ d.f.: 23, p<0.05. We dropped item Noise Control 4 and re-tabulated the model estimation and retrieved the MI statistics, identifying the next highest cross-loading coefficient value. Item Lighting 1 had cross-loaded with a combined coefficient value of 31.874 with other constructs. However, when we compared the changes in model fit for the removal of Lighting 1, before (χ2: 604.54, d.f. 231) and after (χ2: 574.14, d.f. 209), the difference in chi-square (∆ χ2: 30.40 and ∆ d.f.: 22) showed not significant. This implied that the removal of Lighting 1 and any subsequent cross-loading items would not improve the model estimation.
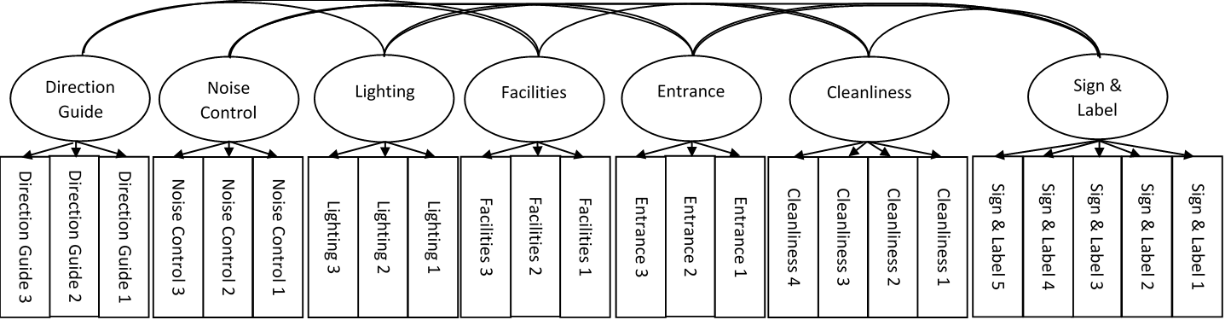
We assessed the normality of each item through skewness and kurtosis. The results indicated the highest skewness value as -0.45 (Entrance 2) and kurtosis as -0.65 (Noise Control 3) and both below the threshold value. This implied that the data fulfil the assumption of normality. Next, we assessed the presence of outliers via Mahalanobis Distance, in which the highest value was 88.42 and the total items remaining in the model was 24. The ratio of D2 value/items (88.42/24) indicated 3.68 and below the threshold value of 4 (Byrne, 2010). This suggested that the outliers in the model pose no threat to the estimation. The final model (Figure
Table
Assessing the correlation coefficients of each pair allowed us to validate whether the constructs were truly independent. If the pairwise correlation coefficient between two constructs was larger than one, then the constructs could not be regarded as statistically independent. We bootstrapped the data with 5000 iterations at 95% bias-corrected confidence interval. The confidence intervals as follow, between Directional Guide and Noise Control (0.06, 0.27), Facilities (0.50, 0.68), Lighting (0.17, 0.42), Entrance (0.38, 0.60), Sign & Label (0.63, 0.48) and Cleanliness (0.27, 0.48); between Noise Control and Cleanliness (0.07, 0.28), Facilities (0.03, 0.24), Lighting (-0.02, 0.17), Entrance (0.04, 0.25), and Sign & Label (0.10, 0.30); between Lighting and Facilities (0.19, 0.41), Entrance (0.26, 0.47), Sign & Label (0.15, 0.38) and Cleanliness (0.32, 0.53); between Cleanliness and Facilities (0.27, 0.46), Entrance (0.35, 0.53) and Sign & Label (0.26, 0.48); between Facilities and Entrance (0.59, 0.74), and Sign & Label (0.40, 0.59); and between Sign & Label and Entrance (0.32, 0.53). All the boosted pairwise intervals were less than one and further supported the discriminant validity of public hospital servicescape.
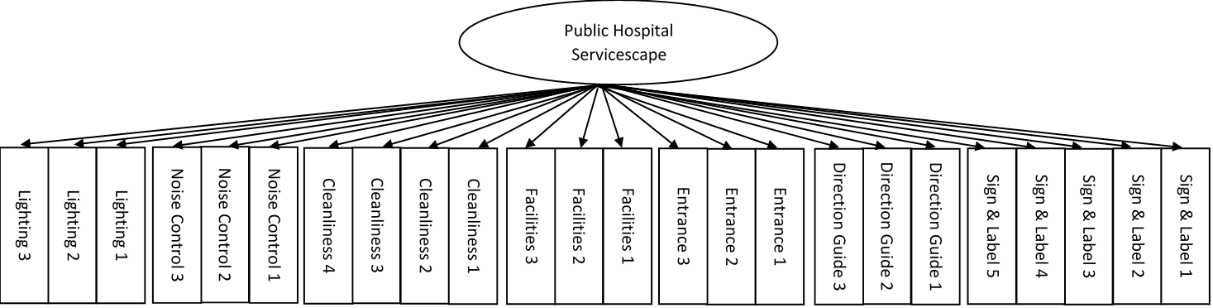
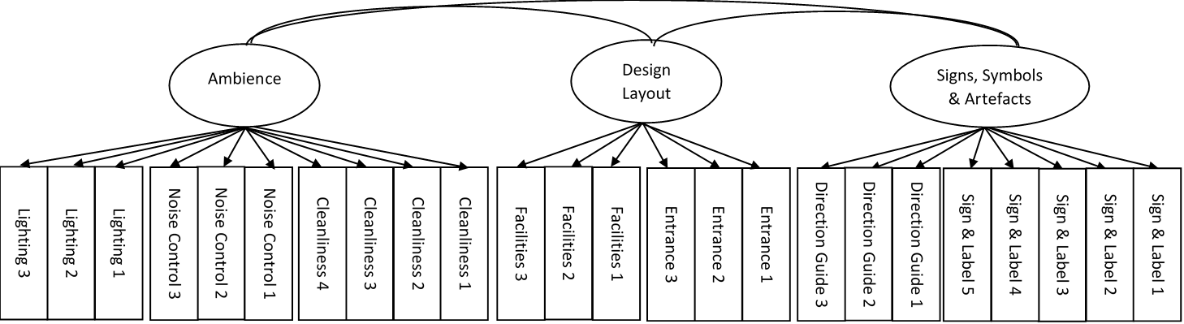
Building and comparing with alternative models allowed us to validate the discriminant properties of public hospital servicescape, on whether all the constructs could be treated independently or be grouped unidimensionally. This was also to align with our study’s objective that is to investigate the dimensionality of the servicescape. To meet this objective, we built several alternative models as a mean of comparison – a one-factor model (Figure
We further attested the nomological validity of the constructs via three independent variables, i.e. Attitude, Trust and Intention. Attitude represented patients’ psychological tendency towards a particular object. Trust and Intention referred to patients’ willingness and future desire to revisit the hospital and they were important components of Bitner’s (1992) servicescape typology. Attitude was measured via Spears and Singh (2004), Trust was measured via Koufaris and Hampton-Sosa (2004) while for Intention, we borrowed items from Diatmika, Irianto and Baridwan (2016). The correlation coefficients of the seven-factor model with the three independent variables were significant at p< 0.05 and consistent, with highest correlation coefficients between Attitude and Sign & Label (0.45), Trust and Directional Guide (0.35), Intention and Sign & Label (0.36). This implied for a strong support for the nomological validity of the constructs.
Conclusion
This study identifies seven factors that represent the physical environment in the context of public hospitals. In modelling the significant servicescape factors from patients’ perception, new insights are presented.
The initial pool of servicescape factors, after being applied in the hospital setting, was reduced to quantifiable dimensions, some could be addressed as new (Noise Control, Facilities, Entrance and Directional Guide) and others were noted as consistent with existing literature (Lighting, Cleanliness, Sign & Label). Although some differences are apparent between our findings and existing literature, they are not conclusive enough to revealing a representative population of Malaysia public patients with similar perceptions for servicescape experience. While differences of servicescape perceptions within the patients from three major cities are not apparent, differing perceptions for attending servicescape experience in public hospital setting are expected. It is believed that there will be a significant difference between public and non-public patients for the dimensionality of the servicescape factors. We hypothesise that the dimensionality would not be significantly different for in-patients and out-patients, but the dimensionality between different age groups would be significant. However further studies are needed to justify their differences. Our study validates seven servicescape factors that derive from Malaysia’s public patients.
The resultant seven factors in the model for attending servicescape factors while on the premise for seeking treatment, consultation and medication. The multi-dimensional seven-factor model is consistent with some priori literature discussed earlier. An overall view of the seven factors in the present study is that three factors (Cleanliness, Noise Control and Lighting) are consistent with the definition of the ambient condition, while two factors (Facilities and Entrance) which are largely layout design condition, are new and have not been given attention lately because they are not commonly tested in the hospital setting. The other two factors (Directional Guide and Sign & Label) conform to signs, signages & artefacts condition. Further review of Directional Guide and Sign & Label, indicates that they have been tested individually (Bonfanti, Vigolo, Douglas and Baccarani, 2017; Pai and Chary, 2013), thus testing these two factors altogether may add new insights. This is in view that our findings suggest Directional Guide and Sign & Label as distinctive constructs, therefore the insights from their interactions can shed a new contribution to the management.
We validate the importance of servicescape via the seven-factor model because of its significant contribution to improving service in the hospital setting and to the well-being of patients’ recovery (Hutton and Richardson, 1995). The combination of a multi-dimensional seven-factor model in the current study may, and support the notion that servicescape is evident and apparent in public hospitals, and therefore can be regarded as offering public-health-servicescape – a unique blend of servicescape and healthcare.
Evidence from χ2 differences between alternative models does confirm that there are significant differences in the dimensionality of the servicescape factors, in a hospital setting, between multi-dimensional and one-factor models, and multi-dimensional and three-factor models. Significant differences are found and supported the multi-dimensionality of servicescape, suggesting that each of the seven factors is distinctive yet they can be best characterised as the collective factors that represent servicescape in a hospital setting.
Future studies can examine the possible recovery antecedents that can be derived from servicescape beyond just exploring and measuring them. If insights can be provided on possible recovery antecedents which are at various stage of treatments, it may help the management to improvise the servicescape better. Hospital management can also study the effectiveness of these servicescape factors by evaluating residual risk, in which may compromise safety measures. Patients’ recovery can be better managed accordingly. Management can utilise these evaluations by consolidating all available data and compare with past projects to provide insights. The model demonstrates the seven servicescape factors that collectively interact with one another to represent the evidence and they are important to patients. Therefore, management needs to pay attention to the entire range of servicescape for improving patients’ recovery than focus on one approach at a time.
This paper simply examines and explores the servicescape factors in the context of public hospitals, thus future studies may focus on the causal effects of these factors on satisfaction, perceived value and recovery performance. Directional hypotheses could be developed to determine whether what was found in this study met the needs of the future studies. Only with hypothetical contributions that address servicescape in a service environment of public hospitals, one would, therefore, have no doubts about those seven factors could lend themselves to a broader environment.
Acknowledgments
We like to thank the Ministry of Higher Education, Malaysia for funding this research (Fundamental Research Grant Scheme – FRGS/1/2015/SS01/MMU/03/01) and Research Management Centre of Multimedia University. We like to thank the IEBMC 2017’s reviewers for their comments and suggestions.
References
- Anderson, J. C., and Gerbing, D. W. (1988). Structural equation modeling in practice: A review and recommended two-step approach. Psychological Bulletin, 103(3), 411–423.
- Arredondo, E., Castaneda, D., Elder, J. P., Slymen, D., and Dozier, D. (2009). Brand Name Logo Recognition of Fast Food and Healthy Food among Children. Journal of Community Health, 34(1), 73–78.
- Bernard, H. R. (2012). Social research methods: Qualitative and quantitative approaches. Sage.
- Bitner, M. J. (1992). Servicescapes: The Impact of Physical Surroundings on Customers and Employees. Journal of Marketing 56 (2), 57-71
- Blankson, C. (2008). Measuring college students’ choice criteria of credit cards: scale development and validation. Journal of Marketing Management, 24(3–4), 317–344
- Bonfanti, Vigolo, V., Douglas, J. and Baccarani, C. (2017). Servicescape navigation: A customer typology based on the wayfinding ability of Italian hospital visitors. The TQM Journal, 29(4), 546-563.
- Byrne, B.M. (2010). Structural Equation Modelling With AMOS: Basic Concepts, Applications, and Programming. New York, NY: Taylor and Francis.
- Chahal, H., & Kumari, N. (2010). Development of multidimensional scale for healthcare service quality (HCSQ) in Indian context. Journal of Indian Business Research, 2(4), 230-255.
- Department of Statistics (2016). Statistics Yearbook. Malaysia. Retrieved from https://newss.statistics.gov.my/
- Diatmika, I. W. B., Irianto, G., and Baridwan, Z. (2016). Determinants of Behavior Intention Of Accounting Information Systems Based Information Technology Acceptance, (8), 125–138.
- Durna, U., Dedeoglu, B. B., and Balikçioglu, S. (2015). The role of servicescape and image perceptions of customers on behavioral intentions in the hotel industry. International Journal of Contemporary Hospitality Management, 27(7), 1728-1748.
- Hair, J.F., Black, W.C., Babin, B.J., and Anderson, R.E. (2010). Multivariate Data Analysis. Upper Saddle River, NJ: Pearson Education Inc.
- Harris, L. C., and Ezeh, C. (2008). Servicescape and Loyalty Intentions: an Empirical Investigation. European Journal of Marketing, 42(3/4), 390–422.
- Hooper, D., Coughlan, J., and Mullen, M. R. (2013). The servicescape as an antecedent to service quality and behavioral intentions. Journal of Services Marketing, 27(4), 271–279.
- Ho, R. (2006). Handbook of Univariate and Multivariate Data Analysis and Interpretation with SPSS. New York: Chapman & Hall
- Hutton, J. D., and Richardson, L. D. (1995). Healthscapes: the role of the facility and physical environment on consumer attitudes, satisfaction, quality assessments, and behaviors. Health Care Management Review, 20(2), 48-61.
- Kim, W. G., and Moon, Y. J. (2009). Customers’ cognitive, emotional, and actionable response to the servicescape: A test of the moderating effect of the restaurant type. International Journal of Hospitality Management, 28(1), 144–156.
- Koufaris, M., and Hampton-Sosa, W. (2004). The development of initial trust in an online company by new customers. Information and Management, 41(3), 377–397.
- Kusumarini, Y., Sherly, de Y., and Thamrin, D. (2012a). Entrance and Circulation Facilities of Malls in Surabaya: A universal interior design application. Procedia - Social and Behavioral Sciences, 68, 526–536.
- Kusumarini, Y., Sherly, de Y., and Thamrin, D. (2012b). Signage System of Malls in Surabaya: Universal Interior Design Applications and Suggestions for Solution. Procedia - Social and Behavioral Sciences, 68, 515–525.
- Lai, K. P., Chong, S. C., Ismail, H. B., & Tong, D. Y. K. (2014). An explorative study of shopper-based salient e-servicescape attributes: A Means-End Chain approach. International Journal of Information Management, 34(4), 517-532.
- Lai, K. P., Chong, S. C., Ismail, H. B., & Tong, D. Y. K. (2015). Do salient e-servicescape attributes predict online brand image?. International Journal of Internet Marketing and Advertising, 9(3), 209-232.
- Loureiro, S. M. C., Sarmento, E. M., Lopes, R., and Jin, K. N. (2015). Feeling Better While Waiting: Hospital Lobby in Portugal and South Korea. Asian Journal of Business Research, 5(2), 58–72.
- Lyu, J., Hu, L., Hung, K., and Mao, Z. (2017). Assessing servicescape of cruise tourism: the perception of Chinese tourists. International Journal of Contemporary Hospitality Management, 29(10), 2556-2572.
- Mari, M., and Poggesi, S. (2013). Servicescape cues and customer behavior : a systematic literature review and research agenda. Service Industries Journal, 33(2), 171–199.
- Ortinau, D. J., Babin, B. J., and Chebat, J. C. (2013). Development of new empirical insights in consumer–retailer relationships within online and offline retail environments: Introduction to the special issue. Journal of Business Research, 66(7), 795-800.
- Pai, Y. P., and Chary, S. T. (2013). Assessing Healthscapes-a comparison among inpatients and outpatients. Review of Integrative Business and Economics Research, 2(1), 521.
- Rashid, N. M., Ma’amor, H., Ariffin, N., & Achim, N. (2015). Servicescape: Understanding how Physical Dimensions Influence Exhibitors Satisfaction in Convention Centre. Procedia - Social and Behavioral Sciences, 211(September), 776–782.
- Sahoo, D., & Ghosh, T. (2016). Healthscape role towards customer satisfaction in private healthcare. International Journal of Health Care Quality Assurance, 29(6), 600–13.
- Siu, N. Y.-M., Wan, P. Y. K., and Dong, P. (2012). The impact of the servicescape on the desire to stay in convention and exhibition centers: The case of Macao. International Journal of Hospitality Management, 31(1), 236–246.
- Spears, N., and Singh, S. N. (2004). Measuring Attitude toward the Brand and Purchase Intentions. Journal of Current Issues & Research in Advertising, 26(2), 53–66.
- Thien, L. M., Razak, N. A., and Ramayah, T. (2014). Validating Teacher Commitment Scale Using a Malaysian Sample. SAGE Open, 4(2).
- Turley, L. ., and Milliman, R. E. (2000). Atmospheric Effects on Shopping Behavior. Journal of Business Research, 49(2), 193–211.
- Warnaby, A. D. N. G. (2013). Shopping in downtown: The effect of urban environment on service quality perception and behavioural intentions. International Journal of Retail & Distribution Management, 41(9), 654–670.
Copyright information

This work is licensed under a Creative Commons Attribution-NonCommercial-NoDerivatives 4.0 International License.
About this article
Publication Date
31 July 2018
Article Doi
eBook ISBN
978-1-80296-043-3
Publisher
Future Academy
Volume
44
Print ISBN (optional)
-
Edition Number
1st Edition
Pages
1-989
Subjects
Business, innovation, sustainability, environment, green business, environmental issues, industry, industrial studies
Cite this article as:
Ng, K. F., Lai, K. P., Ismail, H. B., Tong, D. Y. K., & Yuen, Y. Y. (2018). Conceptualising And Measuring Public Hospital Servicescape. In N. Nadiah Ahmad, N. Raida Abd Rahman, E. Esa, F. Hanim Abdul Rauf, & W. Farhah (Eds.), Interdisciplinary Sustainability Perspectives: Engaging Enviromental, Cultural, Economic and Social Concerns, vol 44. European Proceedings of Social and Behavioural Sciences (pp. 733-745). Future Academy. https://doi.org/10.15405/epsbs.2018.07.02.78