
Behavioral Finance And Speculative Behavior Of Investors: Evidence From Saudi Stock Market


Abstract
This study examines the profile of individual stock traders in Saudi stock market and attempts to determine the behavioral finance factors affecting the speculative behavior of investors as well as to discover the strongest predictors. Using questionnaire survey method, 130 individual traders in Saudi stock market were identified for this study. The survey is carried out in the biggest brokerage firms in Dammam, Riyadh, and Jeddah. It appears that more than 50% of the individual stock traders are in the age group of between 30-39 years and most of them are inexperienced traders. The results from the Partial Least Square method show that anchoring, confirmation, representativeness and overconfidence heuristics have a significant relationship with speculative behavior. Anchoring appears to be the main predictor of speculative behavior, followed by confirmation, representativeness, and overconfidence. In contrast, availability, loss aversion, and regret aversion does not play a significant role in the speculative behavior of individual traders. The behavior factors introduced in this study explain 34% of individuals’ speculative behavior. The findings provide important implications to Capital Market Authority in Saudi to develop appropriate programs and strategies to help market participants to make better and wiser buying decisions that can aggregate to increase market efficiency rather than just to speculate on the price movement of the stock market.
Keywords: Behavioral financeheuristicPLS-SEMstock marketSaudi Arabiaspeculative behavior
1. Introduction
Online trading facilitates the participation of individuals to trade directly in the stock market. The explosion of financial information, the lack of skill together with uncertainty, makes average individuals overwhelmed. To simplify the trading decision, individuals rely on simple mental shortcuts called heuristics that usually drive a bias decision and subsequently irrational behavior. The similar bias behavior affects individual trader’s portfolios and the market.
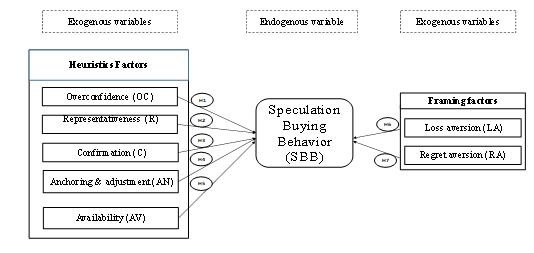
Individual decisions in the stock market are influenced by two categories of behavioral finance (BF) factors, which are heuristics and framing factors. When trading in the stock market, an individual might form certain beliefs or preferences. Hence, they are typically subjected to several judgment biases due to heuristics, which are defined as "
On the other hand, framing factors which differ from the heuristic factors trigger individuals to respond differently based on the context in which a choice is framed. Stock market inefficiency could create bubbles, which led to a sharp correction in the prices and market crash causing individuals to lose money and confidence in the stock market. This was the case of the SSM in the years 2006, 2009, 2011, 2014, 2015 and 2016. This circle of negative consequences at both personal and market levels may continue unless the roots of the problem are investigated. In lieu of the characteristics of traders in SSM, this study attempts to answer the following research questions:
What is the profile of individual speculating in the Saudi stock market (SSM)?
What are the behavioral finance (BF) factors that influence the speculative buying behavior of the traders in the Saudi stock market?
Determine to what extent individuals’ speculative behavior were due to BF factors?
Specifically, the objectives of the study are to examine the profile of individual stock traders that speculate in the Saudi stock market (SSM) and determine the behavioral finance factors that affect the speculative behavior of the investors. The rest of this article is arranged as follows: Section
Literature review
Speculative Buying Behavior
Typically, stock trading decision consists of three dimensions: buy, sell and hold. However, the buying behavior dimension of individual traders is the focus of this research for two reasons; first, traders are net buyers (Barber & Odean, 2011); and second, measuring stock buying decisions can provide more accurate results than measuring the decision-making in general. Pride and Ferrel (2014) defined stock buying decision as “
Speculative behavior can either be constructive or destructive. Constructive speculative requires a high level of skill and intelligent analysis of the stock market and speculative exist in developed stock markets. The second speculative is destructive speculative, which is the most common speculative, especially among individuals in frontier markets like the SSM. Destructive speculative involves little evaluation of company fundamentals or intelligent prediction of trends (Islam & Watanapalachaikul, 2004). In the frontier market, traders usually use intuition, heuristics, rumors, and advice from others to make trading decisions. Psychologically and emotionally, speculative is more exciting than investment and therefore are more preferred by individual traders (Stäheli & Savoth, 2013). Investor speculative behavior can be explained by heuristic and framing factors. Theoretically, these factors are best explained under behavioral finance which conflicts with the pure finance that argued investors are rational. Heuristic factors are sub-divided into the following items:
Overconfident
Overconfidence is “
Representativeness
Representativeness heuristics is “the tendency of decision makers to view events as a representative of some specific class that is to see patterns where they perhaps do not exist” (Thomaidis, 2004). Traders in the stock market most likely assume that recent past returns are representative of what they can expect in the future (De Bondt, 1992). The influence of representativeness on decision making can be explained through two concepts: stereotype events and the law of small numbers. Stereotype events mean that investors usually tend to categorize companies based on certain characteristics (e.g. a growth company or big company) then draw a conclusion about the company’s risk and return by comparing it to other similar companies (Pompian, 2012). The law of small numbers means that based on a few random observations drawn from a population, a person will consider those observations as highly representative of the characteristics of the population (Tversky & Kahneman, 1971). De Bondt (1992) found that stock market analysts 48 made biased judgments regarding recent increases in stock price. They believed that recent trends would probably continue. The practical implication of representativeness heuristic is the tendency of traders to be more optimistic about recent winners and more pessimistic about recent losers. However, De Bondt and Thaler (1985) found that stocks that were losing in the previous three years performed much better in the subsequent three years than the winners in the last three years. Lakonishok, Shleifer, & Vishny Vishny (1994) found that misperception of the good characteristics of a company (e.g. high-quality products, high expected growth, and intensive media coverage) can be perceived as characteristics of a great buy option. Dhar and Kumar (2001) investigated the price trends of stocks bought by more than 40,000 households at a discount brokerage in the US over a 5-year period. They found that investors prefer to buy stocks that have recently enjoyed some positive abnormal returns, consistent with the thinking that the past price trend is representative of the future price trend. In another study, Goetzmann and Peles (1997) revealed that investors rely heavily on past performance when evaluating their fund purchase decisions.
Thus, the study hypothesized based on previous studies that:
Confirmation
Confirmation heuristic is “
Anchoring and adjustment
Anchoring and adjustment are “a strategy used to estimate an unknown value by starting from an initial point suggested by the formulation of the problem, then adjusting from it to reach a final value, which is usually biased toward the initial value” (Tversky& Kahneman, 1974). Investors‟ decisions are influenced by anchoring when they are focused on a particular point, like the historical stable price (e.g. $10) and then estimate the next price using anchoring. Galinsky and Mussweiler, (2001) explored the influence of the first offer on buyer and seller behavior. Based on experiments, the researchers found that first offers influence the final negotiation decision, as they serve as a benchmark price (anchor) based on which the final price is estimated. They also demonstrate that whether they are the buyer or the seller, the party who makes the first offer obtains a better outcome. Zielonka (2004) carried out an experiment involving financial analysts and found out that certain historical peaks and lows in a security’s price can serve as mental anchors in technical analysis. This means that anchoring and adjustment can influence the judgment and the speculating behavior of an individual. Thus, the study hypothesized that:
Availability
Availability heuristics is “the people’s ability to estimate the probability or frequency of a certain event based on life experience, where intense, large events are faster to be recalled than small, less intense events”. There is a lack of studies that relate availability heuristics to speculation buying behavior in the stock market. Rioux and Russo (1988) examined the influence of the availability heuristic on professional decisions. They found that the availability heuristic influences the buying behavior of professional managers. In a different study, Barber and Odean (2006) found that an individual’s decision to buy a stock is influenced mainly by the attention. High trading volume and the highest gains appearing in the daily news motivate buying behavior due to the availability heuristic. Traders may find it difficult to search for potential stocks to buy among hundreds of companies in one sector. Therefore, availability heuristic helps to simplify the process of choosing and buying a stock. However, when the market just witnesses sharp correction, the attention will be to the recent negative events, which mean availability heuristics negatively influence speculative buying behavior. Thus, the study hypothesized that:
Loss Aversion
Loss aversion is part of framing factors. Kahneman (2013) describes loss aversion as “
Regret aversion
Regret aversion is part of framing factors. Pompian (2012) defined regret aversion as “a cognitive phenomenon that often arises in investors, causing them to hold onto losing positions too long to avoid admitting errors and realizing losses”. Individuals who regret averse try to avoid two types of error, namely the error of commission, where a decision turns out to be wrong and error of omission, where no decision was made, thus an opportunity is lost. Regret is stronger for omission than for commission (Seiler, Seiler, Traub, & Harrison, 2008). Shefrin and Statman (1984) found that people prefer to buy stocks from well-known companies that pay dividends in order to avoid regret in case the stock value drops. Krähmer and Stone (2005) regret aversion lead to excess conservatism or a tendency to make up for missed opportunities. The data in this research collected when the SSM witness a sharp correction. Thus, the influence of regret on speculative buying behavior is said to be negative when market witness a sharp correction and therefore this study hypothesized the relationship as follows:
Research Method
A total of 591 surveys were distributed in the largest brokerage firms in Dammam, Riyadh and Jeddah city using self-administrated survey. Out of which only 296 (54%) of the questionnaire could be used for the study. However, only 130 respondents who categorized themselves as speculators were used in this study. The survey consists of four sections. Section A was labeled as Demographic Profile. Section B was labeled as Traders’ Information. Section C was labeled as Stock Trading Behavior cover both heuristics and framing factors. Lastly, Section D measured speculative behavior. The final survey was conducted in August 2014 for three months. The data collected during a sharp correction in the SSM. This study followed one-stage cluster sampling as suggested by Daniel (2011). In this study, all elements (traders) in each cluster (brokerage firms) were included. The respondents to the survey were individual traders who trade on the trading floors of the largest eleven-brokerage firms in Saudi Arabia. The survey ensured that the respondents entering the trading floor were speculators using screening question in the survey.
Partial Least Squares Structural Equation Modeling (PLS-SEM) 2.0 technique is used to analyze the proposed model and test hypotheses statements since it can predict key target construct and identifying driving construct. Furthermore, PLS is capable of handling complex structure model with small sample size (Hair, Hult, Ringle, & Sarstedt, 2013). The study followed two-stage model validation recommended by Hair et al; (2013). In the first stage, the measurement model evaluated for the reliability and validity. In the second stage, the structural model examined for its predictive capabilities and the relationship between the constructs.
Findings and Discussion of the Study
Demographic Profile of Individual Stock Traders
This section addresses the first objective in the study, that is, to examine the profile of individual stock traders that speculate in the Saudi stock market (SSM). Table
Individual Traders’ information
Table
About 36.9% reported that their biggest loss during their years of trading exceeded 20% of portfolio value. However, 76.9% of respondents were still optimistic about the SSM, and about 60.8 % of the respondents said that they are willing to increase their investments in the coming year. Regarding the tools used by individuals to make trading decisions, most of the respondents rely on advice (36.9%), followed by technical analysis (26.2%) as the main tool to make a stock trading decision.
Respondents equally reported fundamental analysis (18.5%) and intuition (18.5%) used in their decision making. Lastly, most respondents (76.6%) did not know about the existence of behavioral finance (BF).
Next to attain objective 2 and 3 of the study, the Partial Least Squares Structural Equation Modeling (PLS-SEM) 2.0 technique is used. Before estimating the model using this PLS method, the authors have to conduct internal consistency, convergent validity, and discriminant validity tests.
Internal consistency reliability was assessed using composite reliability (CR), where the different outer loadings of individual items are calculated (Hair et al., 2013). All the constructs in this study achieved the minimum required composite reliability (CR) value of 0.60 as recommended by Hair et al. (2013).
Next convergent validity is estimated since the scores obtained using two different instruments measuring the same concept are highly correlated (Bonds & Raacke, 2012). The outer loading of the indicator and Average Variance Extracted (AVE) used to check for convergent validity.
First, the outer loadings of individual items met and exceeded the minimum requirement of 0.50 recommended by Hair, Black, Babin, & Anderson (2009). Second, the results of AVE in Table
Lastly, Discriminant validity is evaluated by comparing the correlation between constructs and the square root of
for a construct. There was no correlation between any two latent variables larger than or equal to the square root of the AVEs of the two latent variables confirming that the discriminant validity has been achieved (Hair et al., 2013). After deleting several items, the measurement model in this study displayed adequate measures required to examine the structure model. Table
Structure Model
Once the measurement model is reliable and valid, we address the structure model. We follow the Structure model assessment procedure that consists of five steps. First, we assessed the model for collinearity. Collinearity “
Third, Coefficient of Determination ( ) was carried out. The R² value explains the variation for endogenous construct, which is due to the influence of exogenous constructs. The results indicate that 34.5% of individuals’ speculative behavior can be explained by heuristics and framing factors introduced in the proposed model. Hair et al., (2013) stated R² value greater than 0.20 is considered high in behavioral research.
Fourthly, the study conducted the effect size The effect size 0.02, 0.15 and 0.35, represent small, medium and large effect respectively (Hair et al;, 2013). The values of in this study indicate that loss aversion and regret aversion have no effect. However, all the remaining exogenous constructs have a small effect on the endogenous constructs.
The last step is the assessment of the predict the relevance of . The Stone-Geyser’s value is an indicator of the model’s predicative relevance, which is obtained by using blindfolding procedure. A value larger than zero indicates that the path model has predicts relevance (Hair et al., 2013). The value of the predictive relevance in this study is 0.186, which implies that the model has predictive relevance.
Results of the Estimated PLS Structural Model
Table
Also, confirmation heuristics has a significant negative effect on speculative buying behavior. The results concur with studies of Kosnik (2008), Bashir, Javed, Meer and Naseern (2013) and Kahneman (2013). A reasonable explanation is that this study focuses on speculative buying behavior while those previous studies concentrate on judgment and decision making in general. Results of this study found anchoring to have a positive influence on speculative buying behavior. This concurs with findings by Galinsky and Mussweiler (2001) and Zielonka (2004).
Availability heuristic does not affect speculative buying behavior. The results contradicted with Barber and Odean, (2006) where they found that availability positively affects decision and judgment. However, previous studies use experiments to measure the relationship between availability and judgment whereas this study use self-administrated survey to investigate the influence on speculative behavior. Loss aversion results in this study contradict with Kahneman and Tversky, (1979) and Bashir et al., (2013) were both found loss aversion positively affect the trading decision when faced with loss or high risk but negative when faced with gain. Regret aversion in this study also contradicts with Krähmer and Stone (2005) who found that regret aversion positively affect the individual decision.
This section addresses the third objective in the study, which is to Quantify to what extent individuals’ speculative behavior can be explained by BF factors. The heuristics and framing factors are found to be able to explain about 34.5 % of the variance in speculative buying behavior. The R² value which is greater than 0.20 considers high in behavioral research. (Hair et al;, 2013). The findings provide theoretical and practical implications. Unlike previous studies that focused on judgment and decision making in general, this study specifically examined on the speculative buying behavior.
Thus, theoretically, this study adds to the growing body of behavioral finance literature. It also contributes to the evidence in support for the influence of anchoring, confirmation, representativeness and overconfidence heuristics on the speculative behavior of individuals, especially in Saudi Arabia context. Each significant factor introduced in this study can lead to several possible consequences for traders.
First, anchoring could lead traders to market or stock forecast that is too close to current levels.
Second, confirmation could lead to selection bias towards specific stocks, which creates an under-diversified portfolio.
Third, representativeness could lead to buying stocks based on company recent positive upward trend in the stock price. Lastly, overconfident could lead to under-diversified Portfolio and excessive trading that underestimate the risk (Pompian, 2012).
Since these four factors are the most important predictor of the speculative behavior of traders, practically the Capital Market Authority (CMA) needs to introduce a new program to create awareness about the impact of behavioral finance in general with a focus on anchoring, confirmation, representativeness, and overconfidence. Also, because speculating is more exciting than investment. It is advisable that speculators own two portfolios; one portfolio is to speculate while the second one is to invest in an index fund to avoid the behavioral errors during speculation, as a result achieving diversifications and average return in the long run. Understanding the role of psychology in trading decisions will help market participants to make better and wiser buying decisions that can aggregate to increase market efficiency, and reduce sharp market correction. Ultimately, CMA in Saudi Arabia will be able to achieve its main objective, which is creating an appropriate investment environment that boosts confidence and promoting the welfare of all market participants.
Conclusion
This study attempts to examine the profile of individual stock traders that speculate in the Saudi stock market (SSM) and determine the behavioral finance factors that affect the speculative behavior of the investors. Findings from questionnaire survey method used indicate that the majority of the individual stock traders are from the age group category of 30-39 years. In term of education level, 30.8% and 26.2% respondents are high schools and diploma holders respectively while 30.8% of respondents have a bachelor degree. Half the respondents have less than five years trading experience and only 40% said they have trading experience of between five to ten years. Generally, the individual stock traders do not seek expert financial advisors to trade in the SSM and are inexperienced traders. In addressing the second objective, the results from the Partial Least Square method show that anchoring, confirmation, representativeness and overconfidence heuristics have a significant relationship with speculative behavior. Anchoring appears to be the main predictor of speculative behavior, followed by confirmation, representativeness, and overconfidence. In contrast, availability, loss aversion, and regret aversion do not play a significant role in the speculative behavior of individual traders. The coefficients of determination indicated that 34.5 % of speculation behavior is explained by the influence of heuristics and framing factors Introduced in this study. The findings of the study provide important implication to Capital Market Authority to structure appropriate training and education program to ensure that individual stock traders are able to make better and wiser buying decisions.
Despite the valuable findings of this study, there are also limitations to be acknowledged. Findings cannot be generalized broadly to Saudi Arabia due to the scope of the study. Lastly, the survey used in this study was developed, pretested, pilot, tested and distributed in the Arabic language before being translated into English for analysis and reporting purposes, which could lead to interpretation bias. The future research related to this study could be expanded by (1) Conducting the study in other cities in Saudi Arabia, (2) including different heuristics in the model, and (3) replicating the study in a similar country like the United Arab Emirates.
References
- Al Ashikh, A. (2012). Testing the Weak-Form of Efficient Market Hypothesis and the Day-Of-The-Week Effect in Saudi Stock Exchange. International Review of Business Research Papers, 8 (6), 27 – 54.
- Barber, B., & Odean, T. (2001). Boys Will Be Boys: Gender, Overconfidence, and Common Stock Investment. Quarterly Journal of Economics.116, 261-292.
- Barber, B., & Odean, T. (2006). All that Glitters: The Effect of Attention and News on the Buying Behavior of Individual and Institutional Investors. EFA 2005 Moscow Meetings Paper. SSRN Working Paper.
- Barber, B., & Odean, T. (2011). The behaviour of individual investors. SSRN Working Paper.
- Barber, B. & Odean, T. (2013). The Behavior of Individual Investors. In Handbook of the Economics of Finance Volume 2A, ed. G.M. Constandtinides, R. Harris,and R.m. Stulz, 1533 -1569. Oxford: North Holland.
- Bashir, T., Javed, A., Ali, U., Meer, U. I., & Naseem, M. M. (2013). Testing of heuristics interrupting the investor’s rational decision making. European Scientific Journal, 9 (28), 432-444.
- Benartzi, S., & Thales, R. (1995). Myopic loss aversion and the equity premium puzzle. Quarterly Journal of Economics, 110 (1), 73-92.
- Brabazon, T. (2000). Behavioural Finance: A new sunrise or a false dawn? Proceedings, CoIL/EvoNet Summer School, University of Limerick, September 2000.
- Chuang, W., & Soo Lee, B. (2006). An empirical evaluation of the overconfidence hypothesis. Journal of Banking & Finance, 30 (9), 2489–2515.
- Daniel, J. (2011). Sampling Essentials: Practical Guidelines for Making Sampling Choices. SAGE Publications, Inc.
- DeBondt, W. F. M. & Thaler, H. R. (1985). Does the stock market overreact? Journal of Finance, 40 (3), 793-808.
- De Bondt, W. (1992). Earnings Forecasts and Share Price Reversals. CFA Research Foundation Publications.
- Dhar, R., & Kumar, A. (2001). A non-random walk down the main street: Impact of price trends on trading decisions of individual investors. Working paper No. 00-45. International Centre for Finance, Yale School of Management.
- Galinsky, A., & Mussweiler, T. (2001). First offers as anchors: The role of perspective-taking and negotiator focus. Journal of Personality and Social Psychology, 81(4), 657–669.
- Goetzmann, W., & Peles, N. (1997). Cognitive dissonance and mutual fund investors. Journal of Financial Research, 20 (2), 145-58.
- Hair, J., Black, W., & Babin, B. (2009). Multivariate Data Analysis. Prentice Hall.
- Hair, J., Hult, T., Ringle, C., & Sarstedt, M. (2013). A Primer on Partial Least Squares Structural Equation Modeling (PLS-SEM). First Edition. SAGE Publications, Inc.
- Islam, S. M. N. , & Watanapalachaikul, S. (2004). Empirical Finance: Modelling and Analysis of Emerging Financial and Stock Markets (Contributions to Economics) First Edition. Physica. Springer
- Kahneman, D. (2013). Thinking, Fast and Slow. Farrar, Straus and Giroux.
- Kahneman, D., & Tversky, A. (1979). Prospect theory: An analysis of decision under risk. Econometrica, 47(2), 263-291.
- Kosnik, L R. K. (2008). Refusing to budge: a confirmatory bias in the decision. Mind & Society, 7(2), 193-214.
- Krähmer, D., & Stone, R. (2005). Regret in Dynamic Decision Problem. Discussion Paper Series of SFB/TR 15 Governance and the Efficiency of Economic Systems 71, Free University of Berlin.
- Lakonishok, J., Shleifer, A., & Vishny, R. (1994). Contrarian investment, extrapolation and risk. Journal of Finance, 49 (5), 1541-157.
- Mehra, R. (1985). The equity premium: A puzzle. Journal of Monetary Economics, 15(2), 145–161.
- Park, J., Konana, P., Gu, B., Kumar, A., & Raghunathan, R. (2010). Confirmation bias, overconfidence, and investment performance: Evidence from stock message boards. SSRN Working Paper.
- Pompian, M. M. (2012). Behavioral Finance and Wealth Management. Second Edition. Hoboken, New Jersey: John Wiley & Sons, Inc.
- Pride, W. M., & Ferrel, O. C. (2014). Foundations of Marketing. 6th Edition. Cengage Learning.
- Rabin, M., & Schrag, J. (1999). First impressions matter: A model of confirmatory bias. Quarterly Journal of Economics, 114 (1), 37-82.
- Rietz, T. A. (2005). Behavioral Mis-pricing and Arbitrage in Experimental Asset Markets. Working Paper, Iowa City: University of Iowa.
- Rioux, L. D., & Russo, E. R. (1988). An availability bias in professional judgment. Journal of Behavioral Decision Making, 1(4), 223–237.
- Schabacker, R. (1997). Technical Analysis and Stock Market Profits. 1st Edition. FT Press.
- Scheinkman, J. A., & Xiong, W. (2003). Overconfidence and speculative bubbles. Journal of Political Economy, 111(6), 1183-1220.
- Seiler, M., Seiler, V., Traub, S., & Harrison, D. (2008). Regret aversion and false reference points in residential real estate. Journal of Real Estate Research, 30(4), 462-473.
- Shefrin, H., & Statman, M. (1984). Explaining investor preference for cash dividends. Journal of Financial Economics, 13(2), 253–282.
- Shefrin, H., & Statman, M. (1985). The disposition to sell winners too early and ride losers too long: Theory and evidence. Journal of Finance, 40(3), 777–790.
- Stäheli, U., & Savoth, E. (2013). Spectacular Speculation: Thrills, the Economy, and Popular Discourse. Stanford University Press.
- Statman, M., Thorley, S., & Vorkink, K. (2006). Investor overconfidence and trading volume. Review of Financial Studies. 19 (4), 1531-1565.
- Shleifer, A. (2000). Inefficient markets: An introduction to behavioral finance. Oxford: Oxford University press
- Thomaidis, N. S. (2004). The implications of behavioral finance for the modelling of securities prices.Working Paper, Department of Financial Engineering, University of the Aegean.
- Tversky, A., & Kahneman, D. (1974). Judgment under uncertainty: Heuristics and biases. American Association for the Advancement of Science, 185(4157), 1124-1131.
- Tversky, A., & Kahneman, D. (1971). Belief in the Law of Small Numbers. Psychological Bulletin, 76 (2), 105-110.
- Zielonka, P. (2004). Technical analysis as the representation of typical cognitive biases. International Review of Financial Analysis, 13(2), 217 -225.
Copyright information

This work is licensed under a Creative Commons Attribution-NonCommercial-NoDerivatives 4.0 International License.
About this article
Publication Date
31 July 2018
Article Doi
eBook ISBN
978-1-80296-043-3
Publisher
Future Academy
Volume
44
Print ISBN (optional)
-
Edition Number
1st Edition
Pages
1-989
Subjects
Business, innovation, sustainability, environment, green business, environmental issues, industry, industrial studies
Cite this article as:
Alsedrah, I., & Ahmed, N. (2018). Behavioral Finance And Speculative Behavior Of Investors: Evidence From Saudi Stock Market. In N. Nadiah Ahmad, N. Raida Abd Rahman, E. Esa, F. Hanim Abdul Rauf, & W. Farhah (Eds.), Interdisciplinary Sustainability Perspectives: Engaging Enviromental, Cultural, Economic and Social Concerns, vol 44. European Proceedings of Social and Behavioural Sciences (pp. 604-618). Future Academy. https://doi.org/10.15405/epsbs.2018.07.02.65