
A Research Of Implementation Lean System In Indonesia’s Smes Creative Industry


Abstract
This research focus on how to help Indonesia SMEs manufacturing could be more competitive by using the fittest operation management in their plant. It believes that by improving their system it could be boost their productivity. Once the productivity increase means they are also more competitive in the industry. First, it will examine the background of implementation Lean system in some Indonesia SMEs manufacturer. Second, it will investigate whether once they are using one of operation management methods in example lean system, doubting the productivity will be increasing. The research will be taken and collect data at Java and Bali islands as believes the area more concentrated in creative industry rather than other regions in Indonesia. The focus in creative industry only chosen due Indonesia currently has significant increment on Creative industry and boost up many young entrepreneur and contribute a lot in Indonesia’s GDP. The limitation only at time and the big coverage of research area, also the agreement and the acceptance of the manufacturing to be sampling in this research, hopefully the sampling target could be reach as the cooperation in between parties are important to finish up this research. And the urgency on how this research result might help Indonesia SMEs creative industry in term of to be more competitive and efficient specially in facing AFTA era.
Keywords: Operation managementsupply chaincreative industryentrepreneurSMEs industry
Introduction
The new era of creative industry boosts up and increase recently caused by the growth of economic also the emerging of to find the suit job or to provide the new working field for unemployed people. The creative industry terminology itself popular by UK government Department for culture, Media and sport DCMS (2006) classified to be: Advertising, Architecture, Art and antique markets, Crafts, Design (including communication design), Fashion, Film, video and photography, Software, computer games and electronic publishing, Music and the visual and performing arts, Publishing, Television, Radio.
Indonesia as a country is famous with strong culture where every area or region has their own creative product root by their religion, ethnicity or culture heritage from their successor. This inherits brought forward to some people and they try to make it to be a commercial product and generate money. A good example to review is Jepara, a town in Central Java, since their successor are famous with crafting, and currently we could see the product goes to overseas and being export, they famously known with teakwood carving and many other of wood crafts or in Bali for handicrafts or in West Java for fashion, garment and apparel.
Mostly as they are only working for home industry or even on their traditional workshop, they don’t have any management at all. If any order they will produce for the requestor, if not they will not do anything. Along with the increment of export request form overseas buyer, where they came from different country and different export requirements, it urge them to improve their production skill even in production management such quality system or otherwise they will lose the order. The quality system still traditional, as of someone doing checking for the finishing product and separating the good quality only then export it. But due lack of knowledge sometimes they are misinterpreting the requirements and causing penalty, this story should be not happened if they have appropriate knowledge on production management.
Lately buyers will help the manufacturing to translate and train their quality standard and specification before they place order, and years later more manufacturers have proper knowledge. Some home industries already implemented simple operation management. They started from the first stage such collecting and selecting raw material based on buyer requirement, then move up to quality control. Still simple as they only make the record using book, but it one good movement from very traditional become more aware on their quality. Later, the era of ICT (Information, computer and technology), they used simple system to keep their inventory record, or at least they already have the excel sheet to make easy on controlling their production cost. Machinery also updated. As in the past probably a bit difficult to find a right supplier but now so easy only searching the needs through internet they could meet up.
Then, currently many manufacturing already implemented an impressive operation management system such Six-sigma, Toyota way, Kanban, and Lean. With this phenomenon writer want proves whether lean management system is the answer of Indonesians SME’s manufacturing to improve their productivity or maybe they don’t even start it yet?
The objectives of this research are to investigate the current condition of Indonesia’s SME manufacturing condition, checking whether the implementation of lean management system already adapted by Indonesia SME’s manufacturing, check and review whether Lean management system match with Indonesia infrastructure condition, to validate whether only big manufacturing who implement lean management system, the impact of lean management system on improving Indonesian SMEs manufacturing efficiency and productivity.
Problem Statement
The increment of Export index level in creative industry especially for Fashion industry where it contributes to GDP at 63.3 % for 2010 followed by crafts at 33.2 %. The sector made up of thousands of SMEs at an estimated 6.74% of total companies in Indonesia and it major source of new entrepreneurism among the country youth. Contribution to export increased by over 35% from 2006 to 2010 which is impressive considering its relative novelty as a commercial subsector. While the Indonesian worker productivity is still lower compare to Thailand, Vietnam, Philippines, Singapore, Malaysia and China (USAID, 2010) even according to McKinsey Global Institute report (2012), it mentioned the productivity level only a half of Malaysia workers.
Research Questions
The following questions will be input as questionnaire development: (1) The number of employee (range: <20, 20-50, 50-100, >100), (2) Operational hours, (3) Employee schedule: Normal/shift, if shift how many times a day, (4) Detect should there is a division/production sub unit, (5) Monthly capacity, (6) Production output:
Domestic Market
Export/Global market
Combination (determine percentage as per point A, B)
Also we collect below data to find effectivity level (see table
Machinery Data
-
Machinery operation: Computerized/un-computerized, detect should any ICT tools usage, if so will mention the software/system name
-
Detect should any queuing order, if so factory will explain the current system operate on their plant. And researcher will conclude whether the system will classify as manual, automation or systematic.
-
If the decision is automation or detected as systematic factory will draw their production flow
-
How long the system operates in the facility
-
Detect where the system urge coming from:
-
Management/company condition
-
Buyer/competitor/regulator
-
-
Detect whether the factory has previous system, if so factory will advise for the difference and benefit of before and after implement the new system.
-
Additional information which may significantly occur in factory production management.
Purpose of the Study
This research mostly discusses about the lean system in SMEs creative industry where researcher wants to know whether detection of lean industry could be valid or not
Theory benefit
Contribution of this research to theory development, expected the result could answer the problem statement whether lean system already implemented or not, remind very rare to see any lean system implementation at creative industry specially at handmade products.
Practical benefit
To share the result to the SMEs players where the possibility to implement the lean system to their production line will bring effectivity and efficiency.
Research Methods
The Research
The definition of research (Kothari, 2004) is a scientific and systematic search for pertinent information on specific topic (Sekaran & Bougie, 2016). The methodology could be primary or secondary.
The basic types of research are as follows:
Descriptive vs. analytical: Descriptive research includes surveys and the fact find enquiries of different kinds. The major purpose of descriptive research is description of the state of affair as it is existing at present.
Applied vs. Fundamental: Research can either be applied (or action) research or fundamental (to basic or pure) research. Applied research aims at finding a solution for an immediate problem facing a society or an industrial/business organization, whereas fundamental research is mainly concerned with generations and with the formula of theory.
Quantitative vs. Qualitative: Quantitative research is based on the measurement of quantity or amount. While qualitative is concern with qualitative phenomenon i.e. Phenomena relating to or involving quality or kind.
Conceptual vs. Empirical: Conceptual research is related to some abstract idea(s) or theory. While empirical research relies on experience or observation alone often without due regard for system and theory.
Some other types of research: All other types of research are variations of one or more of the above stated approaches.
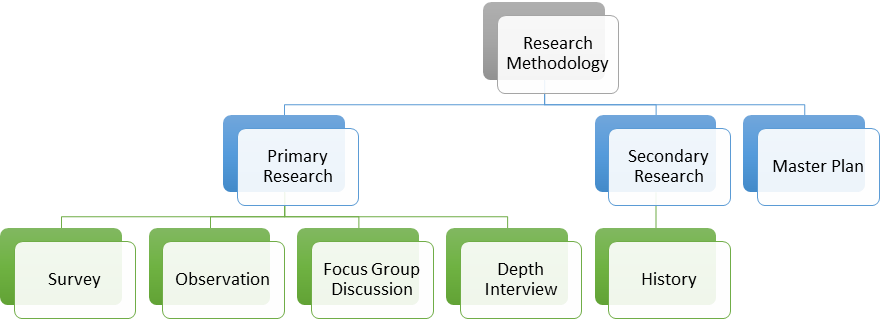
In refer to how this research collecting data writer followed (Zikmund G., 2003). The further research will be using Primary Research, Secondary Research, and Master Plan. Primary Research itself consists of survey or investigation field, observation, focus group discussion, and depth interview. Secondary Research itself consists of historical data. The Master Plan itself is the whole planning or known also as timeline for the research (see figure
Primary Research
As described before, primary research also known as qualitative research. The primary research consists of survey, observation, focus group discussion, and depth interview. Each research has its’ own purpose, but the result is qualitative data.
Survey
Survey itself is the way of asking respondents (representative of samples) for information by verbal or written questioning. Gather information through surveys will be quicker, inexpensive, more efficient and accurate, and flexible (see table
-
Observation
Observation itself has definition where actions of people monitoring someone or something. Things that can be observed are physical actions, verbal and expressive behavior, spatial relations and locations, temporal patterns, and verbal as pictorial records.
Focus Group Discussion
The definition of Focus group discussion is where gather samples of respondents to obtain insight and feedback towards the objects of problems. Other purpose of this research is to strengthen hypothesis or gain more views toward the objects of the problems.
Depth Interview
Depth Interview is where we conduct one-on-one interview with chosen person; give away questions where we have ability to dig more for every question. In this part of research, our chosen respondent is the one who familiar with our subject.
Secondary Research
Secondary data analysis is the use of data that was collected by someone or some institution for some other purpose. It could be from books, internet, company’s record or data cloud.
The Operation Management
The operation management Taylor, & Taylor (2009) as shown figure
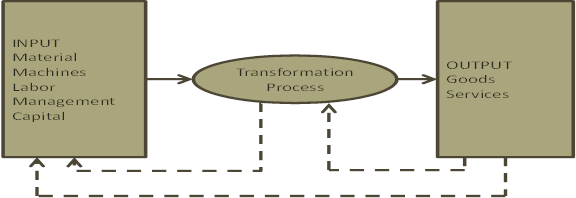
Obviously, “Operation” can take many different forms. The transformation process can be: (1) Physical, such as manufacturing operations; (2) Locational, such as transportation or warehouse operations, (3) Exchange, such as retail operations, (4) Physiological, such as health care, (5) Psychological, such as entertainment, or Informational, such as communication. While the Evolution of operation management covered following areas: Craft production, Division of labor, Interchangeable parts, Scientific management, Mass production and lean production. This research more focus on Lean production system. The definition of lean system is an integrated management system that emphasizes the elimination of waste and continuous improvement of operation. The lean production is the result of the mandate to eliminate the waste. It is composed of ten elements: Flexible resources, Cellular layouts, Pull system,
Methodology/Materials
We’ve colleting samples around Java island for 25 SMEs respondents and use mix methods model to analyze data. They are coming from various creative industry product, from design product until textile. The respondent is participating and selected as per their willingness to do this research. But, the respondents were identified as handmade products. Based on the data we will classify them as SMEs to be as follow:
Considerately as small
Workers below 20 employees, machinery not really established as a main of the system, it only supports to make the process running well or if it is any still very standard and just to fulfill the needs. Quality control seems as problem also, due they don’t have any specific dividing department the task scheduling also sometimes overlapping. Sometimes the quality control only done at the shop before the product displayed and the store keeper did it. Workers will take as much as possible they could do to overcome job coming in. No clear role. The figure below taken from one data sample who produce a handmade weaving fabric using ATMB (Alat Tenun Bukan Mesin) or traditional weaving tools. In the past, they put people working together at the same facility, from starting until end process done in the plant. Currently, the preparation will do at workers home from setting the tool petals (Penyetengan), patterning (Pembuatan Pola), and knotting (Pengikat benang), dying or coloring (Pencepulan warna), drying (Penjemuran), unraveling or taking out the bad quality thread (Mbatil), spinning the threads (Mbungkur), setting the spindle thread to the weaving tools (Nyekir) and it ready to weave (Menenun).
After finishing product done, it is about 10-15m/machine/day for plain fabric and 2.5-3m/machine/day for motif, they will bring it to the store and will be checking by the store keeper as finishing before display in the store, not even they need to pack it in polybag or other packaging method, they just displayed it as is on the shelves. The decision made due there is an urge from the government about minimum standard wage (UMP), if workers continue to work in the plant the owner should deal with their standard wages, and they still not ready for that. This story happened in other data samples such Batik fabric, Sasirangan Fabric, jewelry or seems it happened to almost handmade product makers. If we could summarize the process it will be: Preparing raw materials, Producing and Selling. It is as simple as that, the owner usually only thinking for sales continue and repeat. Un-detected operation management will not suspend them to be not productive or innovative (Putra & Djazuli, 2011), probably because of usually they are still dealing with small volume, doing domestic order which usually less intention on the quality control.
Medium progress
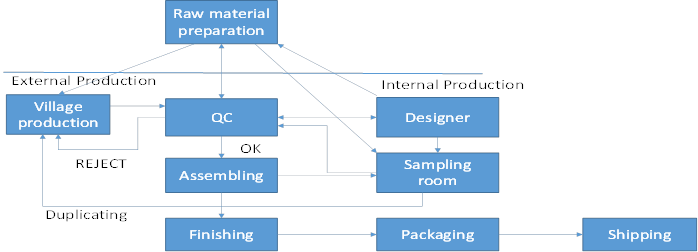
Workers in between twenty more to fifty or even for some almost hundred, machinery seems working more to their function and they already had implemented system although still simple, but the production process flow already clear. The data sample coming from one Crochet bag maker, it also homemade product, using industry cell system at villages, makers are coming from vary areas locally, in example farmer’s wife will do nothing if they don’t come to field, and they are gathering at one place or just doing it in the house at their spare time. Then the un-finishing product will collect and pool to the factory. Understand from the below chart, Quality control role already became as a dominant player, as every section will go through Quality control department first before going to other process. (1) Raw material preparation, after the material come from suppliers it will go to Quality control to check before spread to the external or internal production, (2) Sampling room also has QC process, as all samples could not go out without any approval from QC and buyer, (3) After the un-finishing good coming from village, they need to check by Quality control also, if rejected then go back to village as return good for fixing up or goes to sampling room if the reject is minor, (4) At assembling level, the un-finishing product goes to sewing line, adding up hardware and accessories, then it goes to Quality control for screening again., (5) Further, it goes to packaging, and here the last QC checking end up before goes to shipping department.
Big
Workers usually more than hundred, machinery almost complete, at least they have their own internal facility. In case of classification B example previously, we found data from some similar product but they already did for export, and usually export will deal with buyer high demanding, or buyer quality standard or with higher united/country/federal/organization regulation. Here, the QC process will be based on buyer requirement, such SQL system, TQM, FSC, SVLK both regulation from our country or destination or other Quality Assurance qualification and standard. One of respondents, PT Kalingga Jati, they confirmed already implement the operation system of FSC since 2012 due the urgency from buyer requirement and SVLK since 2013 from Indonesia government push. The steps as follow: (1) Preparation Material from beginning already classified as FSC or SVLK due the action and application is different also the finishing good will be going to different destination and different destination will have different regulation, (2) The wood classification will go to the accepting department and they will do grading to classify again whether the raw material fulfill the requirement or not. The classification will be FSC board, SVLK Board and Un-classification. For the meet requirement materials, it will go to further process, un-classified will consider as Defect materials. (3) The next process is Production, then go to Quality control department before they labelled as FSC or SVLK product before they are all departure to the principal country destination.
In counterpart with Kalingga we got sample from PT Buana Multi Pratama, they claimed applied COC system on their line for almost 10 years now, COC is stand for Customer Order Cycle, the process of the supply chain management from start to end, COC system is one of the Lean system example. It is more efficient due it easy to detect from the finishing product backward to the source of the raw material. They also claimed after implemented this system there no waste or zero defect as all the excess will transform to be useful product such handicraft or sell it to the next industry need.
Observation and depth interview Data
The structure of integrated policies as follow (Simatupang, 2002): (1) Major Policies: Target market segmentation and positioning, (2) Secondary Policies: Aligning customer expectations with logistic capabilities, (3) Operational Policies: Procedures, standard operating procedures and rules. Mostly respondent discussed that they are in the secondary policies where they are trying their best to meet buyer expectations. A good sample coming from Furniture maker, the urgency of using production system not only coming from internal but also external such coming from buyer or association organization. In example FSC is one of association group where the member should follow for their rules, with feedback buyer also more respect to the producer, this organization controlling all their member to always check the raw material in terms of the legality, environment sustainability as current the world more concern for all mother-nature product coming from.
In the depth interview they confirmed the reason of changing habit and system is due many buyer specially whose coming from Europe will set up their quality standard not only for product and market impact but more too society impact. Specifically, if we talk about Furniture Industry it always dealing with country regulation, in issuing global warming of Deforesting effect, many regulators will make their own regulation to prevent illegal process of the product coming to their country. This regulation will make small players difficult to follow on, they prefer not to take Exporting order due this high requirement. PT Kalingga Jati one of the company who become a member of FSC. FSC is the worldwide organization stand for Forest Stewardship Council, their mission is to “Promote environmentally appropriate, socially beneficial and economically viable management of the world’s forests” (FSC). Furthermore, the urgency also coming from Indonesian Government as they decided to apply SVLK (Sistem Informasi Legalitas Kayu) or Wood Legalization Information System, the system expected to prevent from illegal logging and extreme Deforesting. The regulation itself still not strong yet, but many industry players already applied and become the member of it. The system filtering the players itself, and usually should any new regulation it also dealing with some money, therefore only big capital owned companies who could follow this. Many complaints coming from the field, seems it slow down the production as the material coming very slow to the field, as it must be checking and classified first by the government before they could use it to their product also some opinions that SVLK wood still not accept in Europe, so Government still review about this regulation. The other example is coming from Bag crochet in PT Vainaastee and PT Dewi Mahasadu, as they already implemented Lean system also but not really indicate on system selected due the uniqueness of their product, they made their own applicable system to their production line. As they really depend on their village production management. The implement system at first is not really on how to achieve their production effectivity but more to fulfill buyer request. In example QVC is traditional buyer from America but due they are dealing with Europe market where need high standard they need apply for specialty assurance such AZO free product and need to do an independent lab test to their product, also need applying AZO free certificate. It almost slow down them but they still do it rather than loose the potential buyer.
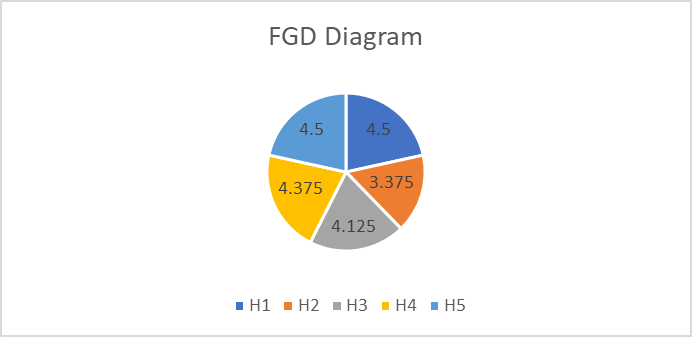
Focus group discussion Data Hypothesis:
Based on the table
Secondary Data
Some of data coming from personal record such Sasirangan industry in Banjarmasin Kalimantan Barat, the validity of the data also enriching from Journal (Putra & Djazuli, 2011). Various data coming from blogs, company websites and google where bibliography listed at the last page of this journal
Findings
Classifications lead into something?
Based on factors as per research objectives the samples classified into three group: small, medium to big. All classification has their own characteristic.
Small
Number of employee less than twenty.
No clear job division
Limited machinery
Limited ICT usage, should are they, it is only for telecommunication, administration and design purpose.
No indication of Operation system detection
Medium
Number of employee more than twenty up to hundred.
Already had clear job division
Significant number of machinery
ICT use up not only in regular basis but also operational
Operation Management system already detected although for some it still simple system.
Big
Number of employee more than hundred
Complete Machinery
Maximize ICT usage
Indication of Operation System Detection, even some of them already run Lean system
ICT and operation system detection
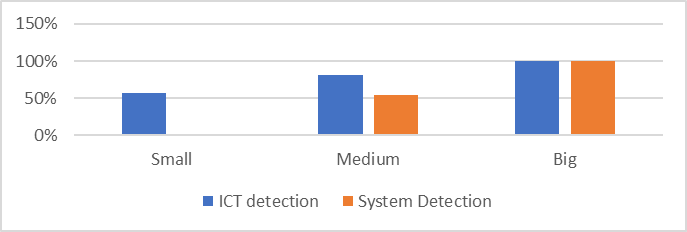
Based on data collecting as per prediction the concern only at small-to medium size as found some data although we detected it but will not significantly the company also implement system in their production line (see figure
Conclusion
The shifting of supply chain direction
The number of operation system detection ranging from medium to big classification, if ICT detected automatically the operation system also detected, this research still not classify them to be of what kind of system they implement at, but at least it proven that they had system on their production line, whether Lean system or others. Hence it will need another research to dig the information more on this aspect (see table
The shifting where going to positive direction where more from small classification use up more ICT tools than before soon or later they will implement the system too. Increased domestic and global competition, rapidly changing market trends, as mentioned in introduction will make them awake otherwise they will lose their competitiveness. The reaction answered in the medium classification, where they are ready to face the changes, it proven about 60% of them already had operation management system on their line. And surprise on the big classification proven 100% even some of them already had establish Lean system.
The contributions change
The shifting not only made the Indonesia’s SMEs manufacturing condition, but contributes a lot to the stakeholder.
“
Customers are the best pusher for changes, if customers happy means all the entire processes specially production chain smoothly running. The practice of the integrated supply chain implementation helps SMEs to be closer to their customers as well (Morissey & Pittaway, 2006).
Suggestion
Due the limitation of time and resources, this research need to rehearse and conduct more, and collecting more samples, also specially when researcher could not find previous research to back up the contingency of the data. Also, the research subject is something that always changing following the industry dynamic condition. Therefore, researcher probably will conduct further research and welcoming other researcher to continue this research as well.
What’s next?
Seems Indonesia SMEs creative industry coming to the new era for more systematic operation procedure and system, positive reacting for the new shifting is a good contribution to the better amplify. The readiness to face the globalization increased, although they are still classified as SMEs but soon or later some of them could be LE soon proven by Lean system found detection.
Need hardworking and big investment but worth at the end, to whom refused maybe will disappear unless they are blend to the wave also. So, could be all small classification change and implement system soon?
References
- DCMS. (2006). UK government Department for culture, Creative Industry Classification, Media and Sport. http://www.culture.gov.uk/
- Kanabiran, G, & Bhaumik, S. (2005). Corporate turnaround through effective supply chain management: the case of a leading jewellery manufacturer in India. Emerald.
- Kothari, C.R. (2004). Research Methodology: Methods and Technique.
- McKinsey Global Institute report. (2012). www.mckinsey.com
- Morissey, J.W., & Pittaway, L. (2006). Buyer-Supplier Relationships in small firms, International Small Business Journal, 24(3): 272-298
- Putra, D. S., & Djazuli, A. (2011). Pengaruh strategy Resource-Based terhadap keunggulan Bersaing Yang di Mediasi oleh Orientasi Kewirausahaan (Studi Pada Usaha Kecil Menengah Sasirangan Kota Banjarmasin). Surabaya: DIRJEN DIKTI.
- Sekaran, U., & Bougie, R. (2016). Research methods for business: A skill building approach. John Wiley & Sons.
- Simatupang, T.M. and Sidharan, R. (2002). The collaborative supply chain, International Journal of Logistic Management, 13(1).
- Taylor, A., & Taylor, M. (2009). Operations management research: contemporary themes, trends and potential future directions. International Journal of Operations & Production Management, 29(12), 1316-1340.
- USAID. (2010). Annual report-2010. www.usaid.gov.
- Zikmund, W.G. (2003). Essential of Marketing Research. 9th Edition. Mason: South-Western Cengage Learning.
Copyright information

This work is licensed under a Creative Commons Attribution-NonCommercial-NoDerivatives 4.0 International License.
About this article
Publication Date
01 May 2018
Article Doi
eBook ISBN
978-1-80296-039-6
Publisher
Future Academy
Volume
40
Print ISBN (optional)
-
Edition Number
1st Edition
Pages
1-1231
Subjects
Business, innovation, sustainability, environment, green business, environmental issues
Cite this article as:
Kom, A. K. S. S., Kom, D. H. S., & Saliha, G. K. (2018). A Research Of Implementation Lean System In Indonesia’s Smes Creative Industry. In M. Imran Qureshi (Ed.), Technology & Society: A Multidisciplinary Pathway for Sustainable Development, vol 40. European Proceedings of Social and Behavioural Sciences (pp. 1193-1206). Future Academy. https://doi.org/10.15405/epsbs.2018.05.93