
Grounded Theory For Assessing Economic Well-Being Loss Of Abandoned Shopping Centre Project


Abstract
This paper attempted to measure the opportunity loss of employment due to abandoned shopping centre development project by way of economic approach with a focus on the development of grounded theory methodology. This study employed both deductive and inductive approaches to conceptualizing the method. Data were analyzed by constant comparison of the comparable properties after building up the body of theory in determining the employment densities of shopping centres. The process, method and theory involved were used to develop a conceptual framework to assess the loss of employment opportunity resulting from an abandoned shopping centre development project. In the process, a market competition of retail supply analysis and conjoint analysis of occupational mobility factor was examined. With 215,700 sq.ft. of net lettable floor space, taking into account other competing shopping centres and the local market situation, as many as 5,118 persons within the catchment area could have lost those opportunities. However, only 3,141 employments can be absorbed by the said abandoned project, thus, the economic well-being loss due to its abandonment. With the average per capita income of RM 1,700 for the Malaysian population, the loss incurred by the society was RM 1,089,298,800 for 17 years of project abandonment.
Keywords: Abandoned projectshopping centreopportunity loss of employment
Introduction
A shopping centre development project together with its physical environment enhances the community’s economic well-being defined as materials living condition reflected in the indicators such as income and wealth, employment and earning, and housing (OECD, 2011). A shopping centre is a place where retail shops are located in a grouped form and constitutes diverse quality of products, food courts, amusement centre, clubs, cinemas, playing areas and relaxation spaces, commercial and retail shops (Terblanche, 1999; Hariyono, 2002). It acts as a commodity-generating entity with a variety of businesses and tenants derived based on the lettable floor space inside and outside the building. It generates business opportunities and, in turn, employment and job opportunities for the locals.
How a shopping centre development reflects on the economic well-being is described by the norm of shopping centre’s objective and its function. Theoretically, a shopping centre development acts as the ‘delivery infrastructure’ for the efficient connection of consumers with goods and services (ESCT & ICSC, 2008), and acts as a multiplier of retail sales volume by way of a targeted and planned tenant mix.
One of the principle aspects defining economic well-being is that economic activity should provide a better quality of life of the society, and the market production should enable persons to add value to the kind of life they value (Dalzier & Saunders, 2014). Thus, in the context of shopping centre development, employment opportunity generated constitutes the main benefits to the economic well-being of a community. The literature provides that the principle benefit identified by residents as a result of a new shopping centre is employment opportunities created (Tegner, 2009; Hammerson, 2013; Delic & Knezevic, 2016). Employment is very significant in contributing to the life's productivity of the community; persons employed have income and recognition, and the community gets better (Forstater, 2015). International Finance Corporation, 2008 (IFC) argued that a shopping centre represents a significant source of job creation, typically requiring one worker per 20 square meters of space. Statistics published by IFC (2008), a medium-sized, 50,000 m2 shopping centre employs approximately 2,500 full-time retail staff, plus 50-75 workers in management and support functions such as tenant relations, administration, marketing, cleaning, security, maintenance, gardening, and parking.
When a shopping centre development project is abandoned, employment opportunities were lost and this detracts from the quality of life as well as the economic opportunities of those living around the abandoned project. Although there is a series of research stating that the opportunity loss of employment is one of the impacts of the abandoned shopping centre development project, it is not assessed explicitly and further, there is no literature explaining the method of assessment.
Martin and Turner (1986), and Suddaby (2006) argued that grounded theory method is appropriate when no theory exists or when a theory exists but is too abstract to be tested, while it is not appropriate for the test of a theory or generation of knowledge from the objective reality. Therefore, the grounded theory is used for the development of a conceptual framework of methodological approach in assessing the opportunity loss of employment due to the abandoned shopping centre development project. The application of grounded theory in the context of employment opportunity loss with regard to abandoned shopping centre will contribute to the existing knowledge on the measurement of community’s economic well-being.
Problem Statement
Estimating opportunity loss of employment due to abandoned shopping centre development project is rather complex. It needs to be organized systematically to build up the conceptual framework to provide direction and steps in doing the analysis. The theoretical perspective indicates a few significant variables that must be considered in the context of opportunity loss of employment so that the methodological approach is more reliable and verifiable.
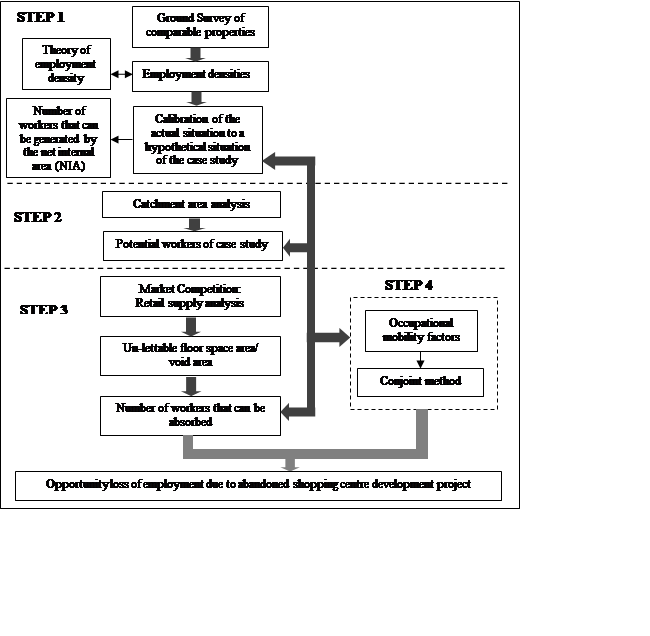
Because of the absence of past studies, there is no body of literature on the method or approach of assessment, and the grounded theory is proposed to address this issue. In principle, it analyses employment density pattern in a shopping centre by considering business and tenant mix and from that deriving the conceptual framework in determining the ‘employment generated’ by a shopping centre which is described in this study as ‘employment opportunity’. The grounded theory consists of four steps, namely theory of employment density, catchment area analysis, retail supply analysis, and occupational mobility analysis using conjoint analysis. Figure
Research Questions
The problem statement leads to several questions which to be answered, as follow:
How is the grounded theory employed for assessing opportunity loss of employment due to the abandoned project?
What are the variables used in estimating employment opportunity loss and what factors influence the determination of loss?
How much loss is incurred due to the abandonment of the project?
Purpose of the Study
The purpose of the study is to assess the opportunity loss of employment due to abandoned shopping centre development project by way of economic approach with a focus on development grounded theory methodology.
Research Methods
The concept of grounded theory
Grounded theory, developed by Barney Glaser and Anselm Strauss in the early 1960s, is a methodology for inductively generating theory that allows the researcher to develop a theoretical account in the empirical observation of data offering a logically consistent set of data collection and analysis procedures aimed to develop theory (Martin & Turner, 1986; Charmaz, 2003, 2006; Evans, 2013). The emphasis in grounded theory is theory development (Strauss & Corbin, 1994). These procedures allow for the identification of patterns in data that can help to drive theory that is empirically valid (Glaser and Strauss, 1967; Martin and Turner, 1986). This is so because the theory-building process is so intimately tied to evidence that it is very likely that the resulting theory will be consistent with empirical observation (Eisenhardt, 1989 cited in Fernandez, 2004). According to Glaser (1978), the foundation on the grounded theory method is systematic generating of theory from data that is systematically obtained from social research and offers a rigorous, orderly guide to theory development that at each stage is closely integrated with a methodology of social research. Cho and Lee (2014) stated that the aim of applying grounded theory is to generate a substantive theory that will explain a phenomenon in a specific context and suited to its supposed use.
However, Punch (1998) said that grounded theory is not a theory at all; it is a method, an approach, and a strategy, hence it is best defined as a research strategy whose purpose is to generate theory from data. ‘Grounded’ means that the theory will be generated on the basis of ground data; the theory will therefore be grounded in the data. ‘Theory’ means that the objective of collecting and analyzing the research data is to generate theory for a new situation. This means the theory will be developed inductively from data.
In the grounded theory everything is integrated; it is an extensive and systematic general methodology (independent of research paradigm) where actions and concepts can be interrelated with other actions and concepts. In the grounded theory nothing happens in a vacuum (Glaser, 1978; Glaser and Strauss, 1967). In principle, the grounded theory is a deductive method. This can be seen from researcher’s work i.e. ‘top-down’ from a theory to hypotheses to data to add to or contradict the theory (Creswell and Plano Clark, 2007). Trochim (2006) argued that deduction begins with the general and end with the specific, and arguments based on law, rules and other widely accepted principles are best expressed deductively.
Application of grounded theory for assessing economic well-being loss
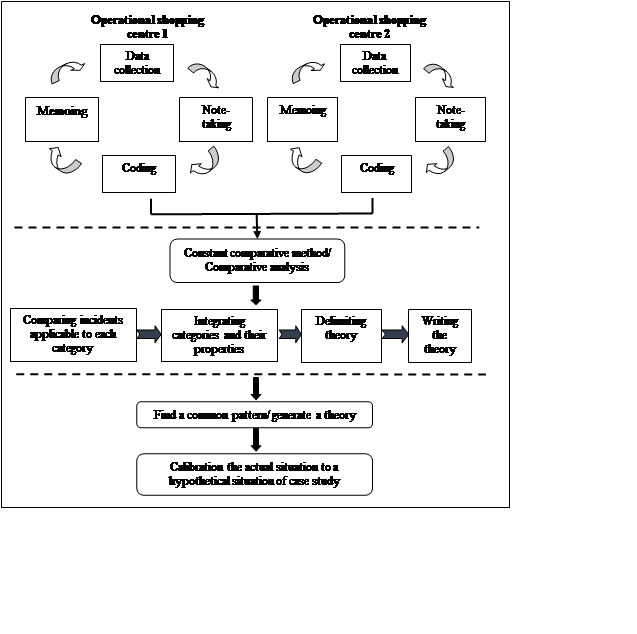
There are a few strategies in applying the grounded theory for identifying, refining and integrating categories to develop theory, namely constant comparative method, theoretical sampling and theoretical coding. This paper adopted the first method. The constant comparative method entails an iterative process of concurrent data collection and analysis which involves systematic choice and study of several comparison groups (Cho & Lee, 2014). This is important in developing a theory that is grounded in the data (Glaser and Strauss, 1967). Tesch (1990) stated that the main intellectual tool is comparison. The method of comparing and contrasting is used for practically all intellectual tasks during analysis: forming categories, establishing the boundaries of the categories, assigning the segments to categories, summarizing the content of each category, finding negative evidence, etc. The goal is to discern conceptual similarities to refine the discriminative power of categories and to discover patterns. According to Lillemor (2006), constant comparison method can be seen as the “core category” of grounded theory. In this approach, every part of data, i.e. emerging codes, categories, properties, and dimensions as well as different parts of the data are constantly compared with all other parts of the data to explore variations, similarities and differences in data. This method incorporates four stages, namely comparing incidents applicable to each category, integrating categories and their properties, delimiting the theory, and finally writing the theory (Glaser & Strauss, 1967). Throughout the four stages, the researcher continually sorts through the data collection, analyzed and codes the information.
In the context of this study, the abandoned shopping centre project identified is the case study while the nearby operational shopping centres act as a set of comparable properties. In assessing the opportunity loss of employment, the grounded theory method studies a few variables of the typical shopping centre for characteristic equivalence through a market survey on comparable properties. All the variables involved related to tenant’s profile classification and density will interact as units to produce outcomes through a process of data collection. Morse (2001) described the grounded theory as inductive in nature – contrary to what was discussed above. Glaser & Strauss (1967) argued that the benefit of using this method is that the research begins with raw data through which constant comparisons and substantive theory will emerge.
Figure
Generally, the potential employment generated from a single property is measured on the basis of employment density ratio, measured as square feet or square meter of required floor area per person (Deloitte, 2010), average floor space per full-time equivalent (FTE) member of staff (Dancer, 2015), or average number of employees per unit of floor space provided (Fleming, 2014). Theoretically, employment density ratio is used as a measure of the intensity of building use and it is an indicator of how much space each person occupies within the workplace.
Here, the deduction method plays its role. By deduction, the theory of employment density factor or employment space factor1 is applied as a basis for assessing the opportunity loss of employment. Then the approach inductively generates theory from the empirical set of data collection. Therefore, it can be said that the grounded theory adopts inductive as well as deductive orientation in investigating an issue.
To estimate employment density, there are a few other variables that should be considered. Discussion follows in the next section.
Employment density and its variables
According to Yee and Bradford (1999), employment or job density is measured as:
Employees per acre (parcel density). Density parameter is “floor-to-area ratios” (FAR). FAR = square footage of building / Parcel area
Square-foot per employee (building density). Density parameter is building density. Building density = square footage of building/number of employees
According to Deloitte (2010), The Royal Institution of Chartered Surveyors (RICS) recognizes three principal measurements of floor space, namely:
Gross External Area (GEA) – including walls, plant rooms and outbuildings, but excludes external space such as balconies and terraces.
Gross Internal Area (GIA) – the entire area inside the external walls of a building and includes corridors, lifts, plant rooms, service accommodation (e.g. toilets).
Net Internal Area (NIA) – the net let-table or ‘useable’ area of offices and retail units, including entrance halls, kitchens and cleaners’ cupboards, but excluding corridors, internal walls, stairwells, lifts, WCs and other communal areas.
In calculating employment density, it is imperative to understand the basis of floor space measurement and to use it consistently. If necessary, a given figure on one basis can be converted to the appropriate basis for employment density type, such as converting gross internal floor area to net internal floor area. Theoretically, a shopping centre comprises a group of retail and other commercial establishments developed and managed as a single property (Guy, 1998). Thus, there are a few components in a shopping centre such as department store (anchor store or draw tenant), stand-alone stores (small shops or satellite tenants or high street retailers), and food court and entertainment zone (cinema, entertainment, and sports centre). Therefore, the basis of floor space measurement for employment density for each component might be different (Table
The conversion of gross internal floor area to net internal floor area can vary significantly. Deloitte (2010) used 15-20% as a general benchmark for converting gross to net areas in office and retail properties. Table
Deloitte (2010) and Dancer (2015) stated that employment can be measured in several ways, as follows:
Actual – the number of employees who are full-time, part-time, or on contract
Full-Time Equivalent (FTE) – the number of total hours worked as a proportion of the average annual hours worked in a like-for-like full-time job:
1 FTE means a person works full-time, while 0.5 FTE means a person works half-time.
However, Dancer (2015) argued that in evaluating completed projects it is recommended that FTE numbers are used to measure employment achieved. Employment density ratio is the basis for estimating the potential employment (employment opportunity) that can be generated by an abandoned shopping centre development project. The above concept advocated by The Royal Institution of Chartered Surveyors (RICS); however employment density of shopping centre is different in each country. Furthermore, the employment density ratio of shopping centre space varies substantially based on the type of business. Thus, besides presenting the employment density guide used so far in the literature, it is necessary to compute the exact employment density ratio applied to a shopping centre by conducting ground surveys on the operational shopping centres (referred to as the comparable properties). While conducting the ground survey on the comparable properties, a few variables should be considered such as tenant’s business type or retails profile classification and the pattern of tenant’s profile allocation.
Tenant’s business type or retail profile classification should be determined by referring to the products and services of the respective stores. There are three main groups of tenant’s profile, retailers (selling products), services and entertainment units. We can use the term retailer as a collective noun for them, because all of them sell something, even if it is not a concrete product, rather, an intangible service. But, it is worth distinguishing between these three groups because they also cover the main functions of the shopping centre. According to Reikli (2012), entertainment appears as the second most important function besides retail, while the presence of services is just a subsidiary necessity. Classifying different tenant types and profiles is an extremely important task without which the employment density becomes un-interpretable and un-measurable. Because of that, retail profile classification is a significant variable in measuring employment density. Mustel group (2010), Reikli (2012), and Urban Land Institute (ULI) and International Council of Shopping Centre (ICSC) (2008) proposed the retail profile classification, as shown in Table
Retail profile proposed by Mustel group (2010) is a four-category classification, namely convenience, comparison, food and beverage, and entertainment and leisure. We consider that any of the above mentioned classification systems are adequately applicable; however, the classification by Reikli (2012) is applied in this paper because it is easier to understand.
During conducting the ground survey on comparable properties, the classification of tenant types and profiles should be made as Table
T = NW
Where T is the total net lettable area of floor space by retail profile, NW is the total number of workers. A simple quotient is then expressed as:
K= NW/T
Where K is the employment quotient, NW and T are as defined above. For example if T = 400 square feet and NW = 4 workers, K = 0.01. The effect of the employment quotient is such that any increase in the total net lettable area of floor space by retail profile has multiple impacts on the number of workers. This means, for each square foot of net lettable area of floor space, 0.01 number of worker will indirectly be created.
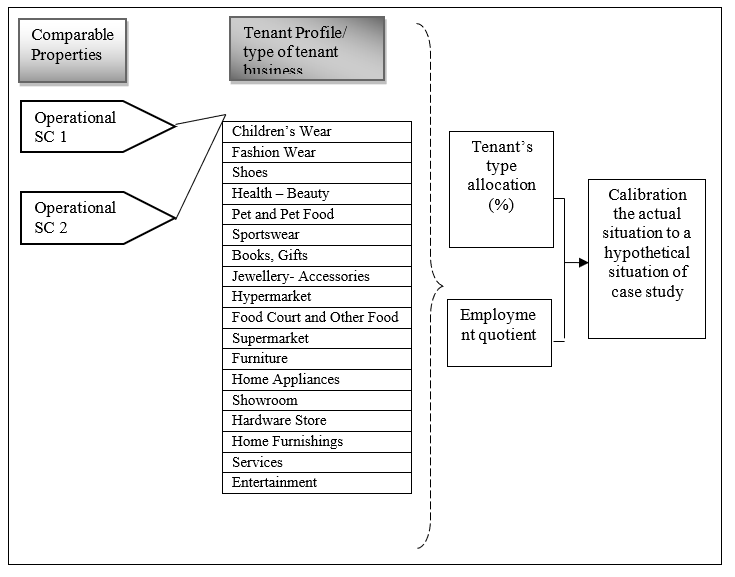
There are many types of retails profile and therefore, every retails profile will have different employment quotient. From the equation above, the total employment that can be generated by a shopping centre will be determined based on the net internal area (NIA) of floor space and then, accordingly to the retail profile classification. However, in the context of this study, the pattern of tenant’s profile allocation is unknown because the case study is an abandoned project. Therefore, it is necessary to do an analysis on the pattern of tenant’s profile allocation among the comparable properties. The results will come out in percentages and it will be used as a guide in making an assumption for determining the percentage allocation for every tenant’s profile that exists in the case study so that the employment density or opportunity loss of employment can be determined.
Using the data of the International Council of Shopping Centre, Baker (1999) carried out a survey on shopping centre tenant’s profile and he found that 45% of the area assigned to non-anchor tenants which is fashion-wear retailers, including women and family’s wear, and shoe (the ratio between women & family’s wear, and shoe is 1:4); 22.5% of home furnishing; 11.25% of home appliances, books, sports equipments, personal services and jewels; 6.1% of food including fast food and specialty food. In recent years, more and more shopping centres were built and the appearance of shopping centre shows a great progress on the retail development. Mouton (2014) cited that for typical space distribution in a shopping centre, the focus is on fashion and accessories, the importance is for a food store and leisure component (cinema, kids play area, bowling, etc.), and DIY element is not a priority. Further, the distribution percentages comprised 41% of fashion and accessories, 16% of food stores and food specialities, 9% of leisure and entertainment, 6% of kids and toys, 5% of coffee and restaurants, 5% of shoes, 5% of multimedia and electronics, 4% of sport equipment and fashion, 4% of health and beauty, 3% of household, and 2% of services (Mouton, 2014). However, the percentage allocated to any tenant’s profile classification proposed by Baker (1999) and Mouton (2014) is not suitable to be adopted because every shopping centre in a different country might have a different percentage for the pattern of tenant’s profile allocation. Furthermore, the pattern of tenant’s profile allocation also depends on the type and identity of a shopping centre. So, in this case, some analysis should be made to identify the percentages of each tenant’s profile allocated in every comparable property and the average percentages occupied by each tenant’s profile will be a benchmark in determining the pattern of tenant profile allocation. Figure
In assessing the opportunity loss of employment due to the abandoned shopping centre development project, there is a few assumptions must be used with caution. No one can legitimately claim to know the future with any degree of accuracy; the best one can do is to estimate a probable future of among many possible outcomes. A reputable assumption or prediction is an estimate based on the existing information. Again an analyst’s conservative forecast should solidly be grounded on the present realities. Even though the step shows in Figure
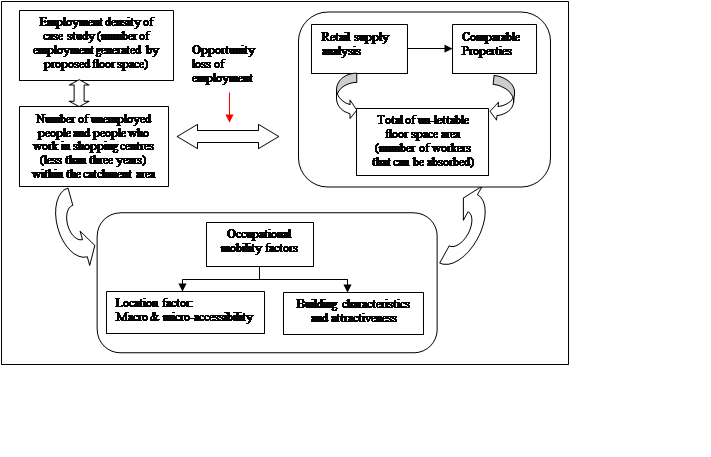
Competition is the rivalry among sellers trying to achieve such goals as increasing profits, market share, and sales volume by varying the elements of the marketing mix. A competitive market is one in which in a large number of producers compete with each other to satisfy the wants and needs of a large number of consumers. In a competitive market no single producer, or group of producers, and no single consumer, or group of consumers, can dictate how the market operates. Nor can they individually determine the price of goods and services, and how much will be exchanged. Competitive markets will form under certain conditions. In the context of this paper, ‘competition’ refers to how the floor space supply of the existing retail businesses, i.e. the comparable properties in the trade area is taken up in a competitive situation that exists in the market. Due to the competition, there will be un-lettable space or void in the comparable properties, and that space might absorb the potential workers of the case study, consequently decrease the number of employment opportunity loss. However, the absorption of employment by comparable properties is influenced by a few factors of occupational mobility (Figure
Market competition of retail supply analysis
Hamid (2007) cited that retail supply analysis consists of three main steps, firstly identifying the existing retail business outlets in the trade area, secondly estimating the total space available currently or in the foreseeable future, thirdly other descriptive evaluation of the business under study. The following steps are necessary to create the supply database. For each retail business, a reasonable estimate of floor space should be included in the database. In this context, the retail supply analysis will be conducted on the comparable properties through a market survey. Together, the total vacancy of lettable floor space area for comparable properties in the trade area will be identified, so that the number of potential workers that might be absorbed can be determined. The steps of supply analysis are as follow:
Retail supply analysis needs a database of the existing retail business establishments for each comparable property under investigation. The database will include all retail profile category in comparable properties within the trade area. The researcher conducted a ground survey to collect the database gross lettable area (GLA) of every retails profile category of each comparable property, the floor space of all retails profile category totalled up will then give the total space in a particular trade area.
Estimate the un-lettable space or void in the comparable properties. From the dataset obtained in the first steps, the researcher will identify the floor space of un-lettable area or void in the comparable properties and the floor space of un-lettable area will determine the number of workers that can be absorbed. However, the number of workers that can be absorbed by any comparable properties having un-lettable floor space or void is influenced by occupational mobility preferences/determinants. Generally, the attractiveness aspect of a shopping centre is the determinant of occupational mobility. Thus, the next step is important in order to measure the occupational mobility.
Collecting information on the relative strengths and weaknesses of each comparable property. The data will be obtained through the questionnaire survey on the retailers and workers in each comparable properties and the information needed is related to the occupational mobility preferences/determinants such as location, accessibility, building characteristics and attractiveness, etc.
There are a few instruments used while conducting a ground survey in doing retail supply analysis which are interviews, questionnaire survey, observation and also documentation.
Occupational mobility factors
Occupational mobility refers to the ease of movement of workers from one occupation to another either horizontally or vertically. Horizontal mobility relates to the movement of labour from one occupation to another in the same grade or level while vertical mobility relates to a worker of a lower grade and status in an occupation moving to another occupation in a higher grade and status. Occupational mobility in this paper refers to the horizontal mobility; an individual’s willingness to work at an identified ‘workplace’ from among the comparable properties. In terms of horizontal mobility, person’s preference tends to be related to convenience. According to Clulow and Reimers (2009), convenience is a term that can be applied to almost any human activity, be it work, travel, exercise, shopping etc. Convenience should therefore possess both a universal and context-specific meaning. The universal meaning relates to its generic definition – the meaning given to convenience irrespective of the activity being undertaken. This includes anything which is easy to use, favourable to comfort or savings of trouble. As such, convenience occurs when the barriers to the undertaking of an activity are reduced or eliminated. In this study, the terms of convenience tend to be seen in the aspect of the location.
Besides location aspect, product characteristics are also the important factors influencing occupational mobility. Examples of product characteristic are building characteristics and attractiveness. The shopping centre’s image as a determinant of shopping centre’s attractiveness may vary depending on the presence of the representative store. The two factors of occupational mobility are discussed in the next paragraphs.
5.2.3.1. Location factor
Location is one of the most important factors influencing many aspects of real estate decision making such as marketing, viability and feasibility of a property project, occupational mobility, business location, choice of employment, attraction to customers, etc. Location determines accessibility and, in turn, convenience. For market study purposes, these three attributes may be addressed as separate, but related factors. Further, accessibility and convenience are expressed in many ways, for example, by a distance from a workplace, travel time/ or cost, ease, and reliability of public transport.
According to Hamid (2006), accessibility addresses the degree of convenience or inconvenience involved in moving people, goods, and services between different loci of activity, measured in terms of time, cost and aggravation. Generally, accessibility will include distance, time travel and also a minimum cost of transportation. There are many definitions of accessibility, however, a general definition by Wachs and Kumagi (1973) is that accessibility is the ease (or difficult) that opportunities (e.g. employment) or services can be reached from a location. Curtis and Scheurer (2007) defined accessibility as a measure of the ease of an individual to pursue an activity of a desired type, at a desired location, by a desired mode and at a desired time. Accessibility captures the effort required to overcome the spatial separation of two locations, and usually reflects the utility (e.g travel from home to workplace) associated with travelling between these locations. It can be seen that accessibility is the important factors of convenience which influence in occupational mobility. Niedomysl and Hansen (2010) found that occupational mobility preference will simultaneously influence the choice of residential location as well as the commute mode. This means the location of residential and workplace are related to each other in occupational mobility preferences. Further, the residential location and workplace affect both the commuting distance and the relative advantage of a certain commuting mode among many alternatives in terms of travel time, which in turn influence the choice of commuting mode (Limtanakool et al., 2006).
Accessibility can be further divided into macro-accessibility and micro-accessibility (Gudonaviciene & Alijosiene, 2013). Macro-accessibility concerns to the quality and conditions of access road to the shopping centre, and the distance from home to shopping centre, while micro-accessibility refers to parking facilities within the centre and ease of navigation within the shopping centre (Finn and Louviere, 1996; Bell, 1999; Frasquet et al, 2001; Gudonaviciene & Alijosiene, 2013). Selection of shopping centre is related to the aspect of macro-accessibility, while the selection of stores operating in the certain shopping centre is related with micro-accessibility (Gudonaviciene and Alijosiene, 2013). In particular, macro and micro-accessibility are significant to occupational mobility preferences. Furthermore, macro and micro-accessibility, and convenience is part of the attractiveness attribute of a shopping centre (Wong et al, 2001; Sit et al, 2003; Yilmaz, 2004; Singh & Sahy, 2012; Gudonavicien & Alijosiene, 2013).
As of shopping centre, accessibility by car and public transport should be guaranteed. The positioning of the shopping centre is relative to the highway exit and public transport stop (Borgers & Vosters, 2010). Accessibility by car represents the ease to reach the shopping centre after leaving the highway. This is expressed by the number of obstacles between the highway exit and the shopping centre. Examples of obstacles are traffic lights and busy intersections. Accessibility by public transport is expressed by the time to walk from the nearest public transport stop to the shopping centre and vice versa. Theoretically, the accessibility variables are considered the time or distance to travel from home to the shopping centre.
Besides that, parking tariff is also the main decision variable influencing an individual to select shopping centre as a workplace. At certain main shopping centres, paid parking is imposed for the parking facilities. By including this attribute, the importance of the other attributes can be related to the importance of parking costs. Generally, the shopping centre that provides free parking facilities is more attractive compared to the shopping centre with paid parking facilities.
Therefore in the context of location factor, macro and micro-accessibility that will determine the occupational mobility are comprising three indicators which are: (1) the accessibility by car (referred to number of obstacles between the highway exit and the shopping centre: traffic lights and busy intersections); (2) the accessibility by public transport (referred to the time to walk from the nearest public transport stop to the shopping centre); (3) and parking tariff.
5.2.3.2. Product/ building characteristic and attractiveness
Building structures, the attractiveness of structure, functional efficiency, the business identity of the building and facilities are among elements of product characteristics (Hamid, 2006). They influence market taste, preference, and demand. Product characteristics and product design are the indicators that can attract an individual to fill up the opportunity of employment provided in comparable properties. Product design covers various aspects of product appearance and presentation, such as:
Basic features: building shape (cylindrical, curvature, angular), building orientation (facing sunrise, road frontage), roof (terraced, non-terraced), floor plan and space accommodation.
Building facilities: air-conditioning, floor and wall finishes, security system, etc
Outdoor facilities: foot-path, parking area, green landscape, security guard, etc.
An attractive design gives a pleasant look and creates aesthetic values of the product, gives convenience and creates a good image. Bodkin and Lord (1997) suggest the main criteria for choosing a shopping centre is the convenience of the location, a draw tenant, services offered by the shopping centre and a price level. Generally, can say that in the perspective of retailers or potential individual who wants to works in a shopping centre, the decision in selecting the shopping centre as a workplace is influenced by several factors such as convenience, the presence of a specific store in the shopping centre, services, facilities and safety. All the factors can be classified as the attractiveness attributes of a shopping centre, and those attractiveness attributes are significant in shopping centre selection criteria, either on the side of customers or retailers.
Gudonaviciene & Alijosiene (2013) argued that attractiveness and image are inseparable since most of their elements concur as attractive elements of a shopping centre form its positive image. Oftentimes, retailers and customer make a choice of a shopping based on its attractiveness and image. Being within a reputable shopping centre will definitely help in capitalizing on customer's high footfall so much so that a retailer's or tenant’s business is exposed with high possibility of profit (Kamashki, 2015).
Table
Findings
Technique of data collection
Based on the famous dictum of Glaser (2002), “all is data”, the grounded theory researcher may use many forms of data including observations, interviews, and documents, all of which could contribute in generating substantive theory. The technique of data collection is significant and important in contributing to the right steps in the context of methodological approach applied. The data collected is related to each other in order to develop a theoretical and analysis framework.
In this paper, data collection was carried out in several stages. The first stage involves the identifying the case study and a few comparable properties, hence the data needed is secondary data. All documentation related to details of case study including proposed building plan or layout plan is needed in order to identify the floor space area of a case study, while the details of a few comparable properties comprising the location, address, the floor space area, and building plan are also needed. Both details of case study and a few comparable properties are gathered from the Local Authority. Besides that, the details of comparable properties in terms of business tenant’s mix/ tenant’s profile, its percentage allocation in comparable property, floor space area provided for every tenant’s mix/ tenant’s profile, is also needed and significant in this paper; thus, the details are gathered from the Management Office of every comparable property. In addition, because of this paper applying grounded theory with the deductive orientation, there are a few instruments of literature is used such as reports, journals, and published sources related to theory and concept of employment density factors.
The second stage involves identifying and determining the employment density factors of comparable properties and the result will be calibrated to the hypothetical situation of a case study. Here the process of grounded theory with a inductive method is implemented. Employment density factor of every type of tenant’s mix or tenant’s profiles in comparable properties is identified and determined through a ground survey on comparables properties. The technique of data collection used is questionnaires survey, conducted on retailers or workers for each tenant’s mix in order to gather information related to employment density of their business’s profile (how many people work in their business), theirs experienced working environment and workplace, their preferable factors of occupational mobility (in the context of convenience, accessibility, and building attractiveness factors). Besides that, the questionnaires survey on retailers and workers of comparable properties is also important in order to identify the catchment area of a case study which is having a potential worker, and the data needed is the information of the distance from home to a workplace of every respondent.
The third stage is to estimate the number of a potential worker within the catchment area; therefore, the information needed is the total number of unemployed people and the total number of people who are working in the shopping centres (less than three years) within the catchment area. The information is gathered from the secondary data such as reports or documentation provided by Local Authority or publishes sources.
After the identification and determination of tenant’s mix or tenant’s profiles and it’s average percentages allocation in shopping centre, and the average employment density ratio (sq. ft. per person) based on floor space area for each type of tenant’s profiles, the result will be calibrated to the hypothetical situation of case study, so the total number of potential employment generated by case study is identified. However, to assess the opportunity loss of employment, market competition should be considered. Then, the fourth stage is to analyzed market competition in retail supply. The data and information are gathered through interviews, conducted on building manager for every comparable property. Besides that, site observation in every comparable property is also conducted to identify the un-lettable floor space or void area having there. In estimating the number of workers that will absorb by comparable properties, occupational mobility factors must be considered.
The fifth stage involves identifying the occupational mobility factors with employing the conjoint analysis. Occupational mobility factors are consisting of attractiveness attribute of shopping centres within the catchment area (case study and comparable properties). Conjoint analysis is a survey based statistical technique used in market research that helps determine how people value different attributes (feature, function, benefits) that make up an individual product or service. The objective of the conjoint analysis is to determine what combination of a limited number of attributes is most influential on respondent choice or decision making.
Data analysis
There are three options to analyze the opportunity loss of employment due to abandoned shopping centre, namely catchment area analysis, retail supply analysis, and conjoint analysis. The section below will explain the catchment area analysis and conjoint analysis. The retail supply analysis was explained in the previous section of this paper.
Catchment area analysis
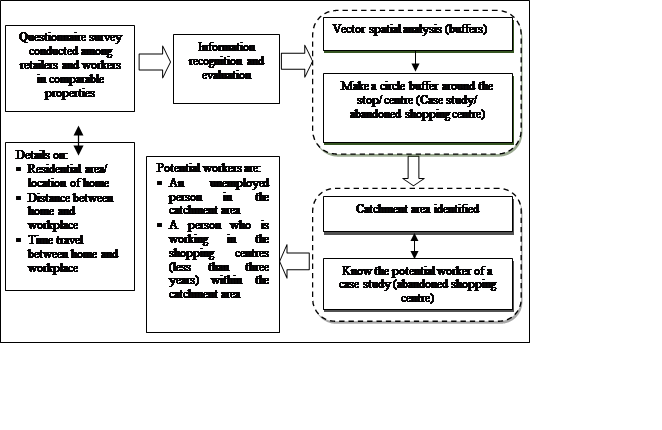
The simplest approach to catchment area analysis is by spatial buffering. Carried out using a GIS application, it uses spatial information to extract new and additional meaning from spatial data. The catchment area is determined through a survey conducted among the retailers or workers of comparable properties. The output appears in the form of distribution of points that indicate the distance between respondent’s home and a particular shopping centre he/she is currently working. These points are used to mark the zonal boundary of the catchment area. The general step in determining the zonal area is shown in Figure
To assess the opportunity loss of employment, the actual potential workers in the catchment area should be identified. Although all people within the catchment area are considered potential workers, only those unemployed and those working in shopping centres within less than three years have the highest probability to switch to the Subject property (case study).
The conjoint analysis
The conjoint analysis was employed to analyze population’s purported occupational mobility between the Subject and comparable properties. By this method, each shopping centre was presented as a ‘product’ with a certain profile defined by its attributes. Respondents were then asked to arrange the alternative ‘products’ as a location of workplace according to their cardinal level of utility against each of them. The process of jointly evaluating, cardinally assigning utility, and choosing from a group of alternative products with certain defined attributes is called conjoint analysis. It is based on the assumption that complex decisions are made not based on a single factor or criterion but on several factors considered jointly, hence, the term conjoint (Marija et al., 2011). In principle, the conjoint method is a technique for dealing with situations in which a decision-maker has to choose among alternatives that simultaneously vary across two or more attributes (Hamid et al., 2012). Attributes are known as characteristics, factors, or qualities in property (Kinnard and Boyce, 1984; Lancaster, 1966). The basic mechanism of conjoint method are that respondents evaluate product profiles composed of multiple conjoined elements (attributes or features) and based on how respondents evaluate the combined elements (product concepts), the preference scores that they might have been assigned to individual components of the product can be deduced and would ultimately result in the overall evaluation of the product (Orme, 2006).The conjoint method involved a number of steps. First, attributes (or characteristics) of the alternative options (Subject and comparable properties) were identified. A catalogue of alternatives with its attributes was presented as ‘product profiles’. To assess the preferences, each respondent was asked to rank the product profiles into three categories; namely, ‘most preferred’, ‘least preferred’, and ‘indifferent’. Next, the respondent was asked to rank his/her preference over the entire product profiles whereby each choice was a product consisting of bundles of attributes at different levels. Number 1 rank represents the most preferred product profile, while the last rank represents the least preferred product profile. Lastly, the respondent was asked to assign a subjective probability (percentage chances) for choosing any particular product, whereby the highest assigned probability was considered to represent the most preferred and, thus, the most probable product to be chosen.
In order to alleviate the confusion in evaluating too many product profiles, only the six product profile are selected, so that the reader can get a better picture and easily understanding how conjoint analysis is applied in measuring the occupational mobility in this paper. A description of six product profiles with its attractiveness attributes is shown in Table
From the six product profiles shown in Table
Result and Findings
Case illustration
A brief statement of the case study is given here. This example gives some perspective of the ‘problem’ at hand; how a shopping centre development generates (or otherwise cause loss of) employment opportunity. The proposed development (hereinafter referred to as the Project) is a shopping centre development project at Jalan Tampoi, Johor. It is built on a 3 hectare of flat commercial land. The project was planned to be a three-storey building having a gross floor area of 420,000 sq. ft. It is a multi-purpose, one-stop shopping centre that will offer a range of consumer products.
Due to unforeseen circumstances, the developer has put the Project to a halt. To date, the Project has not been continued for 17 years. The development is expected to attract employment among the population within the catchment area which is 30 km radius. However, due to its abandonment, an uncertain amount of loss in economic well being, as well as employment opportunity has incurred. This loss of economic well-being is yet to be assessed. Results from the ground survey on comparable properties and information from the Local Authority regarding the Project details together with its proposed building plan provided the following data (Table
Sites attribute rating as per Hamid (2006) for this Project’s site is 85%. Based on a competitive analysis of business mix, the abandoned Project was ranked 4th on comparative attributes against the comparable properties within the 30-km catchment area. In the meantime, the results of the conjoint method are shown in Table
As can be seen, ‘product profile 4’ (shopping complex G) and ‘product profile 1’ (shopping complex N) were ranked highest and lowest, respectively. Shopping centre A and G were equivalently good in their situs characteristics and among the most probably selected by new employees. Although the abandoned Project has excellent situs attributes, it was ranked about in the middle with in terms of utility and its chances of capturing workers were 16%.
The eligible labour force within the geographic space that was estimated based on the report from the Department of Statistics Malaysia in the year 2016, was as follows:
Total population in Johor3,650,000
Labour force1,639,100
Employed 1,580,600
Unemployed59,000
Unemployment rate 3.6%
In the context of this paper, the catchment area is located in the area of Iskandar Malaysia (capital of Johor, and western Johor Bahru district, including Skudai), and its population based on demographic data at Malaysia Statistics Department is 1,853,600 (Tuti and Arum, 2017). The demographic statistics indicate that 66% of the population is in the working age group. The assumption of the unemployment rate of 3.6% was a national rate applied to the labour force in Johor. The summary of demographics statistics is as follows:
Total population in catchment area 1,853,600
Labour force (66%) 1,223,376
Employed 1,194,015
Unemployed 29,361
Unemployment rate 2.4%
However, a further enquiry at the Department of Labour Johor Bahru has disclosed that the unemployment rate in the catchment area is 2.4%; thus, the number of person unemployed could have been about 29,361 people. It can be said that the total of 29,361 unemployed people was considered as the potential workforce in this case.
However, the potential workers also could have also come from the number of people who are working less than three years in the existing comparable properties within the catchment area, because they might be interested to find another workplace which is giving them a higher satisfaction. From a survey, we found that at least 15% of the total number of workers in every comparable property who work less than three years would probably switch to another place, so this can be analyzed as follows:
The average employment density of each comparable property was 3,500 people; therefore, 15% of this average for five comparable properties would have been 2,625 people. So, in estimating the number of potential workers for the Project, the total number of unemployed people should be added to the total number of people who work less than three years, therefore, as many as 31,986 people within the catchment area could have been available for the Project. However, this figure was likely to have been distributed over the competing shopping centres within the area. Chances of the Project capturing workers based on the conjoint method were 16% (see Table
Based on the case study, the loss of economic well-being resulting from the abandoned Project is computed as follows:
With 215,700 sq. ft. of net lettable floor space (Table
31,986 potential workers x 16% (Chances of the proposed Project capturing workers based on conjoint analysis) = 5,118 people.
Therefore, as many as 5,118 persons within the catchment area could have lost employment opportunities due to the abandoned Project. As many as 3,141 of employment generated by the abandoned Project are all considered as employment opportunity loss incurred by the community. According to Salaries and Wages Survey Report, Malaysia (2016), the average per capita income for the Malaysian population was RM 1,700. Therefore, as much as RM 5,339,700 monthly per capita income has been lost to the Project’s abandonment. Since the project was abandoned for 17 years, and the loss incurred by the society was RM 1,089,298,800.
Conclusion
The assessment of opportunity loss of employment due to abandoned shopping centre development projects is an important exercise in order to estimate the loss incurred by the community. It can also be a revenue loss to the Local Authority. Even though it may not be felt directly by the community, the loss could be huge and can give a negative impact to the local economy. This is because the objective of a development of shopping centre is principally to bring about the positive impact to the community through the generation of employment and income. These two are significant indicators of economic well-being and they are critically needed through the construction of shopping centres.
Project abandonment is a distraction to a country’s economic development. Those affected are not just developers and contractors but also the community. There have been several studies on abandoned projects from different countries and recommendations have been proposed to overcome the problem. This is to secure the image of the construction industry, the country’s economy, and most importantly to avoid economic loss to the community, besides preventing loss of resources. Since most construction projects are complex, they require professional teams to plan and execute (Olapade and Anthony, 2012). Among others, the government needs to be satisfied with the planning, feasibility study, implementation, and monitoring of construction projects. Financial management for construction projects should be put in place by the developer concerned to reduce instances of project abandonment. Further, the provision of infrastructural facilities before, during and after the completion of the projects is very important to forestall abandonment.
There is also a need for project analysis to be required by the government. Hanachor (2012) cited that project analysis is the articulation of the various dimensions of a project life cycle, both separately and in relation to each other, thus, a multidimensional project analysis should cover social, institutional, financial, economic, and technical aspects. These aspects should be detailed out from the start of the development process.
This paper has demonstrated the method for assessing the opportunity loss of employment due to abandoned shopping centre development project and, it made a contribution to the body of knowledge in the assessment of economic well-being with respect to urban employment. Indirectly, it promotes awareness about the seriousness of project abandonment.
References
- Baker, Michael. (1999). A review of mall tenant space allocation, ICSC Research.
- Bell, S. (1999). Image and consumer attraction to intraurban retail areas: an environmental psychology approach. Journal of Retailing and Consumer Services, 6, 67-78. Retrieved from http://dx.doi.org/10.1016/S0969-6989(98)00015-0
- Bodkin, C. & Lord, J. (1997). Attraction of power shopping centres. The International Review of Retail, Distribution & Consumer Research, 7(2), 93-108. Retrieved from http://dx.doi.org/10.1080/095939697343058
- Borgers, A. W. J. & Vosters, C. (2010). Assessing preferences for a mega shopping centre in the Netherlands: A conjoint measurement approach. In Proceedings of the European Institute of Retailing and Services Studies conference (RASS), pp.21. EIRASS
- Charmaz, K. (2003). Gounded theory: Objectivist and constructivist methods. In N.K.D.Y.S. Lincoln (Ed), Strategies of qualitative inquiry (2nd ed., pp. 249-291). London: Sage.
- Charmaz, K. (2006). Constructing grounded theory: A practical guide through qualitative analysis. Thousand Oaks: Sage.
- Cho, J. Y. & Lee, E. (2014). Reducing confusion about grounded theory and qualitative content analysis: Similarities and differences. The Qualitative Report, 19 (32), 1-20. Retrieved from http://www.nova.edu/ssss/QR/QR19/cho64.pdf
- Clulow, V. and Reimers, V. (2009). How do customers define retail centre convenience?. Australasian Marketing Journal, vol. 17, no. 3, pp. 125-132. doi: http://dx.doi.org/10.1016/j.ausmj.2009.05.015
- Creswell, J.W., & Planno Clark, V.L. (2007). Designing and conducting mixed methods research. Thousand Oaks, CA: Sage Publications.
- Curtis, C. & Scheurer, J. (2007). Accessibility Measures: Overview and Practical Applications. Working Paper No.4, Department of Urban and Regional Planning, Curtin University. Retrieved from http://urbanet.curtin.edu.au/local/pdf/ARC_TOD_Working_Paper_4.pdf
- Dalziel, P. & Saunders, C. (2014). Wellbeing economics: A policy framework for New Zealand. Lincoln Uviversity. Retrieved from http://www.nzae.org.nz/wp-content/uploads/.../Dalziel_and_Saunders_Wellbeing_Paper.pdf
- Dancer, S. (2015). Employment density guide, 3rd edition. Homes & Communities Agency, London. Retrieved from https://www.gov.uk/government/publications/employment-densities-guide-3rd-edition
- Delic, M. & Knezevic, B. (2014). Development of shopping centres in central and southeastern Europe. DAAAM International Scientific Book 2014, Chapter 38, pp. 471-484. doi: 10.2507/daaam.scibook.2014.38
- Deloitte, D.J. Employment Densities Guide, 2nd Edition (2010). Homes & Communities Agency. Retrieved from http://planning.walsall.gov.uk/swift/MediaTemp/59488-17328.pdf
- Department of Statistics Malaysia. Population Distribution and Basic Demographic Characteristics 2010. Population and Housing Census of Malaysia 2010. Retrieved from http://www.statistics.gov.my/portal/download_Population/files/census2010/Taburan_Penduduk_dan_Ciri-ciri_Asas_Demografi.pdf
- Department of Statistik Malaysia, May, 2017. Salaries & Wages Survey Report, Malaysia, 2016. . Retrieved from https://www.dosm.gov.my/v1/index.php?r=column/pdfPrev&id...
- El-Adly, M. I. (2006). Shopping malls attractiveness: a segmentation approach. International Journal of Retail & Distribution Management, Vol. 35, No. 11, 2007, pp.936-950
- Evans, G. L. (2013). A novice researcher’s first walk through the maze of grounded theory: Rationalization for classical grounded theory. The Grounded Theory Review, Vol. 12, Issue 1
- Fernandez, W.D. (2004). Using the Glaserian approach in grounded studies of emerging business practices. Electronic Journal of Business Research Methods, Vol. 2 (2), pp. 83-94.
- Finn, A. & Louviere, J. J. (1996). Shopping centre image, consideration and choice: Anchor store contribution. Journal of Business Research, 35 (3), 241-251. Retrieved from http://dx.doi.org/10.1016/0148-2963(95)00129-8
- Fleming, S. (2014). Employment densities for property projects. Scottish Enterprise Economic Impact Guidance. Retrieved from http://www.evaluationsonline.org.uk/evaluations/Documents.do?action=download&id..
- Forstater, M. (2015). Working for a better world. Cataloging arguments for the right to employment. SAGE Journal, Vol. 41(1), pp. 61-67. Retrieved from http://doi.org/10.1177/0191453714553500
- Frasquet, M., Gil, I., & Molla, A. (2001). Shopping-centre selection modelling: a segmentation approach. International Review of Retail, Distribution and Consumer Research, 11(1), 23-38
- Glaser, B. G. (1978). Theoretical Sensitivity: Advances in the methodology of grounded theory. Sociology Press, Mill Valley, Calif.
- Glaser, B. G., & Strauss, A. L. (1967). The discovery of grounded theory: Strategies for qualitative research, Aldine Publishing Company, New York.
- Glaser, B. G. (2002). Constructivist Grounded Theory?. Forum Qualitative Sozialforschung/ Forum: Qualitative Social Research. ISSN 1438-5627. Retrieved from http://pdfs.semanticscholar.org/13a2/6af1d64f16daad744a0e6a100f7fd2f8d7a4.pdf
- Gonzalez-Hernandes, E. M. & Orozco-Gomez, M. A. (2012). Segmentation Study of Mexican Consumers Based on Shopping Centre Attractiveness. International Journal of Retail & Distribution Management, 40 (10), 759-777. Retrieved from http://dx.doi.org/10.1108/09590551211263173
- Gudonavicience, R. & Alijosiene, S. (2013). Influence of Shopping Centre Image Attributes on Customer Choices. Economics and Management: 2013, 18 (3). Retrieved from http://dx.doi.org/10.5755/j01.em.18.3.5132
- Guy C. (1998). Classifications of retail stores and shopping centres: methodological issues. GeoJournal, 45, 255-265.
- Hamid, A. M. I., Pieng F. Y., and Gan C., (2012). A conjoint analysis of buyers’ preferences for residential property. International Real Estate Review, Vol. 15, no. 1, pp. 73-105.
- Hamid, A. M.I., (2006). Basic Aspects of Property Market Research, First Edition 2006. Universiti Teknologi Malaysia, Skudai Johor, Malaysia.
- Hamid, A. M.I., (2007). Property Supply and Demand, First Edition 2007. Universiti Teknologi Malaysia, Skudai Johor, Malaysia.
- Hammerson, in partnership with Jones Lang LaSalle (2013). Demonstrating the true value of shopping centres. Report of Reshaping Retail. Hammerson Positive Places 2013. Retrieved from http://www.hammerson.com/media/news/4542/
- Hanachor, M. E. (2012). Community Development Project Abandonment in Nigeria: Causes and Effects. Journal of Education and Practice. Vol 3, No 6, 2012.
- Hariyono, Paulus, (2002). The impact of existence of shopping centre toward the trade and service activities around it (Thesis). Diponegoro University, Semarang.
- International Finance Corporation (IFC, 2008), World Bank Group. The Case for Shopping Centres an Engine of Development. Retrieved from http://www.ifc.org/wps/wcm/connect/1d20c300478ce2d3827d9286d3bfc329/Shopping%2BCenters.pdf?MOD=AJPERES
- Kamashki, (2015). 11 key factors when selecting the right location for your retail brand. July 11, 2015. Retrieved from https://www.linkedin.com/pulse/11-key-factors-when-selecting-right-location-your-retail-kameshki
- Kinnard, W. N. Jr., and Boyce, B. N. (1984). Appraising real property, Canada: The society of real estate appraisers.
- Lancaster, K. J. (1966). A new approach to consumer theory, Journal of Political Economy. Vol. 74, no. 2, pp. 132-157.
- Lillemor R-M. Hallberg (2006). The “core category” of grounded theory: Making constant comparison. International ournal of Qualitative Studies on Health and Well-being. 1:3, 141-148, Retrieved from https://www.tandfonline.com/doi/pdf/10.1080/17482620600858399
- Limtanakool, N., Dijst, M., and Schwanen, T. (2006). The influence of socioeconomic characteristics, land use and travel time considerations on mode choice for medium and longer-distance trips, J. Transp. Geogr., vol. 14, pp. 327-341. Retrieved from http://dx.doi.org/10.1016/j.jtrangeo.2005.06.004
- Marija, K., Biljana, P. & Milan, M. (2011). Identification of key positioning factors in the retail sector: A conjoint analysis approach. African Journal of Business Management. Vol. 5 (26), pp. 10376-10386. Retrieved from http://www.academicjournals.org/article/article1380371688_Kuzmanovic%20et%20al.pdf
- Martin, P. Y. & Turner, B. A. (1986). Grounded theory and organizational research. The Journal of Applied Behavioral Science, 22 (2), 141-157.
- Mas-Ruiz, F. J. (1999). Image of suburban shopping mall and two-stage versus uni-equational modelling of the retail trade attraction: an empirical application. European Journal of Marketing. 33 (5/6), 512-530. Retrieved from http://dx.doi.org/10.1108/03090569910262071
- Morse, J. (2001). Situating grounded theory within qualitative inquiry. In R. Schreiber & P. N. Stern (Eds.). Using grounded theory in nursing, pp.1-16. New York: Springer.
- Mouton, B. (2014). Creating a Tenant Mix and a Leasing Plan. ICSC. European Retail Property School. Retrieved from http://www.icsc.org/uploads/event_presentations/BasicsOfLeasingAndTenantMix_BeatriceMouton.pdf
- Mustel Group Market Research (2010). Strathcona county retail market analysis, final draft. Thomas Consultants.
- Niedomysl, T. & Hansen, H.K., (2010). What matters more for the decision to move: Jobs versus amenities. Environ. Plan. A 42(7), 1636-1649. Retrieved from http://journals.sagepub.com/doi/10.1068/a42432
- Nevin, J. R. & Houston, M.J. (1980). Image as a component of attraction on intra-urban shopping area. Journal of Retailing, 56, 77-93
- OECD (2011). OECD better life initiative, compendium of OECD well-being indicators. Organisation for economic co-operation and development. Retrieved from http://www.oecd.org/std/47917288.pdf
- OECD (2013). How’s life? 2013: measuring well-being. OECD Publishing. Retrieved from http://dx.doi.org/10.1787/9789264201392-en
- Olapade. O, & Anthony, O. (2012). Abandonment of Building Projects in Nigeria – A Review of Causes and Solutions. International Conference on Chemical, Civil and Environment engineering (ICCEE’2012) March 24-25 Dubai.
- Orme, B. (2006). Getting started with conjoint analysis: strategies for product design and pricing research, Madison, Wisconsin: Research Publishers LLC.
- Punch, K. F. (1998). Introduction to Social Research: Quantitative and qualitative approaches (1st ed.). London, Thousand Oaks California, New Delhi: SAGE Publications.
- Reikli, M. (2012). The key of success in shopping centers, composing elements of shopping centres and their strategic fit. Corvinus University of Budapest. Retrieved from http://phd.lib.uni-convinus.hu/742/6/Reikli_Melinda_den.pdf
- Singh, H. & Sahay, V. (2012). Determinants of shopping experience. Exploring the mall shoppers of capital region (NCR) of India. International Journal of Retail & Distribution Management, 40(3), 235-248. Retrieved from http://dx.doi.org/10.1108/09590551211207184
- Sit, J., Merriless, B. and Birch, D. (2003). “Entertainment seeking shopping centre patrons: the missing segments”. International Journal of Retail & Distribution Management, Vol.31, No.2, pp.80-94
- Strauss, A. & Corbin, J. (1994). Grounded theory methodology. In N. Denzin & Y. Lincoln (Eds.), Handbook of qualitative research, pp. 273-285. Thousand Oask, CA: Sage
- Suddaby, R. (2006). From the Editors: What grounded theory is not. The Academy of Management Journal, vol.49, No.4, pp. 633-642. Retrieved from http://www.jstor.org/stable/20159789
- Tegner, J. (2009). The good reasons for establishing IICG shopping centres.
- Terblanche, N.S. (1999). The perceived benefits derived from visits to a super regional shopping centre: an exploratory study. South African Journal of Business Management, 30, 141-146.
- Tesch, R. (1990). Qualitative Research: Analysis Types and Software. Retrieved from: https://books.google.com.my/books?isbn=1850006091
- The Importance of Shopping Centre to European Economy. A study commissioned by the European Shopping Centre Trust (ESCT) and the International Council of Shopping Centres (ICSC). March 2008. Retrieved from: http://sigs.icsc.org/srch/rsrch/wp/FINAL_Mar08_Complete%20WITH%20new%20cover%20and%20charts%20and%20tables.pdf
- Trochim, W.M.K. (2006). Research methods knowledge base. Retrieved from http://www.socialresearchmethod.net
- Tuti Purwaningsih & Arum Primandari (2017). A Spatial Analysis Approach for Johor’s Demographic Profile: Soft Warning of the Decline Birth Number Associated with Gender Gap in Johor. Int. J. Advance Soft Compu. Appl, Vol. 9, No. 2, July 2017.
- Wachs, M. and Kumagi, T.G. (1973). Physical accessibility as a social indicator. Soc.-Econ. Plan. Sci. 1973, 7, 437–456.
- Wong, G., Yu, L., and Yuan, L. (2001). “SCATTER: an instrument for measuring shopping centre attractiveness”. International Journal of Retail & Distribution Management, Vol.29, No.2, pp.76-86
- Yee, D. & Bradford, J. (1999). 1999 Employment Density Study. Technical Report. Growth Management Services Department Metro.
- Yilmaz, V. (2004). Consumer behaviour in shopping centre choice. Social Behaviour and Personality, 32(8), 783-790. ISSN: 0301-2212. Retrieved from http://dx.doi.org/10.2224/sbp.2004.32.8.783
Copyright information

This work is licensed under a Creative Commons Attribution-NonCommercial-NoDerivatives 4.0 International License.
About this article
Publication Date
01 May 2018
Article Doi
eBook ISBN
978-1-80296-039-6
Publisher
Future Academy
Volume
40
Print ISBN (optional)
-
Edition Number
1st Edition
Pages
1-1231
Subjects
Business, innovation, sustainability, environment, green business, environmental issues
Cite this article as:
Ngadimin, N. F., Iman, A. H. M., & Raji, F. (2018). Grounded Theory For Assessing Economic Well-Being Loss Of Abandoned Shopping Centre Project. In M. Imran Qureshi (Ed.), Technology & Society: A Multidisciplinary Pathway for Sustainable Development, vol 40. European Proceedings of Social and Behavioural Sciences (pp. 1142-1169). Future Academy. https://doi.org/10.15405/epsbs.2018.05.90