
Mapping Recreational Ecosystem Service At Sub-Districts Of Muar


Abstract
Cultural ecosystem services (CES) research are growing exponentially. Apparently, there is a need to consider spatial assessment for recreation provision service at the village scale, especially in southeast region of Asia. Mapping recreational CES is important in landscape planning and management, for identifying and designing recreation hotspots. The study areas were located at Muar district. The methodological design was divided into six steps. Firstly, the criteria were elicited based on recreational CES literature followed by determining its proxy-criteria. Next, constructing the ranking schemata, defining, and classifying each criterion into three ranks. Later, Geographic Information Systems ver. 10 (ArcGIS) was used to develop the criteria maps. Subsequently, questionnaires were distributed to experts to quantify the relative priorities of each criterion. Next, the relative priorities were rated using Analytic Hierarchy Process (AHP) through Expert Choice ver. 11.5 (EC). Lastly, each criterion map was combined through raster calculator function in ArcGIS to develop the CES recreational provision maps. The result suggested that the recreation provision of Bandar Maharani, Sungai Terap, and Ayer Hitam are considered mediocre due to abundant of low-level recreation provision. Nevertheless, the recreation provision of the urban area is slightly better than the suburb and rural areas mainly due to usability and accessibility. In conclusion, low and moderate recreation provision areas need to be functionally improved to promote ecotourism and leisure activities.
Keywords: Cultural ecosystem servicesrecreation provisionspatial analysisAnalytic Hierarchy ProcessGeographic Information Systems
Introduction
One of the benefits afforded by the ecosystems is recreation and ecotourism activities that co-generated through the interaction of humans and the environment (Casado-Arzuaga et al., 2013). Recreation and ecotourism can be defined as recreational pleasure people derived from the natural or cultivated landscapes in an area (MEA, 2005; Nahuelhual et al., 2013). Recreation and tourism is an important type of cultural ecosystem service (CES) that need to be mapped, as it is important in land use planning, designing recreation hotspots, and reallocation of resources for new recreation and ecotourism activities (Nahuelhual et al., 2013). Grêt-Regamey et al. (2014) have proposed a tiered approach to map the recreational CES. Each tier has its own criteria that needed to be considered, but it can basically group into four major aspects- land use, usability and accessibility, landscape aesthetic, and non-managerial parameters such as weather condition and land form. One should note that which criteria are selected to assess recreational CES, are strongly depended on the goal of the assessment and the situation of the site. Nevertheless, Crossman et al. (2013) suggest that the accessibility and land use/ land cover (LULC) are important indicators in assessing recreational CES. In fact, most of the recreational CES research, LULC is the most commonly used criterion to evaluate naturalness, diversity of vegetation and scenic beauty (see Bunruamkaew & Murayama, 2011; Casado-Arzuaga et al., 2013; de Vries, Lankhorst, & Buijs, 2007).
On the other hand, accessibility also may influence people to visit the site, hence affecting the opportunities for recreation. For instance, Koppen, Sang, and Tveit (2014) posit that internal physical accessibility (i.e. topography, vegetation structure and infrastructure) and external physical accessibilities (i.e. distance and proximity) and social- cultural accessibility (i.e. gender, age, mobility, and preference) are among the indicators influence recreation provision services. In addition, features (e.g., facilities and amenities), accessibility (travel distance), aesthetic (e.g., greenery, cleanliness, and smell), and safety (e.g., traffic, lighting, undesirable users, poor maintenance, and surveillance) are also important factors that influence the usability of the recreational area (McCormack et al., 2010).
Another factor that influences opportunities for recreation is landscape aesthetic. Some researchers (e.g. Burkhard et al., 2012; Nahuelhual et al., 2013) considered them as part of the recreational CES while other (Casado-Arzuaga et al., 2013) suggested assessing recreation provision services and aesthetic quality separately. In this paper, we considered aesthetic quality as part of recreation provision services. The reason is, when people interacting with nature, they receive pleasure by enjoying the scenic beauty (TEEB, 2010). In other words, the scenic beauty of landscape may affect the preference of a people to engage with it. For example, if people perceive the visual of the site is poorly maintained, ugly, and unhygienic, they will avoid going there. In addition, topography (elevation and slope) has also been suggested by Chhetri and Arrowsmith (2008) as one of the important factors in evaluating recreation potential.
Problem Statement
The number of studies on ecosystem services are growing rapidly in various regions. However, majority of the previous studies were focused on North America, South America, and Europe. While, little studies have been conducted in Asia, particularly in the southeast regions (see Seppelt et al., 2011, p. 631). This may contribute to the lack of awareness on the importance of ES toward human wellbeing in southeast Asia region. Today, one of the most commonly used tools to estimate ES is through mapping. Mapping of ES is important in land use planning, management, and decision-making (Malinga et al., 2015). It is also useful to stakeholder in decision-making process. In the studies of mapping of ES, regulating and provisioning services are the most commonly being studied and mapped, whereas cultural and supporting services are still lack of attention (Crossman et al., 2013). In addition, many recreational CES studies are focused on municipality scale in which much smaller scale such as village or farm scale is seldom being explored (see Malinga et al., 2015, p. 61). This is also being highlighted by Yeo et al. (2017) in the mapping of LULC, small-sized resources such as small green space, playground, and square are relatively difficult to show and to illustrate in large mapping scale.
Research Questions
The research question was formulated based on the assumption that urban area provided the lowest recreational provision opportunity as compared to suburb and rural areas since urban area has limited spaces. The research questions are: (i) what factors determine the recreation provision opportunity in urban, suburb and rural areas? (ii) Is urban area afforded the lowest recreational provision opportunity as compared to suburb and rural areas?
Purpose of the Study
The purpose of the study was to explore and map the recreational CES in a small town at spatially explicit scale and compare their differences in urban, suburb and rural areas.
Research Methods
Study areas
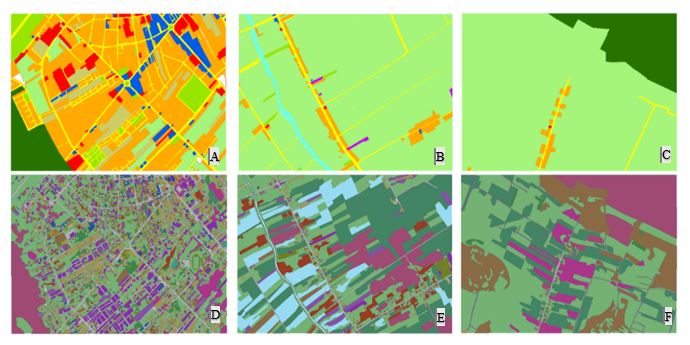
Muar is selected as the study area because it is one of the districts that has many natural and agricultural resources (Yeo et al., 2016). Muar district is located at Johor states, Malaysia. It is also known as a royal capital, and furniture hub (JPBD, 2010; MPM, 2013). The LULC spatial data were acquired from Department of Agriculture Muar (2010). Muar has 12 sub-districts, the LULC for each sub-district is also vary. For comparison purpose, we have selected three sub-districts areas from highly urbanized area (Bandar Maharani), moderately urbanized suburb area (Sungai Terap), and less urbanized rural area (Ayer Hitam) to evaluate the recreation provision services. The size of the village scale in plots was 2.7km x 1.8km. These areas were selected based on their different types of LULC. Most importantly, there is a lack of studies looking on village/ farm scale (Malinga et al., 2015) in fine spatial resolution. Since the study areas were not covered the whole districts of Muar, we managed to update the database based on real site data and aerial image derived from Google Earth (refer Yeo et al., 2017, p. 291). It took approximately three months to completely update the new LULC maps (see Figure
Methods
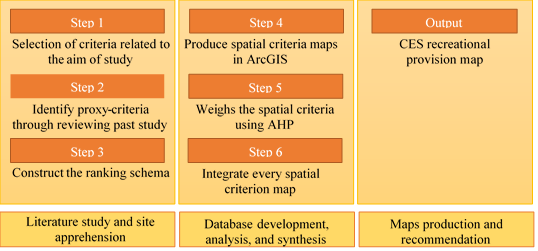
Multi-criteria decision making (MCDM) processes incorporating with the ArcGIS capabilities is one of the conciliating techniques used in spatial planning to support spatial decision-making (Lawal, Matori, & Balogun, 2011). One of the capabilities of GIS-based MCDM is, it displays complex multiple criteria in visual pattern. These criteria maps can be used to coalesce with each other to communicate a spatially complex decision process based on decision maker’s preference. One should note that the results of the MCDM are strongly influenced by the relative priorities of each criterion (Chen, Yu, & Khan, 2010). Hence, it is important to determine the weight of each criterion based on a ranking schema when exercising a suitability analyses. According to Bunruamkaew and Murayama (2011), deriving and rating the relative weights of the criteria in decision-making process are always difficult. Nevertheless, it can be solved with Analytical Hierarchy Process (AHP) for obtaining the criteria weights in MCDM (Chen et al., 2010). The methodological framework showed in Figure
Selection of criteria
The selection of criteria is mostly elicited from peer-review papers of recreational CES (Bunruamkaew & Murayama, 2011; Casado-Arzuaga et al., 2013; Crossman et al., 2013; Grêt-Regamey et al., 2014; Nahuelhual et al., 2013). Whereas, the proxy-criteria were selected based on their relevancy to the study areas. For example, the study areas did not have cycling path and trail, consequently, those parameters were ruled out. Other than that, we were examined on recreation and natured based recreational provision rather than spiritual or heritage value. Hence, criteria related to heritage is not considered. Eventually, the proxy-criteria we used to map the recreation provision map were naturalness, distance from the home, distance from the road, usability, scenic beauty, and relief (see Table
Naturalness is defined as a gradual indication of degree of disturbance by man (Frank et al., 2013). For example, the naturalness is considered high when the forests are well preserved. Whereas, if the forests were partially or fully converted to agricultural land or built-up areas, then the naturalness would fall. We referred and adapted the tourism used aptitude (Nahuelhual et al., 2013, p. 80) and CES delivered by different landscape features (Norton et al., 2012, p. 452) to classify and rank different types of LULC. The LULC of the selected study areas included built-up areas, agricultural plantation, grassland, bushes, forest (mangrove and reserved), and river. Hence, only these factors were employed to evaluate naturalness. Based on the literature review, we suggest that the higher the naturalness of an area, it provides more recreational opportunities. To develop the naturalness criterion map, we have reclassified the LULC data in ArcGIS into high (forest, river, and mountain), moderate (agricultural plantation, grassland, and bushes), and low (housing and industry areas, street, and built-up elements) categories.
Besides looking on the LULC aspects, this study also considered the accessibility, both physical (distance) and social- cultural (age). For instance, walking distance is recommended should not more than 300m from home (Barbosa et al., 2007). Similarly, (Koppen et al., 2014) also suggest that children and elderly can walk to a maximum of 400 m, while 250 m to 300 m walking distance to recreational areas and green spaces is salutary. If the walking distance is more than 500 m away from the residential areas, the numbers of the visit will decline by half. By adapting what the literature suggested, we proposed 0- 100m is the optimum walking distance to the nearest green space either from home, road, or car park areas in order to encourage people to go to the recreational areas. In addition, 100-200 m walking distance is considered acceptable, whereas 200-300 m and beyond are discouraging people visiting the green spaces. To develop the distance from the home criterion map, we extracted the residential area’s layer from LULC database and performed the Euclidean distance analysis with output distance set to 100 m, and then reclassified to the following range: low (>200 m), moderate (100-200 m), and high (<100 m). Same analysis technique was applied to the distance from the road’s criterion map, but the input data was road layer.
McCormack et al. (2010) suggest the usability of the park is positively or negatively influenced by several attributes (e.g. facilities, cleanliness, condition, and maintenance), and it will affect the frequency of visiting the site. In addition, Kaczynski and Henderson (2007) also suggest that facilities (i.e. leisure services and recreation settings) can encourage people to become physically active, thereby using the recreational space more frequently. To assess the quality of green and recreational spaces, we adapted parameters of the use of park suggested by McCormack et al. (2010) as a benchmark. The requirements to classify whether it is good or poor quality can refer Table
Scenic beauty is one of the criteria being used in measuring recreational CES (Nahuelhual et al., 2013). There are several criteria used to determine scenic beauty. For example, Chhetri and Arrowsmith (2008) suggested elevation, relative relief, vegetation variety, proximity to water and slope diversity are the predictors for scenic attraction. Similarly, Dramstad et al. (2006) also suggested that the present of water, vegetation and topography are strong predictors for aesthetic preference. To evaluate the scenic beauty, we have captured 30 photos randomly at urban, suburb and rural area, respectively. The selection of the spots was located near the streets or roads because people respond to the visual environment are highly depended on what they can see all around them (Bishop & Hulse, 1994). The scale of the measurement was also 3 points Likert scale. Based on the evaluation by the experts, four pictures have shown considerably high standard variation which means the responses were varied. In this case, mean values are not a suitable measurement for central tendency due to ordinal scale data and skewed distribution (Manikandan, 2011). One of the reason might be the evaluation of scenic beauty is rather subjective and lack of standardization (Dramstad et al., 2006). Hence, median values were used to classify the scenery of the spot (good, moderate, or poor) among 19 experts to produce the scenic beauty criterion map.
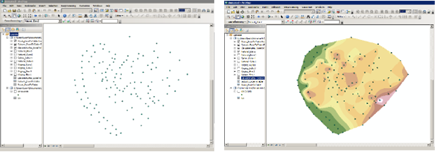
Topography is defined as the “study and mapping of land surfaces, including relief and the position of natural and constructed features” (ESRI, n.d). Topography is one of the important factors in evaluating the attractiveness of landscape, scenic and recreation potential (Chhetri & Arrowsmith, 2008). In addition, topography (elevation and slope) has also been used as one of the criteria in suitability analysis of ecotourism (see Bunruamkaew & Murayama, 2011). We adopted the interpretation from the literature to fit into the context of this study. Therefore, it is assumed that the higher the relative relief the higher the recreational opportunities. We have derived the spot elevation data from Google Earth, and reprocessed in ArcGIS to produce the DEM map due to data unavailable. Besides, Google Earth also provides commendable accuracy data as compare to ASTER and SRTM elevation dataset (Rusli, Majid, & Din, 2014). There are several interpolation options including IDW, Kriging, Natural Neighbor and Spline (see Childs, 2004, p. 34) that can be used to develop the DEM map in ArcGIS. In this paper, we selected the natural neighbor analyst to develop the DEM map due to the scattered points derived from Google Earth (Figure
Analytic Hierarchy Process (AHP)
AHP is a general theory of measurement to quantify relative priorities. It is used to derive ratio scales from both discrete and continuous paired comparisons (Saaty, 1987, p. 161). It is widely employed in multicriteria decision-making, planning, and resource allocation and in conflict resolution (Saaty, 1987; Saaty and Alexander, 1989). In this paper, we have strictly followed the AHP procedures described in the previous studies (Al-Harbi, 2001; Saaty, 2008) to quantify the relative priorities.
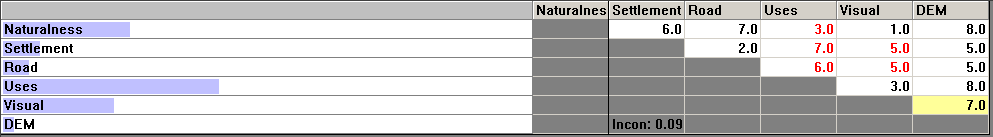
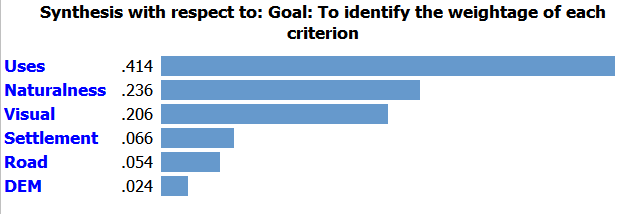
Firstly, we need to set the goal to identify the relative priorities of each criterion that were used in mapping recreational CES. Next, we structured the decision hierarchy into two levels only, since we did not propose alternative choices. Thirdly, we developed a pairwise comparison matrices (Figure
Integrating AHP with ArcGIS
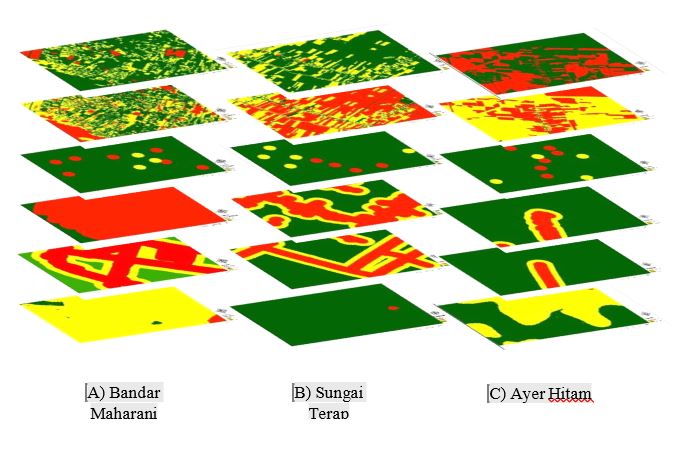
Integrating AHP in GIS modelling is still considered relatively new (Ishizaka & Labib, 2009). In this section, we discussed how the AHP can be used together with ArcGIS. Each of the criterion map generated from the ArcGIS was as shown in Figure
Findings
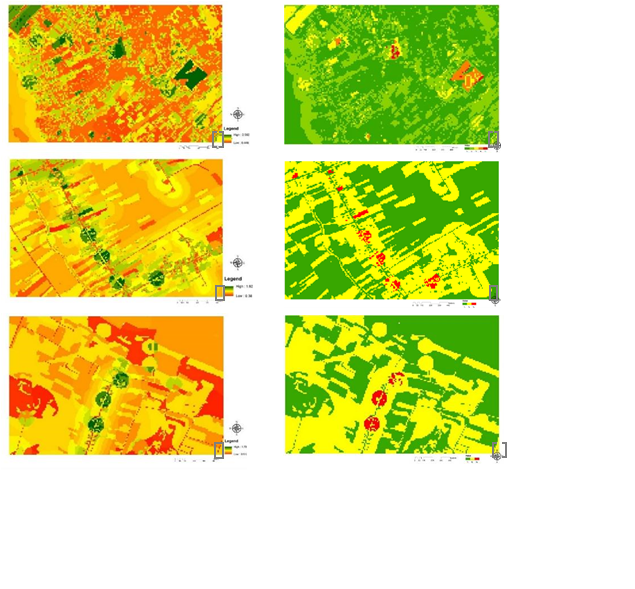
At Bandar Maharani (Figure
For urban area, ranks 1 and 2 areas included wild grass-covered areas, fragmented lowland forest and abandoned agricultural lands. In term of the naturalness of the landscape, these areas were considered acceptable for passive recreational activities such as sightseeing for birds. However, the usability of the space was relatively poor, particularly lack of facilities and poor maintenance were the most dominant factors that contributed to low usability. On the other hand, ranks 4 and 5 areas were classified as high recreation provision mainly due to the maintenance of the landscape was good, and the place was clean and attractive. Besides, these areas also provided with numerous facilities, for example, running track, football field, and car park areas. In fact, we could see quite numbers of people were playing football and jogging along the road during our field visit. The finding is evidently parallel with Kaczynski and Henderson (2007) in which facilities (i.e. leisure services, parks, and recreation settings) can encourage people to become physically more active. The rank 3 areas were mostly grass- covered areas that provided moderately recreation provision. These areas mostly were opened lawn, the usability at these areas were also limited. However, the maintenance was still considered acceptable since the grasses were well trimmed, clean, and attractive. Thus, it still allowing for activities such as playing soccer, kite, and any other recreation related activities that suitable at opened lawn. This finding is slightly contradicting with Norton et al. (2012) suggestion in which grassland provided low recreational activities. In this case, we suggest that a proper and well-maintained grass covered areas indeed can support physical activities as compared to wild grassland with excessive growth of cogon and fescue grasses.
For suburb area, the classification of ranks 1 and 2 areas mostly were agricultural lands. These agricultural lands include durian, rubber and oil palm estates and orchards with a mixed planting of edible plants. Apparently, these areas had no facilities for recreational uses and the accessibility was disconnected. Since these areas were designated for cropping purposes, it was comprehendible the usability was low. In addition, poor accessibility also contributing to the difficulty of the people to reach and visit these areas. Generally, these findings are closely associated with Nahuelhual et al. (2013) positions in term of tourism use aptitude in which agricultural land provided very limited (low) recreational activities. In term of naturalness, river has the potential to provide various recreational and leisure activities including trekking, climbing, kayaking, and bird watching (Nahuelhual et al., 2013; Norton et al., 2012). Surprisingly, the results shown in Figure
Ayer Hitam as the rural area has many barren lands, agricultural plantation and reserved forest that classified as rank 1 (48%). The highest percentage was rank 2 (50.7%), and it was grass- covered area. These areas were being classified as ranks 1 and 2 due to the lack of facilities, poor maintenance of the spaces, and poor accessibility, despite the naturalness of the place was considerably high. For example, forested areas could provide various recreational activities such as jungle trekking and rock climbing. Nonetheless, without proper facilities provided, for example, trekking path and signage. It is difficult for people to safely explore it. In this perspective, we disagree with Norton et al. (2012) that woodland or trees covered area provided high leisure activities if the usability is poor. On the other hand, we agree with Kaczynski and Henderson (2007) that facilities play an important role in determining the recreation provision opportunity. Figure
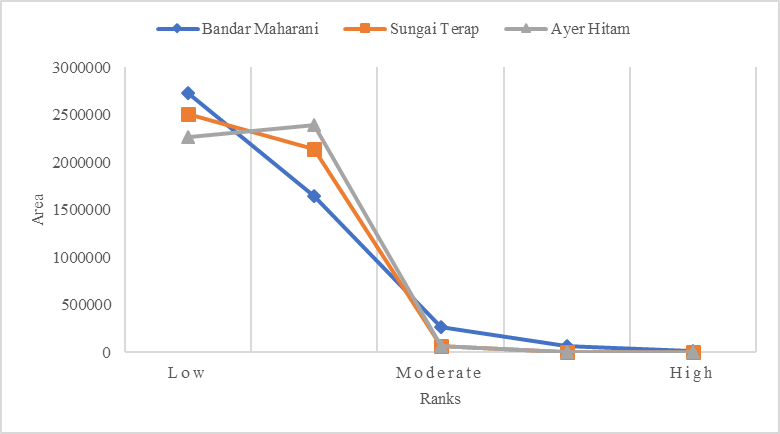
In sum, the recreation provision of the urban area is slightly better than the suburb and rural areas mainly due to usability of the space and accessibility to the site. However, this does not mean suburb and rural areas should be neglected. In fact, with a proper planning and designing of these areas, improving the facilities and infrastructures, there can provide various recreational activities. For instance, transforming the existing green spaces into playground, park, square or plaza, and converting the existing agricultural land to integrated farming for agrotourism. Considering the condition of the agricultural lands and green spaces, management and maintenance of these resources also need to be regulated by a proper guideline or policy to make sure that these resources are safeguarded and not in deserted condition.
Conclusion
This paper presents an innovative way of combining AHP with ArcGIS to produce the CES recreation provision maps to support decision-making and land use planning. With this integrated mapping approach, it was possible to differentiate which areas delivered the highest recreational CES and which areas delivered the lowest. This approach is considered relatively new, and seldom being used in the mapping of CES. In fact, we can distinguish the priorities of each criterion with the used of AHP, which is crucial in determining the recreation provision. However, the shortcomings inherent in this approach is the subjectivity of assigning preference values. In this study, we only based on the opinions from 19 practitioners. To improve the credibility of the findings, future research can consider from the perspectives of public users and government sectors as well.
In the study of mapping recreational CES, the municipal or local scale is the most commonly mapped. In this study, we have demonstrated that mapping in a spatial explicit village scale is important to present the result in a fine resolution, which is useful in landscape planning, management, and decision-making. Besides, comparing three different sites also providing us the reasoning insight to show the difference between urban and rural landscapes that influence the recreation provision. In this paper, the results demonstrated that indeed urban area provides more recreational opportunities as compared to suburb and rural areas. Of course, we cannot generalize that it is the same across all the other region due to different types of landscape pattern and condition. Hence, it is recommended that future research should seek to explore other places as well, particularly in developing countries within southeast Asia region.
Acknowledgments
We would like to thank the Ministry of Higher Education Malaysia for providing financial support in this research project under Fundamental Research Grant Scheme (R.J130000.7810.4F748)
References
- Al-Harbi, K M A S. (2001). Application of the AHP in project management.. International Journal of Project Management,, 40(1)
- Barbosa, O.Tratalos, J A.Armsworth, P R.Davies, R G.Fuller, R A.Johnson, P.Gaston, K J. (2007). Who benefits from access to green space? A case study from, 40, 187-195
- Bishop, I D.Hulse, D W. (1994). Prediction of scenic beauty using mapped data and geographic information systems.. Landscape and Urban Planning,, 40, 59-70
- Bunruamkaew, K.Murayama, Y. (2011). Site Suitability Evaluation for Ecotourism Using. GIS & AHP: A Case Study of Surat Thani Province, Thailand. Procedia - Social and Behavioral Sciences,, 40, 269-278
- Burkhard, B.Kroll, F.Nedkov, S.Müller, F. (2012). Mapping ecosystem service supply, demand and budgets.. Ecological Indicators,, 40, 17-29
- Casado-Arzuaga, I.Onaindia, M.Madariaga, I.Verburg, P H. (2013). Mapping recreation and aesthetic value of ecosystems in the Bilbao Metropolitan Greenbelt (northern Spain) to support landscape planning. Landscape Ecology., 10-1007
- Chen, Y.Yu, J.Khan, S. (2010). Spatial sensitivity analysis of multi-criteria weights in GIS-based land suitability evaluation.. Environmental Modelling & Software,, 40(12), 1582-1591
- Chhetri, P.Arrowsmith, C. (2008). GIS-based Modelling of Recreational Potential of Nature-Based Tourist Destinations. Tourism Geographies,, 40(2), 233-257
- Childs, C. (2004). Interpolating Surfaces in. ArcGIS Spatial Analyst. ArcUser, July-September,, 32-35
- Crossman, N D.Burkhard, B.Nedkov, S.Willemen, L.Petz, K.Palomo, I. (2013). A blueprint for mapping and modelling ecosystem services.. Ecosystem Services journal,, 40, 4-14
- Vries, S de.Lankhorst, J R-K.Buijs, A E. (2007). Mapping the attractiveness of the Dutch countryside: a GIS-based landscape appreciation model. Forest Snow and Landscape Research,, 40(1), 43-58
- (2010). Land use of Muar and Ledang districts [GIS Spatial Data]. Pejabat Pertanian Daerah Muar.
- Dramstad, W E.Tveit, M S.Fjellstad, W J.Fry, G L A. (2006). Relationships between visual landscape preferences and map-based indicators of landscape structure.. Landscape and Urban Planning,, 40(4), 465-474
- Frank, S.Fürst, C.Koschke, L.Witt, A.Makeschin, F. (2013). Assessment of landscape aesthetics - Validation of a landscape metrics-based assessment by visual estimation of the scenic beauty.. Ecological Indicators,, 40, 222-231
- Grêt-Regamey, A.Weibel, B.Kienast, F.Rabe, S E. (2014). A tiered approach for mapping ecosystem services. Landscape and Urban Planning,, 40, 16-27
- Ishizaka, A.Labib, A. (2009). Analytic Hierarchy Process and Expert Choice: Benefits and limitations.. OR Insight,, 40(4), 201-220
- JPBD, Federal. (2010). Department of Town and Country Planning. Ministry of Housing and Local Government., 40
- Kaczynski, A T.Henderson, K A. (2007). Environmental Correlates of Physical Activity: A Review of Evidence about Parks and Recreation.. Leisure Sciences,, 40(4), 315-354
- Koppen, G.Sang, Å O.Tveit, M S. (2014). Managing the potential for outdoor recreation: Adequate mapping and measuring of accessibility to urban recreational landscapes.. Urban Forestry & Urban Greening,, 40(1), 71-83
- Lawal, D U.Matori, A N.Balogun, A L. (2011). A Geographic Information System and Multi-Criteria Decision Analysis in Proposing New Recreational Park Sites in Universiti Teknologi Malaysia.. Modern Applied Science,, 40(3), 39-55
- Malinga, R.Gordon, L J.Jewitt, G.Lindborg, R. (2015). Mapping ecosystem services across scales and continents- A review.. Ecosystem Services,, 40, 57-63
- Manikandan, S. (2011). Measures of central tendency: Median and mode.. Journal of Pharmacology & Pharmacotherapeutics,, 40(3), 214-215
- McCormack, G R.Rock, M.Toohey, A M.Hignell, D. (2010). Characteristics of urban parks associated with park use and physical activity: A review of qualitative research.. Health & Place,, 40(4), 712-726
- MEA, Millennium. (2005). Ecosystem Assessment.
- MPM, Majlis. (2013). Perbandaran Muar
- Nahuelhual, L.Carmona, A.Lozada, P.Jaramillo, A.Aguayo, M. (2013). Mapping recreation and ecotourism as a cultural ecosystem service: An application at the local level in Southern Chile.. Applied Geography,, 40, 71-82
- Norton, L R.Inwood, H.Crowe, A.Baker, A. (2012). Trialling a method to quantify the ‘cultural services’ of the English landscape using Countryside Survey data. Land Use Policy,, 40(2), 449-455
- Rusli, N.Majid, M R.Din, A H M. (2014). Google Earth’s derived digital elevation model: A comparative assessment. with Aster and SRTM data. IOP Conference Series: Earth and Environmental Science,, 40(2014)
- Saaty, R W. (1987). The analytic hierarchy process-what it is and how it is used.. Mathematical Modelling,, 40(3), 161-176
- Saaty, T L. (2008). Decision making with the analytic hierarchy process.. International Journal of Services Sciences,, 40(1), 83-98
- Saaty, T L.Alexander, J. (1989). Conflict Resolution: The Analytic Hierarchy Process.
- Seppelt, R.Dormann, C F.Eppink, F V.Lautenbach, S.Schmidt, S. (2011). A quantitative review of ecosystem service studies: approaches, shortcomings and the road ahead.. Journal of Applied Ecology,, 40(3), 630-636
- TEEB, . (2010). The economics of ecosystems and biodiversity: ecological and economic foundations. Earthscan, London and Washington.
- Yeo, L B.Said, I.Saito, K.Fauzi, A M. (2017). Mapping land use/ cover changes and urbanization at sub-districts of Muar,. Malaysia. Chemical Engineering Transactions,, 40, 289-294
- Yeo, L B.Said, I.Saito, K.Gabriel, L. (2016). Conceptual Framework of Ecosystem Services in Landscape Planning, Malaysia. International Journal of Built Environment and Sustainability (IJBES),, 40(3), 142-149
Copyright information

This work is licensed under a Creative Commons Attribution-NonCommercial-NoDerivatives 4.0 International License.
About this article
Publication Date
01 May 2018
Article Doi
eBook ISBN
978-1-80296-039-6
Publisher
Future Academy
Volume
40
Print ISBN (optional)
-
Edition Number
1st Edition
Pages
1-1231
Subjects
Business, innovation, sustainability, environment, green business, environmental issues
Cite this article as:
Yeo, L. B., & Said, I. (2018). Mapping Recreational Ecosystem Service At Sub-Districts Of Muar. In M. Imran Qureshi (Ed.), Technology & Society: A Multidisciplinary Pathway for Sustainable Development, vol 40. European Proceedings of Social and Behavioural Sciences (pp. 843-857). Future Academy. https://doi.org/10.15405/epsbs.2018.05.69