
Relationship Dimension In University Laboratories And Its Effects On Students’ Interest


Abstract
Malaysian universities are currently facing a decline of students’ interest in science. It is perceived that the students’ practices in laboratory activities with properly managed activities could result in positive interest in science. In that sense, it is argued that laboratory activities are less constrained, creating excellent opportunities for the interaction between instructor and students to occur. Hence, this study was aimed to examine the relationship dimension in university laboratories and its’ connection towards the students’ interest in a science subject. Drawing upon a survey conducted over 321 science students in four Malaysian Universities, a series of exploratory factorial, descriptive and regression analyses were applied in this study context. The results proved that in the aspects of instructor supportiveness, student cohesiveness and involvement explained 56.15% of the variations and exhibited a positive relationship with the students’ interest in science. Subsequent analysis also found that both instructor supportiveness and student cohesiveness demonstrated significant contributions of 17.2%. The relationship dimension definitely showed significant contribution although in small percentages. As the laboratory objectives are ultimately important to achieve, future research should examine the best practices in laboratory to develop students’ interest in science.
Keywords:
Introduction
Globally, the continuous development of science, technology, engineering and mathematics (STEM) for undergraduate students have been a concern in national agenda (National Academies of Sciences, Engineering, & Medicine, 2016). Various issues and recommendations have been discussed among the academicians. In Malaysia, students found science subject is not a favourite subject and presumably hard to understand when compared to social science subject (Samsudin et al., 2012). This phenomenon is not something hard to observe as the same trend keeps on happening every year, from primary schools to undergraduate and postgraduate universities students. To date, government’s target ratio of 60:40 for science to art students has not been achieved by Malaysian students (Samsudin et al., 2012). On the contrary, the number of science students keeps decreasing every year and it was reported that the current mass ratio is 40:60, that is only 40% of students are currently enrolled in science courses (Academy of Sciences Malaysia, 2015). Consequently, this scenario will defect the objective to achieve adequate numbers of human resource in science and technology field.
In universities, students are primarily taught about science through two ways of communications, in which through lecture courses and laboratories. According to Samsudin et al. (2012), there is a significant relationship between the teaching and learning environment outside the classroom to cultivate interest in science among the students. In this study, the context of learning outside classroom refers to the laboratory based learning (LBL) methodology. Hence, the sensorimotor experience in the laboratory is expected to help achieving science education goals such as students’ interest and motivation in science (Abrahams, 2009; Chiu, Lin, & Tsai, 2016). This is due to the fact that the laboratory setting itself could encourage students working cooperatively in a small group under a cooperative mode of instruction and learning. The less formal environment creates excellent opportunities between students-instructors and students-students to promote positive constructive relationship and subsequently learning environment. This cooperative social learning represents how the students work to acquire inquiry skills as a scientist (Hofstein, Nahum, & Shore, 2001). Thus, it is important to examine the instructor and students’ practices in a laboratory. Determining laboratory outcome from the aspects of laboratory psychosocial is not relatively new. To date, a lot of studies have been done over the years assessing the aspects of teaching and learning of laboratory-based science in Malaysia (Ahmad, Osman, & Halim, 2010; Fraser, 1998; Hofstein, 2004; Samsudin et al., 2012).
Since student centered paradigm is definitely a substantial component in laboratory activities, many studies have adopted five scales of Science Laboratory Environment Inventory (SLEI) to measure the psychosocial aspects of students’ perception and attitudes in science (Ahmad et al., 2010; McRobbie & Fraser, 1993). The five scales in SLEI were introduced by an Australian researcher, Barry J. Fraser such as open-endedness, student cohesiveness, integration, rule clarity and material environment (Fraser, 1998). However, a role of instructor should not be neglected easily since laboratory activities are less constrained, creating excellent opportunities for the interaction between instructor and students. The original version of SLEI was also initiated and validated by Fraser together with McRobbie and Giddings to inspect into three other dimension scales, including teacher supportiveness, involvement and organization into eight scales of SLEI (Fraser, Giddings, & McRobbie, 1995; Giddings & Fraser, 1989; Hofstein, 2004; Hofstein et al., 2001). Adjacent to the SLEI scales, the role of instructor in this context illustrates the role of teacher to measure the teaching and learning environment in the laboratory.
Thus, this study is focusing on the relationship dimension based on Moos category after it was introduced by Moos (1974) that includes instructor-supportiveness, student cohesiveness and involvement from the original version of SLEI (Kijkosol, 2005; Moos, 1974). The relationship dimension expresses on the degree of the people involved in the laboratory, the degree they support each other and the degree they assess openly (Ebrahimi, 2015; Kijkosol, 2005). The descriptive information for the relationship dimensions in the Science Laboratory Environment Inventory (SLEI) is demonstrated in Table
Problem Statement
Chiu et al. (2016) claimed that interaction with instructors and peers could be the factors affecting students’ perceptions of learning in the laboratory. Further, it is perceived that active participation through the cooperative teamwork in laboratory activities could inculcate positive social relationship, student attitudes and cognitive skills (Hofstein et al., 2001). However, students’ activities in the laboratory through constructive social interaction is not always practicing the best approach.
Somehow, ambiguous experiment objectives and insufficient simulation from instructors could give negative reaction from students, as they could not understand what they learned in the laboratory (Johnstone & Letton, 1990). In addition, students are merely guided with cookbook nature of laboratory tasks (Chiu et al., 2016), making less cooperative learning with instructors in the laboratory. Moreover, the cookbook laboratory tasks practice rote learning and repetitive experiments. As a result, students will be bored once they find the repetitive experimental results are similar as predicted by the instructors (Chiu et al., 2016; Reiner & Gilbert, 2004). If students think that the activities are boring, then the objectives of laboratory based learning (LBL) to develop students’ interest in science would be a failure.
While in term of peers, it is found that some students might only become a ‘passenger’ without doing anything or just become an observer in some experiments (Ahmad et al., 2010). Consequently, some undergraduate students might think that individual experiments would be more effective than the passive group they have. The passive interaction could occur due to the lack of interest in the activities
being held (Ahmad et al., 2010; Taridi, 2007). Therefore, this study attempts to investigate on how the relationship dimension occurs via the inquiry learning in the student-centered learning process.
Research Questions
The research questions lie on an assumption that laboratory activities are less constrained, leading towards excellent opportunities for the interaction in the laboratory to occur. Based on the definition of relationship dimension, it comprised of the elements of teacher-supportiveness, student cohesiveness and involvement. Hence, the there are few questions need to be taken into consideration such as the following:
How the relationship dimension occurs in the laboratory?
What is the relationship between the elements in relationship dimension towards students’ interest in science?
Purpose of the Study
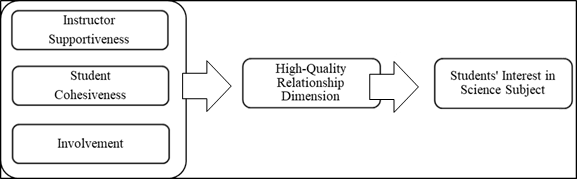
In the past, some studies have examined the perceptions of teaching and learning environment in laboratory towards the students’ satisfaction, interest and achievement (Ahmad et al., 2010; Beck & Blumer, 2016; Chiu et al., 2016; Samsudin et al., 2012). However, there is still no study looking into the relationship dimension and degree to predict the students’ outcomes in certain extent. In this study, the relationship dimension occurs among instructor-students was discussed by referring to the definition in the SLEI (McRobbie & Fraser, 1993) and to the autonomy-supportive teachers’ framework that was developed by Reeve (2006). The research conceptual framework is illustrated in Figure
Research Methods
Data Collection
This study employed a quantitative paradigm to investigate the pattern of relationship dimensions and its connection with the students’ interest in science. 22-Likert scale questions including an open-ended question were developed to investigate the relationship between these three independent variables and a dependent variable. The survey used 5-Likert points as it could improve reliability and validity of the items used (Dawes, 2012). Before collecting data, a pilot study was conducted to test the suitability and sensitivity of the instruments. 30 undergraduate science students were chosen to fill out the survey. Value of Cronbach’s alpha obtained for all constructs of the survey was valid and greater than 0.7 (α = 0.827). Then, the survey was distributed online and on paper to 330 students in 4 Malaysian universities. Since some data was out-ranged to the analysis validity, only 321 responses were used in the analysis.
This sample size was more than enough by calculating through the sample size formula, N>50+8(3), where ‘N’ is the sample size and ‘3’ is the number of independent variables measured (Tabachnick, Fidell, & Osterlind, 2001). The participants were selected by using purposive random sampling method, focusing on the students who are majoring in science-based departments (e.g. physics, biology, chemistry, medicine) and currently doing experiments in laboratory-based science. Regardless of that, the participants were from different demographic areas in Malaysia with various educational backgrounds. At this extent, they could represent many Malaysian students to measure the variables needed. From the survey, 43.3% were male and 56.1% were female with another 0.6% did not respond to this demographic question. Table
Data Analysis
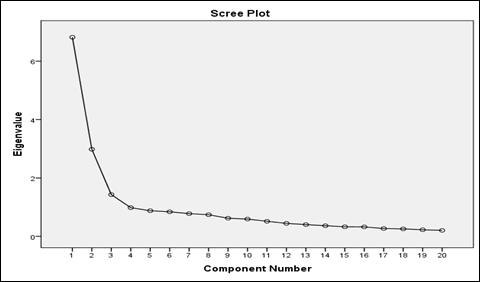
In order to ensure that all 20 items in the independent variables that were inter-related with each other being placed in the correct constructs, an exploratory factorial analysis was used with principal component extraction and varimax rotation. The analysis was executed twice. First was to prove the underlying three factors (i.e constructs), in which satisfy the condition of eigenvalues greater than 1 and the number of coordinates before curve is flattening out (see scree plot in Figure
For the descriptive analysis, mean and standard deviation for each factor was calculated and interpreted into five levels (i.e very low, low, moderate, high and very high) after the 5-Likert scales were divided into 5 ranges proportionally. To get the broader interpretation, frequency and percentage for scores of each factor were then divided into three categories. This was done by dividing 5-Likert scales equally into three categories (i.e low, moderate and high). According to the central limit theorem, the large number of independent samples would give approximately normal (Ruxton, Wilkinson & Neuhäuser, 2015). Hence, to find the relationship between dependent variable and independent variables, a parametric statistic was used in this analysis. Satisfying the condition of interval/ratio, the Pearson product moment correlation coefficient was applied to measure the strength of association (linear relationship) between independent and dependent variables. The relationship dimension was shown statistically and scatter plot in Table
Finally, an open-ended together with 5-Likert scale points was also included at the end of the survey for their response. The purpose of this question was to explore the other investigated factors that contribute towards the students’ interest in science. Nevertheless, this study reports only the response related to the relationship dimension occurs in the laboratory.
Findings
Exploratory Factor Analysis and Reliability
Three factors exhibited eigenvalues above than 1 as predicted, referring to the relationship dimension in Moos category. These factors also were supported by the acceptable internal reliabilities (Cronbach’s alpha > 0.7). The first factor had high internal reliabilities (Cronbach’s alpha = 0.920) due to the higher number of items for the instructor supportiveness and all other factors are still accepted for exceeding the optimum internal reliability value. Resulting from the factorial analysis, the factors were divided into three themes; instructor supportiveness, involvement and student cohesiveness. Moreover, the coordination of scree plots has suggested to include these three factors model that explained 56.15% of the variation with each of instructor supportiveness, pattern of involvement and student cohesiveness represent 34.10%, 14.91% and 7.14% respectively to the percentage variation for student perceptions of laboratory learning (see Figure
In this study, the reliability test shows all excellent values of ‘Cronbach’s Alpha’ for instructor supportiveness, involvement and student cohesiveness, which are 0.920, 0.726 and 0.745 respectively. Furthermore, the cumulative value of ‘Cronbach’s Alpha’ between dependent and independent variable was also calculated and obtained as 0.883 (Table
By using these three constructs, the data were analyzed by using Pearson correlation analysis and highlighted in Table
Table
Regression analysis
To look whether there is a significant relationship and contribution percentages for each relationship dimension variables in laboratory with the students’ interest in science, multiple regression test was executed and presented in Table
Multiple R 0.408
Square R 0.172
Adjusted R Square 0.166
Standard Error 0.580
Contribution 17.2%
The data in Table
where:
Y = Students’ interest in science
X1 = Instructor supportiveness
X2 = Student cohesiveness
Constant = 2.264
Error = 0.379
Open-ended Questions.
The result of participants’ verbal comments revealed that interaction in the laboratory also affects the students’ interest in science. The following question was asked to the respondents at the end of the survey:
Learning in the laboratory could enhance my interest towards science subjects. Why?
Out of 321 respondents, 24 of them left the answer blanks. Thus, after refining 297 responses, only 2.4% respond on this question based on the relationship dimension factor in laboratory. There are few positive and negative responses depict the interaction occurs in Malaysian universities laboratories and how it greatly influences their interest in science.
Some of the positive responses:
“As in lab, there will be more interaction between students and lecturers. Besides, we can relate the theory and experiment, thus, lead to more understanding about the subject.”
“Because there is more interaction in the lab compare to in the classroom.”
“Because I could try equipment and conduct experiments with friends. Other than that, laboratory is more comfortable and suitable for me when compare sitting in the bored classroom”
“Practicing group works and strengthen my understanding in the science subjects taken”
Some of the negative responses:
“Sometimes, lecturer (instructor) did not monitor each student.”
“Sometimes, lecturers (instructors) are too emotional and this condition causes me not interested to study”
Conclusion
To assess university students’ perception of the relationship dimension in laboratory, this quantitative study is developed following the procedure to achieve reliability and validity of the instrument used. The result from exploratory factor analysis reveals that three variables are manipulating around the relationship dimension in laboratory. Since this study is focusing on the interaction, so the pattern of involvement factor is projecting towards the active communication occurs in the student-centered learning. In contrast to other factors, active involvement of student exhibits weak correlation and did not correlate directly towards the interest in science, even though it is eventually correlated significantly towards the favorable science learning environment (Ahmad, Osman, & Halim, 2013). Further on the data, in term of student-centered and active learning, the undergraduate students already verify that they prefer to carry out laboratory activities with friends in a cooperative group. In all cases, the relationships were moderately varied, explaining <60% of the variation in student perceptions. Similarly, Konak, Clark, and Nasereddin (2014) also found that interaction in laboratory is positively correlated to the increased interest but not as high as competency factor in laboratory learning. Therefore, future study is suggested to explore into other multiple variables to relate between the relationship dimension, the interest in science and competency or understanding.
In addition, as student-centered learning is commonly practiced in the laboratory activities, students-students’ interaction is expected to be higher. However, the perception of Malaysian students is that instructor gives higher support and concerns in the laboratory learning when compared to peers. This finding is consistent to those proposed by Hofstein et al. (2001). Apparently, most students also pointed out that their instructor has given clear instruction, helpful and encouraging, and understanding but strict in completing the laboratory task. In spite of that, some students claimed that instructors should monitor students more often to give encouragement and motivation to them. The continuous motivation would be able to generate a situational interest although the arguments between these two terms still exist (Abrahams, 2009).
The regression analysis also found instructor supportiveness contributes the highest relationship dimension towards their interest in science. The result from instructor supportiveness is quite similar and replicate prior findings as values of leadership and helping of teacher affect greatly on the students’ attitudes (Kijkosol, 2005; Koul & Fisher, 2003). However, in terms of correlation, the finding from student cohesiveness replies distinctly as there is a moderate correlation towards the students’ interest in science. Previous study yields no correlation exist for this factor with the student attitudes in class (Henderson, 1995; Kijkosol, 2005) and the students’ interest in science (Uk, 2001). The following discussion suggests the variation between results with the previous study. At first, this might be the factor of demographic area. A specific study by Uk (2001) was done in a classroom, which is more teacher-oriented. His study also was done in Korea that practicing different study culture when compared to Malaysia. Secondly, this study used survey responses from diverse science fields whereas the study by Kijkosol (2005) and Henderson (1995) was only conducted for the use of undergraduate biology courses. For these reasons, this study is more appropriate to represent science laboratory at diverse institutions.
Besides that, both instructor and students’ cohesiveness contribute of 17.2% and yet significant to the students’ interest in science. The open-ended question attested that only 2.4% of 297 students’ responses would concern that interaction occurs in laboratory has greatly influenced their positive interest in science. They pointed out that cooperative works in laboratory task really help them to learn science and only a few feels demotivated due to unsatisfactory condition with less interactive practices in laboratory. This open-ended question affirms the small percentages contributed from the relationship dimension. In the same reason, most of the students reveal that understanding and integration of theory are among the highest criteria that could develop their positive interest in science. A good level of all these factors are likely to increase motivation and interest of students in science and could be quantified for future studies.
Finally, several aspects are suggested to be improved in the future study. For example, it is suggested to synchronize seven items for each three factors as suggested by McRobbie and Fraser (1993) in SLEI items. For broader definition, future study might integrate and takes into account other validated instruments to measure the relationship dimensions such as Questionnaire on Teacher Interaction (QTI), Teacher Communication Behaviour Questionnaire (TCBQ), Learning Environment Inventory (LEI) and Classroom Environment Inventory (CEI). By incorporating these factors, wider relationship dimension from instructor, students and materials perspectives is hoped to be achieved.
Acknowledgments
We would like to acknowledge the financial support provided by University of Malaya under the Equitable Society Research Cluster (ESRC) research grant RP023B-15SBS and Postgraduate Research Fund (PPP), PG016-2016A.
References
- Abrahams, I. (2009). Does practical work really motivate? A study of the affective value of practical work in secondary school science. International Journal of Science Education, 31(17), 2335-2353.
- Academy of Sciences Malaysia. (2015). Science Outlook: Action towards Vision. Kuala Lumpur, Malaysia.
- Ahmad, C. N. C., Osman, K., & Halim, L. (2010). Hubungan ramalan persekitaran pembelajaran makmal sains dengan tahap kepuasan pelajar [Predictive Relationship between Science Laboratory Learning Environment and Level of Students’ Satisfaction]. Jurnal Pendidikan Malaysia, 35(2), 19-30.
- Ahmad, C. N. C., Osman, K., & Halim, L. (2013). Physical and psychosocial aspects of the learning environment in the science laboratory and their relationship to teacher satisfaction. Learning Environments Research, 16(3), 367-385.
- Beck, C. W., & Blumer, L. S. (2016). Alternative Realities: Faculty and Student Perceptions of Instructional Practices in Laboratory Courses. CBE-Life Sciences Education, 15(4), ar52.
- Bland, J. M., & Altman, D. G. (1997). Statistics notes: Cronbach's alpha. Bmj, 314(7080), 572.
- Chiu, Y.-L., Lin, T.-J., & Tsai, C.-C. (2016). The conceptions of learning science by laboratory among university science-major students: qualitative and quantitative analyses. Research in Science & Technological Education, 34(3), 359-377.
- Cohen, J. (1988). Statistical power analysis for the behavioral sciences . Hilsdale. NJ: Lawrence Earlbaum Associates, 2.
- Costello, A. B., & Osborne, J. W. (2005). Best practices in exploratory factor analysis: Four recommendations for getting the most from your analysis. Practical assessment, research & evaluation, 10(7), 1-9.
- Dawes, J. G. (2012). Do data characteristics change according to the number of scale points used? an experiment using 5 point, 7 point and 10 point scales.
- Ebrahimi, N. A. (2015). Validation and application of the Constructivist Learning Environment Survey in English language teacher education classrooms in Iran. Learning Environments Research, 18(1), 69-93.
- Fraser, B. J. (1998). 5.1 science learning environments: Assessment, effects and determinants. International handbook of science education, 527-564.
- Fraser, B. J., Giddings, G. J., & McRobbie, C. J. (1995). Evolution and validation of a personal form of an instrument for assessing science laboratory classroom environments. Journal of Research in science Teaching, 32(4), 399-422.
- Giddings, G. J., & Fraser, B. J. (1989). Development of an instrument for assessing the psychosocial environment of science laboratory classes. Research in Science Education, 19(1), 123-132.
- Henderson, D. G. (1995). A study of the classroom and laboratory environments and student attitude and achievement in senior secondary biology classes: Science and Mathematics Education Centre, Curtin University of Technology.
- Hofstein, A. (2004). The laboratory in chemistry education: Thirty years of experience with developments, implementation, and research. Chemistry Education Research and Practice, 5(3), 247-264.
- Hofstein, A., Nahum, T. L., & Shore, R. (2001). Assessment of the learning environment of inquiry-type laboratories in high school chemistry. Learning Environments Research, 4(2), 193-207.
- Johnstone, A., & Letton, K. (1990). Investigating undergraduate laboratory work. Education in chemistry, 27(1), 9-11.
- Kijkosol, D. (2005). Teacher-student interactions and laboratory learning environments in biology classes in Thailand. Curtin University.
- Konak, A., Clark, T. K., & Nasereddin, M. (2014). Using Kolb's Experiential Learning Cycle to improve student learning in virtual computer laboratories. Computers & Education, 72, 11-22.
- Koul, R. B., & Fisher, D. (2003). The effects of interaction on student attitudes and outcomes on science in Jamu, India. Paper presented at the International Conference of the All India Association for Educational Researcher, Amritsar, India.
- McRobbie, C. J., & Fraser, B. J. (1993). Associations between student outcomes and psychosocial science environment. The Journal of Educational Research, 87(2), 78-85.
- Moos, R. (1974). The social climate scales: An overview. Palo Alto, CA: Consulting Psychologists Press.
- National Academies of Sciences, Engineering, & Medicine. (2016). Barriers and Opportunities for 2-Year and 4-Year STEM Degrees: Systemic Change to Support Students' Diverse Pathways: National Academies Press.
- Netemeyer, R. G., Bearden, W. O., & Sharma, S. (2003). Scaling procedures: Issues and applications: Sage Publications.
- Piaw, C. Y. (2014). Kaedah dan statistik penyelidikan: ujian regresi, analisis faktor dan analisis SEM Selangor: Mc Graw-Hill Education (Malaysia).
- Reeve, J. (2006). Teachers as facilitators: What autonomy-supportive teachers do and why their students benefit. The Elementary School Journal, 106(3), 225-236.
- Reiner, M., & Gilbert, J. K. (2004). The symbiotic roles of empirical experimentation and thought experimentation in the learning of physics. International Journal of Science Education, 26(15), 1819-1834.
- Ruxton, G. D., Wilkinson, D. M., & Neuhäuser, M. (2015). Advice on testing the null hypothesis that a sample is drawn from a normal distribution. Animal Behaviour, 107, 249-252.
- Samsudin, M. W., Zakaria, Z., Daik, R., Meerah, T. S. M., Abdullah, S. I. S. S., & Halim, L. (2012). Lichens in the environment as a laboratory for environmental and science education. Procedia-Social and Behavioral Sciences, 59, 627-634.
- Tabachnick, B. G., Fidell, L. S., & Osterlind, S. J. (2001). Using multivariate statistics.
- Taridi, N. A. (2007). Pendekatan inkuiri dalam pengajaran biologi secara eksperimen [Inquiry approach in the biology teaching experimentally]. (Doctoral Thesis), University of National Malaysia, Bangi.
- Uk, L. S. (2001). Assessment, description and effects of science classroom environments in Korea: Curtin University of Technology.
Copyright information

This work is licensed under a Creative Commons Attribution-NonCommercial-NoDerivatives 4.0 International License.
About this article
Publication Date
01 May 2018
Article Doi
eBook ISBN
978-1-80296-039-6
Publisher
Future Academy
Volume
40
Print ISBN (optional)
-
Edition Number
1st Edition
Pages
1-1231
Subjects
Business, innovation, sustainability, environment, green business, environmental issues
Cite this article as:
Rosdi, A., Ilham, Z., Azizan, S. A., Zulkefeli, M., & Saifuddeen, S. M. (2018). Relationship Dimension In University Laboratories And Its Effects On Students’ Interest. In M. Imran Qureshi (Ed.), Technology & Society: A Multidisciplinary Pathway for Sustainable Development, vol 40. European Proceedings of Social and Behavioural Sciences (pp. 128-141). Future Academy. https://doi.org/10.15405/epsbs.2018.05.13