
Effects of Individualised Training Zones and Adaptations in Elite Female Rowers


Abstract
Through this paper, we want to prove that the contribution of specific aerobic exercise can be improved in order to increase the total exercise capacity through physiological adaptations. We conducted a cross-sectional observational study on a group made up of 19 elite female rowers between the months of April and November 2015, in Brasov and Bucharest cities, Romania. Two VO2max tests were carried out in the mentioned period. The first test was initiated during the pre-competitive season 2014-2015, while the second test was performed during the general training period 2015-2016. The functional cardiovascular and respiratory parameters were studied, indicating the athlete’s progress and the energy metabolism adaptation. After processing the data relating to the VO2max tests, the following conclusions were drawn: the total increase in lower aerobic effort and higher aerobic effort was significantly higher than the effort performed during the 2014-2015 competitive season. This aspect, through data monitoring, associated increased lung capacity validated through the following monitored parameters: VE/VO2, VE/VCO2 and VT, VO2, respectively, establishing their direct influence on the reported progress and the performance achieved by the athletes during the specific maximal effort. The proportion of VO2/kg was associated with the development and value of the ventilatory thresholds determining their influence on the evolution of the athlete within a maximal effort.
Keywords:
Introduction
Sustaining VO2max testing with an objective to estimate the maximum volume of oxygen used by athletes is associated with a form of monitoring often established in endurance sports. Following this test, the data suggest, through cardiopulmonary assessment, the identification of physiological factors limiting the general effort performed and establishing the main differences between the groups of athletes (Zinner, Sperlich, & Wahl, 2015). Thus, changes in VO2 during the sustained activity will influence energy resource during exercise and the total time spent at certain intensity (Bishop, Bonetti, & Dawson, 2002). Imposing an increased respiratory rate will develop body adaptation through current volume, namely through the process of loading and unloading CO2expiration/O2expiration under a respiratory cycle in order to maintain body homeostasis (Wasserman et al., 2005). From this point, the body’s buffer systems will combat the acidity produced due to high stress area reached by the athlete through the effort performed. Thus, the change in blood pH will be directly proportional to tissue oxygenation, respectively induced imbalance in the body. Moreover, during a maximal effort, unloading CO2 will maintain ventilation (VE), the end-tidal carbon dioxide (PetCO2) and the respiratory equivalent of carbon dioxide (VE/VCO2) at a constant value (Johnston et al., 2016). An increase in CO2 will be directly proportional to the increase in H++, and thus the influence that will be imposed on effective muscle contraction will be reported by the state of the body’s acidity (Carr, Hopkins, & Gore, 2011).
Both heart rate variability and VO2 value evolution in the activity of elite athletes will play an important role in quantifying the competition results. Moreover, the athlete’s age seems to assign a higher or lower total volume of oxygen used by the body. Reducing the average age of athletes will increase the maximum volume of oxygen, while reducing age will associate a decrease in this regard (Hawkins & Wiswell, 2003), aspects that are related to the transport of oxygen to the tissues. As a result, the validity of such testing protocols will impose physiological variability, effectiveness and information regarding the adaptation of individual effort scheduled within the competition season (Stavropoulos-Kalinoglou et al., 2013).
Problem Statement
During the sustained effort, VO2 fraction will facilitate the growing contribution of oxygen, which is often associated with the respiratory rate, determining the evolution of ventilation and respiratory exchange ratio (Ramos-Jimenez et al., 2008), elements that are significantly associated from a statistical point of view in T2 (second test) versus T1 (first test). The efficiency of the respiratory through the contribution of aerobic effort is confirmed by the data for ventilation and discharge rates of carbon dioxide (Arena et al., 2004), being reported as a direct influence on the result of the final computational evolution, as in T2. At the same time, supporting a maximal effort will require increased ventilation, representing a level associated with an inability to satisfy the demands imposed by exercise, which is possible to reduce the end-tidal oxygen tension (Johnson et al., 1996; Forman et al., 2010) and to limit the development of effort, as in T1 testing. Thus, in separate cases such as T2, it will decrease the elimination rate of carbon dioxide, being reported an increase in muscle activity by maintaining carbon dioxide fraction in the blood. This is described as a constant action associated with the efficiency of the respiratory system (Bernardi et al., 2014; Arena et al., 2004). Increased oxygen consumption in T1 and T2, respectively, by increasing the frequency of breathing during exercise, will assign a proportional increase in CO2 output, this action limiting the total amount of oxygen that will reach the alveoli (Bussotti et al., 2008). A proportional increase in CO2 will not set a stationary level that influences the energy metabolism through the direct relationship with PetCO2 and PaCO2, respectively (George, Sen, & Raveendran, 2014), setting the final percentage of energy metabolism contribution during exercise, an action studied in this paper, which was statistically insignificant in T1-T2 testing periods.
Research Questions
Can the contribution of specific aerobic effort improve in order to increase the total exercise capacity through physiological adaptations?
Purpose of the Study
Evaluating and monitoring athletes’ adaptations throughout the qualification periods for the 2016 Olympic Games in Rio de Janeiro.
Research Methods
A cross-sectional observational study was conducted after obtaining verbal acceptance from the athletes to participate in this study. Through the establishment of the working methodology, VO2max testing was scheduled to steady, according to the athletes’ activity. As a result, the athletes performed a rowing-specific maximal effort on the Concept 2 ergometer, an action during which gas exchange values were monitored.
The study was conducted between April and November 2015 in Brasov and Bucharest cities, Romania, locations associated with specific training centres for elite athletes. A group of 19 elite female athletes were included in the study. In the proposed methodology, the study group was not divided or subdivided. However, the inclusion criteria were the athlete’s national/international performance and their presence in the national team. Medical aspects were also taken as criteria for inclusion in the study.
Two VO2max tests were carried out in the mentioned period. The first test (T1) was initiated during the pre-competitive season 2014-2015 (a study group of 19 female rowers), while the second test (T2) was performed during the general training period 2015-2016 (a study group of 17 female rowers of the total of 19 included).
The tests were performed using the Cosmed Quark CPET equipment (Rome, Italy) and Concept 2 ergometer (USA). The heart rate was monitored through ANT+/Bluetooth heart rate monitor made by Cosmed. The equipment was calibrated at the start of each test with O2 concentrations of 16% and 2% CO2. The turbine was calibrated with a 3 L syringe at the beginning of each test. The athlete’s preparation for the testing activity, characterized by maximal effort, was achieved through kinaesthetic exercise for 20 minutes, specific functional adaptation and growth potential effort by simulating activity on the ergometer at a heart range between 120-175 b/min. In performing the effort, the following parameters were studied: HR (heart rate), RER (respiratory exchange ratio), VE (ventilation), VE/VO2 (ventilator equivalent for oxygen), VE/VCO2 (ventilator equivalent for carbon dioxide), VO2 (maximum volume of oxygen), VO2/kg (maximum volume of oxygen per kg), VT1 (ventilatory threshold 1), VT2 (ventilatory threshold 2), PetO2 (end-tidal oxygen tension) PetCO2 (end-tidal carbon dioxide) METS (metabolic equivalents), CHO (carbohydrate consumption), fat (fat consumption), EXP (expiration), T1 (test 1), T2 (test 2).
For the statistical analysis, we used the Graph Pad Prism 5.0 software in order to analyse the monitored data. The used statistical indicators were standard deviation (SD) and the coefficient of variation (CV). Data exposure was performed through mean and median values. The Pearson correlation with a 95% confidence interval was used to identify the statistical connection between two different parameters. The level of statistical significance was α≤0.05.
Findings
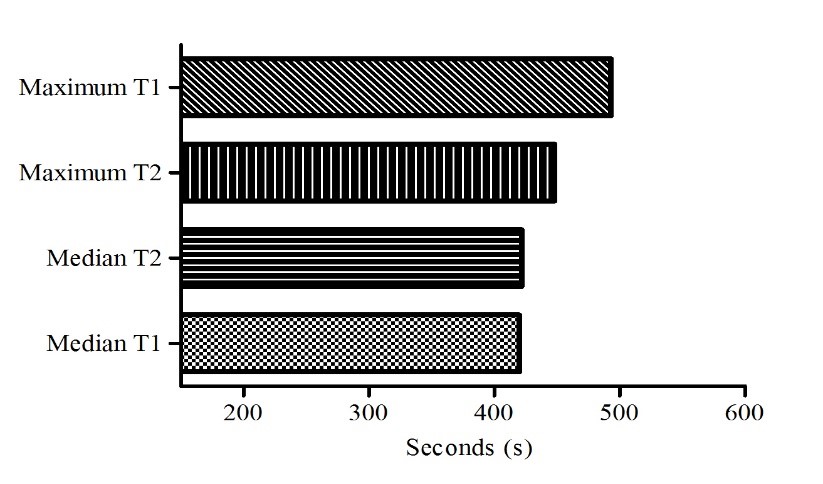
The average age of the study group in T1 (test 1) and T2 (test 2) was 21 years. The anthropometric ratio between the two tests was different. Thus, in T1, the athletes recorded a median equivalent to 73.5 kg and 181 cm in height, compared to 75 kg and 181 cm monitored in T2 period. So, the athletes’ body weight was different, in statistical terms, by p=0.0001, r=0.979, CI95%=0927 to 0994. The total completion time during the 2,000-m race simulation reached a median of 420 seconds, with a minimum of 391.2 seconds and a maximum value equivalent to 493.2 seconds. Thus, as against T2, we reported a statistical difference in the completion time and the performance achieved on the ergometer (Figure
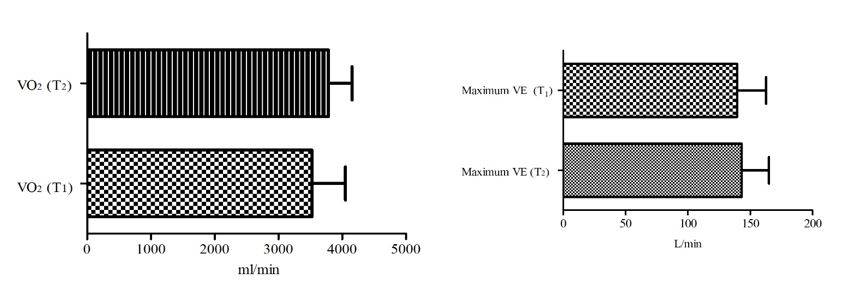
The variation in ventilatory thresholds was statistically significant for VT2. Thus, we did not identify statistically significant differences between the ventilatory threshold 1, monitored in the two tests (p=0.1629, r=0.394, CI95%=-0189 to -0772); however, we identified a different statistical ratio regarding VT2 (p =0.0001, r=0.869, CI95%=0617 to -0959). Thus, during test 2, VT1 had the value 168 b/min, as compared to 156 b/min identified in T1. At the same time, VT2 in T1 was equal to 183 b/min, while the T2 test identified an increase of 189.5 b/min at the midpoint. The respiratory system required significant changes in the proposed values of respiratory rate, namely ventilation and VO2. As a result, a decrease in respiratory rate was found in T2 test, the maximum median value in T1 being 67.95 b/min and 66.88 b/min in T2. However, the evolution of ventilation was directly proportional to the maximum volume of oxygen used by the body through p=0.0001, r=0.923, CI95%=0733 to -0979. Thus, statistically significant differences were identified between the two values, VE and VO2, monitored during T1/T2 (Figure
VE/VO2 or VE/VCO2, along with the tidal volume, significantly changed between the two periods, with positive developments in T2, but without identifying statistically significant differences regarding the body’s metabolic equivalent or the respiratory exchange ratio. By the lack of influence of RER, no differences were found toward the evolution of energy metabolism through carbohydrate and fat consumption, but the ratio between PetO2/PetCO2 and energy output during exercise was statistically significant (Table
The results obtained in this paper validate the hypotheses proposed according to which the individualization of aerobic exercise contribution in daily elite athletes training may impose functional changes in the evolution of specific physiological adaptation during maximal effort. Studies carried out over time claims that the evolution of specific energy needs, during maximal exercise, can reach 25-35 kcal/min, similar values identified in the work carried out through this paper, with a slight increase in T2 compared to T1. Moreover, it is noted that most of the studies conduct activities aimed on the biomechanical and physiological development of body elements, and less on information regarding energy metabolism elements (Hill & Davies, 2002). Thus, the body's physiological evolution, and the total quantity of oxygen that can be used by the body will be influenced by the maximum volume of oxygen (Helgerud et al., 2007) recorded in the effort performed through the two tests carried out. From this point, the total amount of oxygen taken up by the body will facilitate the adaptation of the body through metabolic balance (Martin, Tomescu, & Hadmaş, 2016). Regulation and increasing the share of total maximum volume of oxygen is attested in the literature as being able to be achieved through aerobic effort, the long-term average, established at an HR percentage between 50-75%.
Conclusion
The total increase in lower aerobic effort and higher aerobic effort was significantly higher than the effort performed during the 2014-2015 competitive season. This aspect, through data monitoring, associated increased lung capacity validated through the following monitored parameters: VE/VO2, VE/VCO2 and VT, VO2, respectively, establishing their direct influence on the reported progress and the performance achieved by the athletes during the specific maximal effort. Conclusive data showed that they had an effect on the individual aerobic capacity during maximal effort. The proportion of VO2/kg was associated with the development and value of the ventilatory thresholds determining their influence on the evolution of the athlete within a maximal effort.
References
- Arena, R., Myers, J., Aslam S. S., Varughese E. B., & Peberdy, M. A. (2004). Peak VO2 and VE/VCO2 slope in patients with heart failure: A prognostic comparison. Am Heart J., 147(2), 354-360.
- Bernardi, E., Melloni, E., Mandolesi, G., Uliari, S., Grazzi, G., & Cogo, A. (2014). Respiratory muscle endurance training improves breathing pattern in triathletes. Ann Sports Med Res., 1(1), 1003-1010.
- Bishop, D., Bonetti, D., & Dawson, B. (2002). The influence of pacing strategy on VO2 and supramaximal kayak performance. Med Sci Sports Exerc., 34(6), 1041-1047.
- Bussotti, M., Magrì, D., Previtali, E., Farina, S., Torri, A., Matturri, M., & Agostoni, P. (2008). End-tidal pressure of CO2 and exercise performance in healthy subjects. Eur J Appl Physiol., 103(6), 727-732.
- Carr, A. J., Hopkins, W. G., & Gore, C. J. (2011). Effects of acute alkalosis and acidosis on performance: A meta-analysis. Sports Med., 41(10), 801-814.
- Forman, D. E., Myers, J., Lavie, C. J., Guazzi, M., Celli, B., & Arena, R. (2010). Cardiopulmonary exercise testing: Relevant but underused. Postgrad Med., 122(6), 68-86.
- George, J. M., Sen, K., & Raveendran, C. (2014). Evaluation of the effect of exercise on pulmonary function in young healthy adults. International Journal of Biomedical and Advance Research, 5(6), 308-312.
- Hawkins, S., & Wiswell, R. (2003). Rate and mechanism of maximal oxygen consumption decline with aging: Implications for exercise training. Sports Med., 33(12), 877-888.
- Helgerud, J., Høydal, K., Wang, E., & Karlsen, T. (2007). Aerobic high-intensity intervals improve VO2max more than moderate training. Med Sci Sports Exerc., 39(4), 665-671.
- Hill, R. J., & Davies, P. S. (2002). Energy intake and energy expenditure in elite lightweight female rowers. Med Sci Sports Exerc., 34(11),1823-1829.
- Johnson, B. D., Aaron, E. A., Babcock, M. A., & Dempsey, J. A. (1996). Respiratory muscle fatigue during exercise: Implications for performance. Med Sci Sports Exerc., 28(9), 1129-1137.
- Johnston, M. J., Cook, C. J., Drake, D., Costley, L., Johnston, J. P., & Kilduff, L. P. (2016). The neuromuscular, biochemical and endocrine responses to a single-session vs. double-session training day in elite athletes. J Strength Cond Res., 30(11), 3098-3106.
- Martin, Ş. A., Tomescu, V., & Hadmaş, R. M. (2016). The amount of lipids used during a maximal effort will be influenced through aerobic exercise capacity. Medicine Evolution, 22(3), 301-309.
- Ramos-Jiménez, A., Hernández-Torres, R. P., Torres-Durán, P. V., Romero-Gonzalez, J., Mascher, D., Posadas-Romero, C., & Juárez-Oropeza, M. A. (2008). The respiratory exchange ratio is associated with fitness indicators both in trained and untrained men: A possible application for people with reduced exercise tolerance. Clin Med Circ Respirat Pulm Med., 1(2), 1-9.
- Stavropoulos-Kalinoglou, A., Metsios, G. S., Veldhuijzen van Zanten, J. J., Nightingale, P., Kitas, G. D., & Koutedakis, Y. (2013). Individualised aerobic and resistance exercise training improves cardiorespiratory fitness and reduces cardiovascular risk in patients with rheumatoid arthritis. Ann Rheum Dis., 72(11), 1819-1825.
- Wasserman, K., Hansen, J. E., Sue, D. Y., Stringer, W. W., & Whipp, B. J. (2005). Physiology of exercise. Principles of exercise testing and interpretation: Including pathophysiology and clinical applications. Philadelphia: Lippincott Williams & Wilkins.
- Zinner, C., Sperlich, B., & Wahl, P., & Mester, J. (2015). Classification of selected cardiopulmonary variables of elite athletes of different age, gender and disciplines during incremental exercise testing. Springerplus, 4:544. Doi 10.1186/s40064-015-1341-8
Copyright information

This work is licensed under a Creative Commons Attribution-NonCommercial-NoDerivatives 4.0 International License.
About this article
Publication Date
05 March 2018
Article Doi
eBook ISBN
978-1-80296-035-8
Publisher
Future Academy
Volume
36
Print ISBN (optional)
-
Edition Number
1st Edition
Pages
1-484
Subjects
Sports, sport science, physical education, health psychology
Cite this article as:
Tomescu, V., & Teodorescu, S. (2018). Effects of Individualised Training Zones and Adaptations in Elite Female Rowers. In V. Grigore, M. Stanescu, & M. Paunescu (Eds.), Physical Education, Sport and Kinetotherapy - ICPESK 2017, vol 36. European Proceedings of Social and Behavioural Sciences (pp. 218-224). Future Academy. https://doi.org/10.15405/epsbs.2018.03.29