
Visualization As A Convenient Tool To Support The Teaching Of Mathematical Proofs


Abstract
Subjects dealing with graph theory and combinatorial optimization belong among the basic subjects of informatics study. Their aim is above all to develop and deepen students’ capacity for logical and algorithmic thinking. Mathematical proofs that are inseparable part of these subjects do not belong to popular topics among students due to the difficulty to understand this field of mathematics. Within educational process we are searching for various tools to help students deal with this area of mathematics. Suitable visualization could become a very convenient instrument used to enhance understanding of theorems and their proofs. Using visualization and deep analysis of the topic together with discussion on mutual relationships between solutions to problems allows the teacher to enhance student’s logical thinking and support their understanding to more complex proofs. In the paper we provide a justification for the importance of the mathematical proofs for students of informatics at first. Secondly, we introduce a research study examining an impact of visual applications on understanding of mathematical proofs; we implemented presentations instructed within the Discreet mathematics course, which are used to visualize proofs of mathematical theorems in the area of the graph theory, and we analysed students’ approaches to proofs visualization and proofing in general.
Keywords: Proofvisualizationgraph theorymultimedia applicationteaching
Introduction
Evidence or proof - a term that is often used both in everyday life and in many fields of science.
Proofs in mathematics
Proof was, is and will be one of the concepts that characterize mathematics. We can state that the concept of rigorous mathematical proof significantly singles mathematics out from the spectrum of other scientific disciplines. Mathematical proof, unlike evidence in other areas, is fundamentally unquestionable (Garnier and Taylor, 1996).
Proofs in informatics
There is a clear correlation between the proof of the mathematical theorem and the formulation of the algorithm. In mathematics, it is important to speak accurately and to be assured of the statement; on the other hand, in informatics it is important to learn how to design algorithms and to be absolutely sure of their correctness. Mathematical proof is the basis for proving the correctness of the algorithm. According to Hlinený (2010), the most frequently used proofing tool in informatics is mathematical induction.
Problem Statement
Although proofs in informatics are important, plenty of students consider them to be too sophisticated and even unnecessary. The most common reasons why students do not like proofs is that they do not understand them and thus they are not motivated to implement them. University students are expected to be interested in the chosen subject, to be eager to learn as much as possible about it and to understand the subject matter well. Simply memorizing theorems is wrong, as the consequence is that students do not know what the prerequisite of the theorem is, what is its statement and overall meaning, what is the theorem intended for, and how to use it further. Therefore, it is essential to constantly seek ways how to make the teaching of mathematical proofs more transparent and comprehensible.
Very often, better understanding of what needs to be proofed is brought by itemizing and visualization of the definitions and terms included in the theorem, the apt graphics of the implications, and correlations, i.e. the visualization of the proofs. Appropriate visualization or animation of theorem proofs could help students to reach better and deeper understanding.
Graph theory at the University of Hradec Králové
Basics of the graph theory and combinatorial optimization form the main content of Discrete Mathematics (DIMA) intended for students of informatics fields of study at our faculty. Great emphasis is placed on the understanding of the mathematical theorems and their proofs. In order to promote the effectiveness of the proof teaching, various presentations, described below, have been developed for the DIMA subject.
Proofs visualization
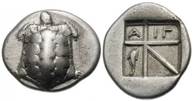
The proof visualization, or in other words "proof without words", appeared already in the deep past. The ancient Greeks of Aegina Island used in the 6th Century BC silver coins, on the back of which there was a geometric proof without the words of the square of a binary a + b: (a + b) 2 = a2 + 2ab + b2 (Jones, 2011), See Figure
At present, plenty of scientific results have been published regarding the research in the field of mathematical proof visualization:
In 2007, Hanna and Sidoli (Hanna, Sidoli, 2007) presented a brief overview of the possibilities of using visualizations that were the subject of discussion in the literature of mathematical philosophy. They dealt with the question - to what extent can visualizations be used as proofs. They concluded that we were far from consensus in all possible roles of visualization in mathematics, mathematical education, and above all its role in the proofs.
Marrades and Gutiérez studied whether dynamic geometry can facilitate students´ transition from experimental activity with mathematical objects to formal deductive proof. They detected that implementation of dynamic geometry into teaching helps students understand the abstraction of the reasoning of discovered correlations, and that students need more time for experimental activities in the application environment before they can move to hypothesis proofing (Marrades, Gutiérez, 2000).
Another studies can be found in (Kilic, 2013), (Štrausová, 2012), (Robová, 2013), (Autexier et al. 2012), (Knill and Slavkovsky, 2013), (Ugurel et al. 2016).
Research Questions
How can mathematical proof teaching be enhanced? Can visualization help in graph theory proof teaching?
Purpose of the Study
The aim of this study was twofold: to explore available visualization tools at the University of Hradec Králové, suitable as a supplement to the explanation of the proofs of mathematical theorems taught in the theory of graphs, and to analyse students' projects and their views on proof visualization and proofing in general.
Research Methods
This study is part of a quasi-experiment in which the effect of visual representation of proofs on its comprehensibility is explored.
Research Sample
The object of our research are students who attended the DIMA course in the academic years 2015/16 and 2016/17 at the University of Hradec Králové. Both, the control and experimental groups consisted of 67 students. The teaching of proofs of the control group was realised in a standard form, that is, the teaching of proofs by means of propositional logic. In the proof instruction of the experimental group were used the visual representations of proofs.
Research tools
The main research tool of this study was the analysis of tools available at the University of Hradec Králové used to support the teaching of proofs in the subject DIMA and the analysis of students' projects as well as their views on visualization and proofing. Additional tools included observation and analyses of students' views on proofing and visualization, and a questionnaire.
Procedure
The research was conducted in the real learning settings. After completing the DIMA course, the participants of this study were to conduct a credit project, in which they instructed to create a visualization of a selected mathematical statement from the field of graph theory. They were also asked to write an essay about their work and attitudes to proofs and visualization.
Findings
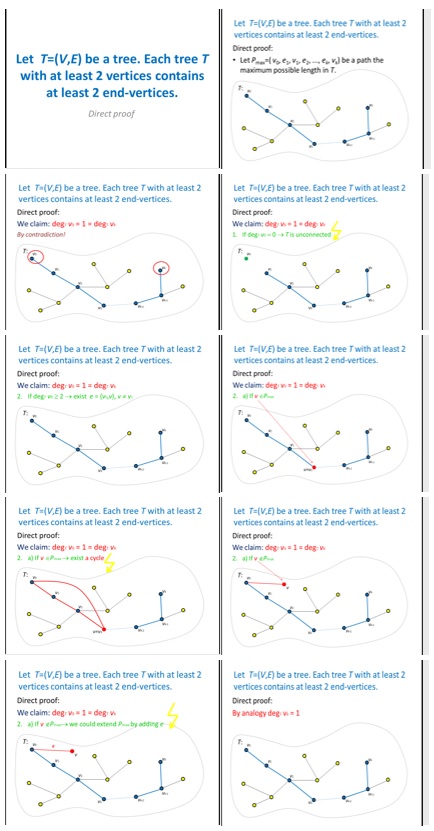
Based on the questionnaire results, filled in by 67 respondents in the academic year 2015/2016,in which the respondents were asked what they think would help them better understand the proof instruction (note: 20% of respondents requested visualization), PowerPoint presentations were created to support the teaching of theorems and proofs in the DIMA subject. The presentations, which provide step-by-step proof of the statement, were gradually created and supplemented by dynamic sections, such as animations or videos that would bring better understanding of the subject matter. Some presentations have been created with the support of the GrAlg multimedia application, which has been used for several years in the subject of graph theory (Milkova and Sevcikova, 2016). GrAlg is used for visualization of terms, correlations and graph algorithms (for more information about the program GrAlg see (Ševčíková & Milková, 2016).
In Figure
In the academic year 2016/2017, 67 students, in the instruction of whom the teaching was already conducted with the presented proofs, were interviewed by the form of the questionnaire. 17% of students would prefer more multimedia tools in the instruction. In order to support the effectiveness of the proof teaching in the DIMA course, a specific GraPro multimedia application was developed. The GraPro Multimedia Tool was created in a source code editor called Visual Studio Code from Microsoft (Šťastná). In 2017, the application was tested by 10 students who provided valuable inputs to GraPro development, for example, easier operating or better understanding for students. At the end, students filled out a questionnaire in which they were asked about the tool benefits. Based on the results of the questionnaire, the benefits for students can be presented as follows:
easy operation and clarity,
interactive environment and animation,
possibility of individual movement in time,
quality performance of visualization.
From next year this app will be used as a complement to existing instruction to improve imagination and overall understanding of challenging topics.
Conclusions from the credit projects
At the end of the DIMA course students were divided into groups (1-5 members) and each group worked out a final project, the task of which was visualization of the selected statement. In both groups, control and experimental, 29 projects were created. The visualization was meant to be introduced and presented to the group of fellow students so that they were able to understand the proof. Based on the presentation and visualization performance, the projects were rated according to the following parameters: Proof correct, Proof with minor errors, Proof misunderstood, Proof wrong. The results can be seen in Table
An interesting observation was what types of proofs were used by the students. In the control group, in which the teaching was conducted in the standard way, i.e. the proof was recorded by means of the propositional logic and the students worked with teaching texts where proofs were printed, the students did not favour any type of evidence. In their essays they pointed out that the main criterion for choosing a particular proof was the simplicity. The implication from the presented proofs is that even though the students chose in their opinion "simple" proof , they often did not understand it and for this reason they were unable to create an appropriate visualization, based on which they would provide the explanation of the proof. In the experimental group, where instruction was supplemented by visualizations, and students did not work with the teaching texts of proofs, recorded by means of propositional logic, the students preferred proof by contradiction, and in their essays they suggested that this type of proof seemed easier, they knew exactly how to proceed and logically deduced parts of the proofs until they reached the conclusion. The proof of mathematical induction, even though it is the most common proofing tool in informatics, was misunderstood by the students, which was also supported by the fact that it was used only once in the control group and not even once in the experimental group . The results of the used types of proofs can be seen in the graph in Fig.

The important facts and observations that were obtained from the students’ essays analysis are listed below:
Some students have a negative relationship to proofing. For some, this relationship has already been built up at secondary school. And even after completing the course, they do not realize the importance of proofing:
„I had the feeling that proofing is just one of the ways to complicate the already difficult situation of students. “
„There is no motivation, no desire to solve the proofs. In the proof, you have to think something out, logically deduce and then write it using the inverted E and the crossed out V, and it's crazy for me.“
„I take the proofs with some degree of exaggeration as "the necessary evil" or "the self-purpose" issue. “
Despite a negative attitude towards proofs, some students are aware of proofs´ importance in the field of informatics, e.g.
„Statement proofing is to me an important part of the analyst's thinking because there should be created some analysis of the problem, which must be justified by the refutation of the statement negation. This ability definitely has a positive impact on correct and logical reasoning. “
„I only realized the importance and the essence of proofing when I started studying the online course "Design and Analysis of Algorithms" recommended to us by the teacher at the end of the Programming I. course. Only then did I understood why the proofs are important and how they relate to the algorithms, which we will be creating in the future. For an algorithm designer, it is undoubtedly important to be sure that the algorithm is bulk (e.g., the output of the sorting algorithm QuickSort will always be a sorted list, regardless of the length of the original list) or that it really has the computational complexity we believe it has.“
„Definitely from a logical point of view, I would appreciate it as a positive experience. “
Visualisation is generally perceived positively. Students realize that it helps them in the process of understanding. In making visualizations, some students realized what is important to illustrate and what is essential:
„Visualization brings enough light into the issue. “
„Appropriately chosen visualization of proof may be essential. “
„Making visualization is good for the creator of the presentation. In the case of any confusion, the context can be better grabbed and understood. “
„Such tools are exactly what helps me personally understand things. “
The main problem of the students was that they did not know how to start and which type of proof to choose. They realized that proof creating is not an easy thing, there is no precise procedure, a guide that tells you what kind of proof to choose, and that a lot of proofs should be done to develop the feeling and intuition for the proof creation.
A lot of students approached the project positively, as it motivated them to study proofing in details:
„Without that, I would really just passed the proofs quickly.“
In general, students were amused by the visualization and they created interesting, attractive or original visualizations that would not only help fellow students to understand the proof, but thanks to the originality students memorized the proof procedure and were able to apply it.
Conclusion
The results of our research confirmed the effectiveness of the used strategy applied during the instruction in the experimental group, i.e. the use of visualization. Most teachers agree that using visualization in learning process should facilitate learning. We can find further studies about visual presentation and its efficiency in plenty of scientific articles, e.g. (Kostromina & Gnedykh, 2015): (Kosslyn, 1980) and (Shepard and Cooper, 1982). These authors confirmed the argument that images are better memorable than words. The Domik´s study (Domik, 1994) showed that the use of visualization in teaching assumes an active, investigative and motivating environment that provides an intuitive understanding of complex processes.
Visualization plays an important role in mathematical proofs instruction. Students´ involvement in visualization leads to a better understanding of the proof itself and encourages students to use their potential. Based on our current research and our own experience, we recommend using of visualization as an appropriate tool for mathematical proofs instruction.
Acknowledgments
This research has been supported by specific research project of the University of Hradec Kralove, both Faculty of Science and Faculty of Education in 2017.
References
- Autexier, Serge, Dominik Dietrich, and Marvin Schiller (2012). Towards an intelligent tutor for mathematical proofs. From: https://pdfs.semanticscholar.org/f0c0/7b46fd7e3df74a9960f30665e17d62b32b52.pdf.
- Domik, Gitta (1994): Visualization education. In Computers & Graphics, 18 (3) pp. 277-280. http://dx.doi.org/10.1016/0097-8493(94)90026-4.
- Garnier, Rowan; Taylor, John (1996). 100% Mathematical Proof. [s.l.]: John Wiley & Sons, 1996. ISBN 0 471 96198 1.
- Hanna, Gila; Sidoli, Nathan (2007). Visualisation and proof: a brief survey of philosophical perspectives. ZDM 39(1-2), pp. 73-78. doi:
- Hehner, Eric; Lev Naiman (2013). Netty: A Prover’s Assistant. 2013, From: http://www.db.utoronto.ca/~hehner/netty_rome.pdf.
- Hlinený, Petr (2010). Introduction to Computer Science 2010, Translation: Úvod do Informatiky 2010, From: https://is.muni.cz/do/1499/el/estud/fi/js10/uinf/web/UInf-text10.pdf.
- Jones, Alfred (2011). Ancient Coinage. Historic mysteries. From z: http://historicmysteries.com/ancient-coinage.
- Kilic, Hulya (2013). The effects of dynamic geometry software on learning geometry. In Proceedings of CERME 8, Antalya, Turkey, 2013, 10 p. From: http://cerme8.metu.edu.tr/wgpapers/wg15_papers.html.
- Knill, Oliver and Elizabeth Slavkovsky (2013). Illustrating mathematics using 3D printers. From: http://www.math.harvard.edu/~knill/3dprinter/documents/trieste.pdf.
- Kosslyn, S. M. (1980). Image and mind. Harvard University Press.
- Kostromina, S., Gnedykh, D. (2015). Type of visualization and quality of digest ion of educational information by students. Procedia – Soc. Behav. Sci. 171, 340–349.
- Marrades, R., Gutiérrez, Á. (2000). Proofs produced by secondary school students learning geometry in a dynamic computer environment. Educational studies in mathematics, 44.1-2: 87-125.
- Milkova, E., Sevcikova, A. (2016). Deeper insight into graph theory using multimedia applications. International journal of circuits, systems and signal processing. North atlantic university union, 2016. 7s. ISSN: 1998-4464.
- Robová, J. (2013). The role of dynamic geometry in hypothesis determination and testing, Translation: Role programů dynamické geometrie při objevování a dokazování hypotéz. The Proceedings of the 6th Conference Use of Computers in the Teaching of Mathematics. Department of Mathematics, Faculty of Education, University of South Bohemia, České Budějovice.
- Shepard R.N. & Cooper L.A. (1982). Mental Images and Their Transformations. MIT Press, Cambridge (MA).
- Ševčíková, A., Milková, E. (2016). Multimedia Applications: Graph Algorithms visualization. PROCEEDINGS. Budapest: IEEE, 2016. 6s. ISBN: 978-1-5090-3909-8.
- Štrausová, I. (2012). Visual proofs in math instruction, Translation: Vizuální důkazy ve výuce matematiky, South Bohemia Mathematical Letters, Volume 20, No. 1, 48–56.
- Šťastná, M. (2017). Visual leasing support for courses dealing with graph theory and graph algorithms, Translation: Vizuální podpora výuky předmětu zabývajících se teorií grafů a grafovými algoritmy. Thesis, University of Hradec Králové, Czech Republic, June 2017.
- Ugurel, I., Morali, H.S., Karahan, O., & Boz, B. (2016). Mathematically gifted high school students’ approaches to developing visual proofs (VP) and preliminary ideas about VP. International Journal of Education in Mathematics, Science and Technology, 4(3), 174-197. DOI:
Copyright information

This work is licensed under a Creative Commons Attribution-NonCommercial-NoDerivatives 4.0 International License.
About this article
Publication Date
16 October 2017
Article Doi
eBook ISBN
978-1-80296-030-3
Publisher
Future Academy
Volume
31
Print ISBN (optional)
-
Edition Number
1st Edition
Pages
1-1026
Subjects
Education, educational psychology, counselling psychology
Cite this article as:
Ševčíková, A., Milková, E., & Pekárková, S. (2017). Visualization As A Convenient Tool To Support The Teaching Of Mathematical Proofs. In Z. Bekirogullari, M. Y. Minas, & R. X. Thambusamy (Eds.), ICEEPSY 2017: Education and Educational Psychology, vol 31. European Proceedings of Social and Behavioural Sciences (pp. 599-608). Future Academy. https://doi.org/10.15405/epsbs.2017.10.57