
Income and Wealth Status of Russian and Tomsk Region’s Pensioners


Abstract
In the article the results of a study of income and material well-being of old generation of Russia and Tomsk Region are presented. Data of Russian federal and regional statistics shows that income of pensioners is growing fast and their wealth status in 2014 can be estimated as acceptable. Analysis of the data of an opinion survey of older people of the Tomsk region does not support this conclusion. According to the regression model in order to achieve a satisfactory standard of living pensioner’s income should be at least 13-18 thousand rubles per month, while in 2014 the average pension was lower (about 11-12 thousand rubles). In our opinion state regulation requires further increase in the average pensions, as well as the revision of the minimum consumption basket and minimum needs of subsistence for this group.
Keywords: Incomematerial wealththe elderly (old generationretired)statistical analysisthe federal statisticsopinion surveys
Introduction
Measurements of relationship between people income and their well-being is one of the main indicators in the system of assessment of the lifelong well-being of the population. This is especially true for the elderly group of population, which share in the developed countries and in Russia is growing in recent years. Thus a lot of primary research was conducted in the leading OECD countries (Whitehouse (2008), EuroStat (2011), OECD (2013)), and in Russia (Misikhina (2014), Bekmurzaev & Shamilev (2014), Grjachenko (2015)) and other developing countries (Rad (2014)).
Leading scientists are actively investigating the following aspects of the well-being of older people:
The level of the population and its correlations with the subjective well-being of elderly.
The level and dynamics of the population's income, the ratio of minimum needs of subsistence and pension payments.
The structure of elderly income in regard to dwelling place, age and sex.
Subjective self-assessment of elderly well-being depending on a variety of objective and subjective factors (employment, welfare, physical and mental health, social and marital status, etc.).
Research is usually conducted at the federal (national) level, although statistics are collected also on a regional basis (OECD Regional Well-Being (2014)). For the Russian Federation regional dimension is very important due to significant differences in living standards of older people in different parts of the country (Bekmurzaev & Shamilev (2014)). Thus, the level of income and pensions is an important issue of statistical monitoring and cross-country comparisons. The focus on study and prediction is made not only by theorists (sociologists, economists, psychologists ect.) but by doers (consultants on the issues of the state pension insurance, long-term strategiests, authors state social policy). Almost any theoretical study is based on large amounts of statistical information on living standards and well-being of older people, and measurement techniques which are proven in practice of the leading developed countries.
Russian Federation is currently one of the countries, for which it is important to use all possible sources to enhance national economic system development. The dynamics of demographic indicators over the past 10 years shows a steady increase in the share of older people in the structure of the population, therefore quality of their life is becoming one of the most important directions of the state economic policy.
The aim of this article includes investigation of links between income and wealth status of pensioners at the level of Russia and one of its regions - the Tomsk Region. At the level of Russia we use federal statistics as the main source of information. At the level of the Tomsk Region it is data of panel study of the older generation of the Tomsk region held by the Department of Economics of the Tomsk Polytechnic University. The study period is 2001-2014 (at Russian level) and 2014 (at Tomsk Region’s level).
Problem statement and research methods.
In this paper we analyze such indicators as pensions, income and wealth status of pensioners at the level of Russia and at one of its regions - the Tomsk region. Research on the Russian level is carried out on federal statistics basis. Among its advantages are objectiveness of indicators, long interval of observation, possibility of comparing income (pensions) to the wealth status (minimum needs of subsistence) and other indicators. At the same time, a serious lack of federal statistics is a narrow understanding of the income as only pension and also wealth status as only minimum needs of subsistence.
These disadvantages are compensated by the possibilities of panel data of the older generation of the Tomsk region. In this study, income is defined as all possible cash flows and wealth status is split by categories of goods that are affordable to the older consumer. List of questions, on which analysis was carried out, is presented in Table
The data of federal statistics and sociological research was processed using methods of statistical analysis, including descriptive statistics, relative indicators, grouping into classes, growth rates, covariations and correlations, visualization techniques. Some of these methods were described and applied in the papers (Spitsin, Mikhalchuk, Spitsina, Akerman, Tyuleneva, Semes & Novoseltseva (2015) and Spitsin, Mikhalchuk, Spitsina, Shabaldina & Novoseltseva (2015)). Statistical analysis was performed in STATISTICA 6.0 (Borovikov (2003)).
Study results
Analysis of the data of the Federal Statistics at the level of Russia and Tomsk Region.
In the period 2001-2014 there were considered (Figure
- Dynamics of average pension payments;
- Ratio of pensions to the subsistence minimum;
- Ratio of the pensions growth rate and other socio-economic indicators (in cumulative manner).
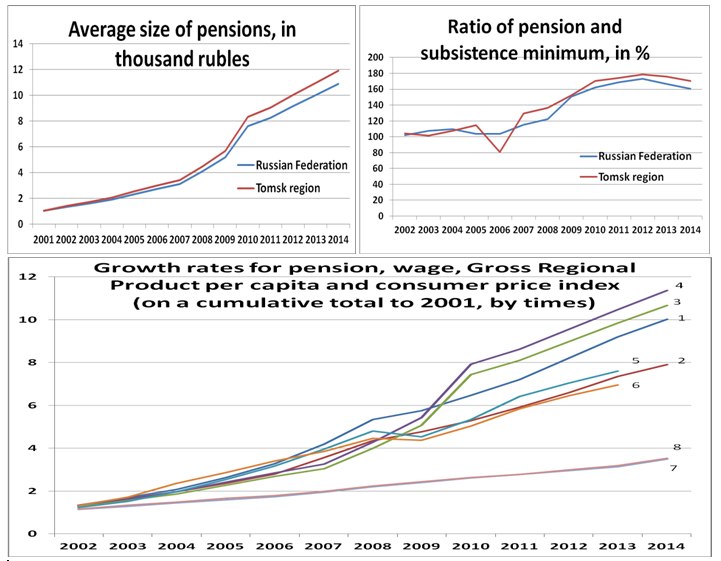
Comments:
wage growth rate in Russia
wage growth rate in Tomsk region
pension’s growth rate in Russia
pension’s growth rate in Tomsk region
Gross Regional Product per capita in Russia
Gross Regional Product per capita in Tomsk region
Consumer price index in Russia
Consumer price index in Tomsk region
Based on the data there may be a very favorable impression about pension maintenance in Russia in general, and in the Tomsk region in particular (findings for Russia and the region are congruent)
1. The average pension increases quickly throughout the observed period. Especially the big jump was observed in 2008-2009. Probably, during the crisis the Russian government tried to stimulate effective demand by the increase of pensions.
2. Pensions grow significantly faster than the subsistence minimum. If during the period of 2001-2006 they were comparable to the subsistence minimum, in 2014 they exceed the subsistence minimum more than 1.6 times.
3. Pensions are rising faster than the average wage and GDP per capita and significantly faster than the consumer price index.
Thus, according to federal statistics income of pensioners is growing faster than other macroindicators and wealth status can be estimated as reasonable, since there is a significant excess of pensions to the official subsistence minimum level. Futher we show how these conclusions match the data of sociological research.
3.2. Analysis of the panel data of the Tomsk region’s older generation.
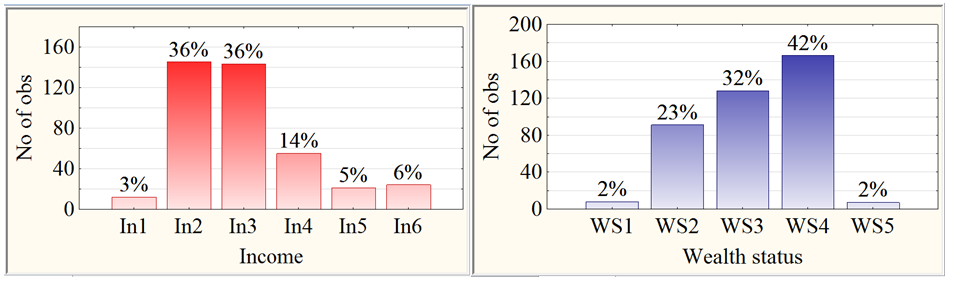
General distribution of respondents by wealth status and income is presented in Table
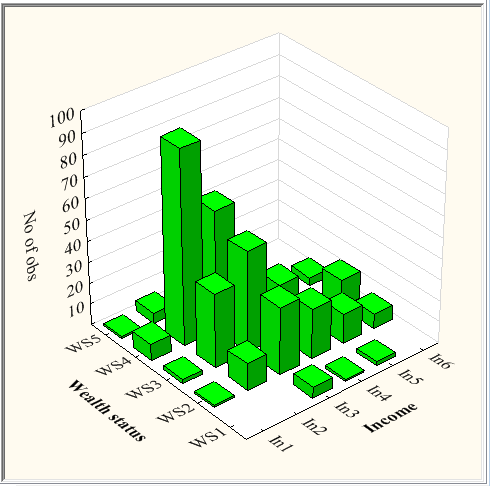
Data presented in Fig.
For correct use of parametric comparison criteria of empirical distributions of metric characteristics (income, age, etc.) we need to be convinced of their normal distribution (Figure
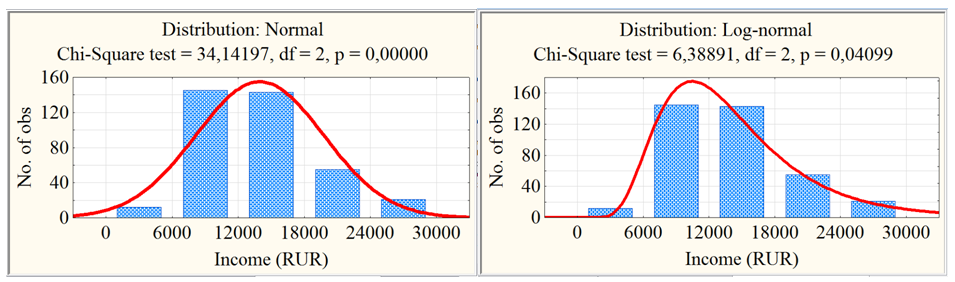
According to Fig.
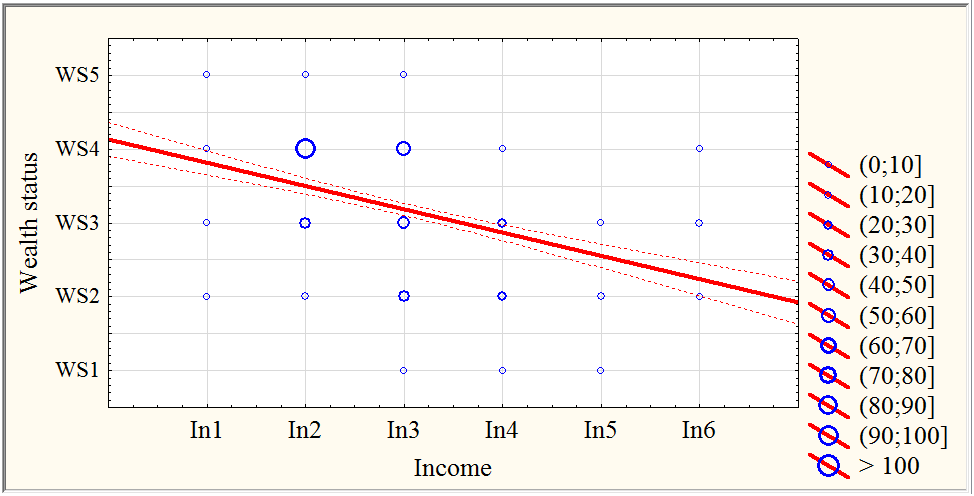
In these study target parameters are measured on an ordinal scale. The correlation for such variables can be determined on the basis of R Spearman statistics for rank variables. If the data contains many exactly the same values, Gamma statistics is preferable to R Spearman. We estimate the relationship between the two rank variables WS (wealth status) and In (income).
The relationship between the WS and In on the basis of the Chi-Square test can be regarded as highly relevant, since the chi-square statistics (≈117.2 and ≈126.4) is highly significantly different from 0 (at p ≈0.0000<0.0005), as evidenced by highly significant (at p≈0.0000<0.0005) difference from the 0 of the rank correlation coefficient R Spearman (≈-0,475), as well as a visible difference from 0 of the Gamma statistics (≈- 0.566).
Note that in case of 400 observations rank correlation coefficient R Spearman ≈-0.475 insignificant (at p ≈0.38>0.10) differs from the parametric Pearson correlation coefficient (r≈-0.424). That allows us to characterize highly significant association between WS and In (latent quantitative variables) by means of the linear regression equation:
WS = 4,1296-0,3157*In (1)
(r = -0,4241; p = 0,0000)
Graphically revealed regression dependence is shown in Fig.
Based on the study research, we make the following conclusions:
1. Most of the pensioners of the Tomsk region, who participated in the survey indicate the income per family member on the level of 6 thousand RUR up to 18 thousand RUR. Comparing these data with the size of pension in Russia and the Tomsk region, we see that these revenues coincide with the size of pensions for 2014.
2. 42% of the elderly in Tomsk region assesses their wealth status as an opportunity to regularly purchase food (WS4). Another 32% say that they can buy food and new clothes (WS3). 2% are below the poverty line (WS5). These three groups accumulated 76% of the respondents. In terms of economic reproduction a satisfactory level can be considered only from wealth status from WS2 (group WS2, WS1), in our sample it is only 24% of retirees. Yet it can be assumed that the income of the pensioner reaches the subsistence minimum at a level of simple reproduction (from WS3 of wealth status and above).
3. Identificated regression, on the one hand, confirms the dependence of the wealth status of from income, but, on the other hand, allows to predict how wealth status can change due to changes in income. The resulting regression equation and its graph (see Fig.
Conclusions
In this study, we compared the objective assessments of income and wealth status of pensioners (according to Rosstat) with subjective estimates obtained through questioning of the older generation in Tomsk region. These results demonstrate not only the comparability of subjective and objective parameters (in particular, the evaluation is comparable income) but also some clear differences. According to federal statistics, pension levels are significantly (1.6 times) higher than the subsistence minimum, and according to the survey 42% of pensioners can afford to buy only food. Thus the data of the panel studies suggest that the size of the subsistence minimum is too low.
According to the survey in order to achieve the minimum material conditions of WS3 ("I can buy food and new clothes") income (the average pension) pensioners must comply with In3, ie, in the range of 13 to 18 thousand rubles per month. This figure does not correspond to the average size of pensions in 2014, which amounts to 11-12 thousand rubles. Note also that in 2014 the negative trend of reduction of ratio of pensions to the subsistence minimum is already observed (Fig. 1). It can be further developed into a problem for the Russia in 2015 and on.
Thus, comparing the dynamics of pension and other income of the elderly population with the assessment of their own well-being, we can suggest that the current level of pension payments does not provide pensioners a normal existence level. The government can change this trend, either increasing pension payments, or stimulating the employment of retirees, which will raise the level of their income. Also the set of products included in the consumer basket and the subsistence minimum for pensioners needs to be revised.
Acknowledgements
The study was performed at the Tomsk Polytechnic University with the financial support of the Ministry of Education and Science of the Russian Federation in the framework of "Evaluation and improvement of the social, economic and emotional well-being of older people," the contract № 14.Z50.31.0029.
References
- Bekmurzaev I.D., Shamilev S.R. (2014).Pensions and Pensioners in the Russian Regions. Modern Problems of Science and Education. Sovremennie Problemy Nauki I Obrasovanija, 4, 406.
- Borovikov, V.P. (2003). Statistica. Art of a computer data analysis. St. Petersburg. 688 p.
- EuroStat (2011). EuroStat: Feasibility Study Well-Being Indicators: Critical Review. URL: http://ec.europa.eu/eurostat/documents/118025/118135/Feasibility_study_Well-Being_Indicators.pdf/2475816b-9e4f-44e4-9ebf-2cd05762df77
- Grjachenko, Т.V. (2015). The Main Problems of the Russian Pension System and Guidelines for Its Improvement. Labour and Social Relations. Trud i Socialnie Otnoshenija, 26 (1), 111-127.
- Misikhina, S. (2014). Standards of Living. The Economic Development of Russia, 21 (3), 43-45.
- OECD (2013). Pensions at a Glance 2013: OECD and G20 Indicators. OECD Publishing. DOI:
- OECD Regional Well-Being: A User’s Guide (2014). http://www.oecdregionalwellbeing.org/assets/downloads/Regional-Well-Being-User-Guide.pdf
- Rad N.S. (2014). Conceptualization of a Demographically Stable Model of the Pension System and Economic Activity of “Third Age” People: Interaction Context. Problems of Economy. Problemy Economiki, 3, 151-158.
- Spitsin, V., Mikhalchuk, A., Spitsina, L., Akerman, E., Tyuleneva, N., T., Semes, A., & Novoseltseva, D. (2015). Comparative Analysis of Salary, Labor Intensity and Payroll-Output Ratio of Foreign and Domestic Firms: Case Russian Vehicle Industry. Proceedings of the 2015 International Conference on Education Reform and Modern Management. doi:10.2991/ermm-15.2015.97. WOS:000366872700076.
- Spitsin, V., Mikhalchuk, A., Spitsina, L., Shabaldina, N, & Novoseltseva, D. (2015). Comparative Analysis of Economic and Social Results of Foreign and Domestic Firms: Case Russian Electronic Industry. Proceedings of the 2015 26th International-Business-Information-Management-Association Conference. INNOVATION MANAGEMENT AND SUSTAINABLE ECONOMIC COMPETITIVE ADVANTAGE: FROM REGIONAL DEVELOPMENT TO GLOBAL GROWTH, VOLS I - VI, 2015. WOS:000359821500097
- Whitehouse, E. (2008). Pension Panorama. Pension systems in 53 countries. Мoskow. 224 p.
Copyright information

This work is licensed under a Creative Commons Attribution-NonCommercial-NoDerivatives 4.0 International License.
About this article
Publication Date
17 January 2017
Article Doi
eBook ISBN
978-1-80296-018-1
Publisher
Future Academy
Volume
19
Print ISBN (optional)
-
Edition Number
1st Edition
Pages
1-776
Subjects
Social welfare, social services, personal health, public health
Cite this article as:
Spitsin, V., Mikhalchuk, A., Spitsina, L., Ryzhkova, M., Shinkeev, M., Shukina, A., & Shabaldina, N. (2017). Income and Wealth Status of Russian and Tomsk Region’s Pensioners. In F. Casati, G. А. Barysheva, & W. Krieger (Eds.), Lifelong Wellbeing in the World - WELLSO 2016, vol 19. European Proceedings of Social and Behavioural Sciences (pp. 658-665). Future Academy. https://doi.org/10.15405/epsbs.2017.01.87