
Typology of Innovative Development of AIRR-Regions (Association of Russian Innovative Regions)


Abstract
The article describes typology of regions of AIRR based on factor and cluster analysis. The main purpose of typology in this study is seeking for opportunities to transform interregional differentiation from problem into an additional source of development of regions with different complementary models of innovation development. It highlights 4 main and 2 additional types (subtypes) of regions of AIRR: Type 1 “Industrial innovation-active regions” (Subtype 1 “regions with developed medium-technological industries” and Subtype 2 “regions with developed high-technological industries”), Type 2 “Industrial regions providing demand for innovations (“market”), Type 3 “Regions with developed scientific-educational complex”, Type 4 “Mixed (catching-up)”. Peculiarities of different types of regions allow each region achieving an efficient innovative activity through complementarity of resources if each region fulfills its role, defined by type of innovative development. It makes actual the problem of development of mechanism of interregional innovation policy as one of the area of development of a synergistic approach in the state innovative policy.
Keywords: Typology of regionsAIRRfactor analysiscluster analysisANOVA
Introduction
Over the past two decades in the advanced economies it’s observed substitution of the closed model of innovation process by the open one (i.e. the model of open innovations), which is based on a synergetic approach (Burets, 2014). The state innovative policy based on the open model should not operate tools on alignment of the regions in terms of innovative development but should utilize the regional variety as an opportunity for innovative development (Akerman at al., 2010, 2015). In addition, the systems having heterogeneous components (dominant, supplementary, auxiliary and etc.) are adjusting better to the changing environment and have a greater sustainability.
In this regard, it’s significant for Russia to study innovative systems through the special frames concerning possibilities of interregional cooperation when forming an integrated innovative space from the subjects (regions) which are remote from each other.
Presently AIRR is the only precedent of self-organization of the regions in Russia (in industrial innovative aspect), that’s why this association was selected as an object of this study. Membership of regions in AIRR is a political position, expressing willingness to collaboration in the field of innovative activity and laying the foundation for innovative cooperation that defines interest of the state authorities of these regions in working out different mechanisms of such cooperation. Currently 14 regions are members of AIRR: Republic of Bashkortostan, Tatarstan, Mordovia Republic, the Altai Territory, the Krasnoyarsk Territory, the Perm Territory, the Irkutsk Region, the Kaluga Region, the Lipetsk region, Novosibirsk region, Samara region, Tomsk region, Tyumen region and the Ulyanovsk region.
The main purpose of the typology in this study is seeking for opportunities to transform interregional differentiation from problem into an additional source of development of regions with different complementary models of innovation development.
Materials and Methods of Study
18 indicators, given in table
The initial database was compiled on the basis of average values of indicators for each region for the period of 2010-2014 and was standardized. Multidimensional statistical methods were used in the present study: correlation, factor, analysis of variance (ANOVA) and cluster analysis. Statistical analysis was performed in STATISTICA 6 system (Electronic Statistics Textbook, 2013; Ayvazyan, & Mkhitaryan, 2001; Soshnikova, L.A. at al., 1999).
Matrix of Pearson product-moment paired correlation coefficient was calculated on the basis of standardized base. Correlation analysis of indicators of innovative development of regions of AIRR detected the significant (table
In view that significant correlation relation of different pairs of indicators are revealed, so when carrying out clustering of the indicators, correlation linkage distance (1-r Pearson) was used as distance measure of the indicators. Graphical results of cluster analysis of AIRR indicators for the period of 2010-2014 are presented in the dendrograms (Figure
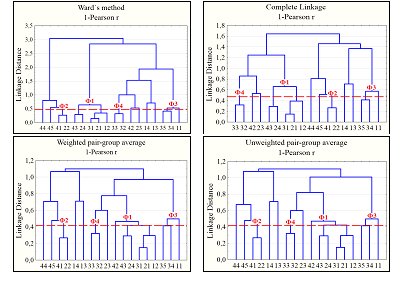
The advantage of cluster analysis is that it allows detecting not only highly significant paired correlations of the indicators inside the major groups but also significant (1 – r ≤ 1 – 0,576 = 0,424 is a critical value for group of 14 regions at level of significance of p=0,05; highlighted at fig.
By means of factor analysis 4-factors model of the indicators of innovative development of regions of AIRR is built (table
Content and economic interpretation of the factors is represented in table
For cluster analysis of innovative development of regions of AIRR the Ward’s method was selected as the amalgamation rule. The tree diagram shows regions which while “moving” rightwards are being combined and formed in groups (clusters). Depending on selection of the distance it’s possible to get the relevant quantity of regions which will be homogenous as per totality of 4 factors: F1, F2, F3 and F4. Along with method of tree-type clustering, K-means method, conducting classification of regions on the basis of set quantity of groups and enable assessing its quality within frames of dispersion analysis is used. Application of K-means method allows consolidating the regions in groups in order to minimize variableness inside the group and maximize variableness between them.
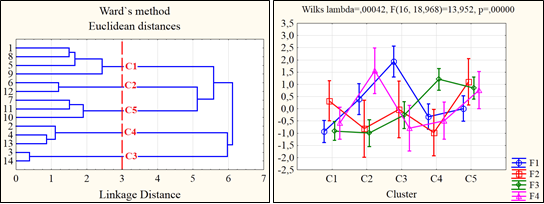
Assessment of significance of differences of the cluster averages in ANOVA is based on comparison of the component of dispersion due to range of variation between groups (Sbetween – sum of squared deviations of group averages from the total averages on AIRR or sum of squared deviations between groups), and components of dispersion due to range of variation within groups (SSbetween – sum of squared deviations of values of factor indicators for the regions (fig.3) from group averages or sum of squared deviations within groups). According to null hypothesis on equality of the averages of all groups the average dispersion between groups (SSbetween, divided by the relevant degree of freedom (degree of freedombetween)) will almost match with the average within groups (SSwithin, divided by degree of freedomwithin). The obtained average dispersions can be compared through F-test that checks whether the ratio of the average dispersion in between groups to the average dispersion within groups significantly more than 1. In the case under study (table
Within dispersion analysis (via method of multiple comparisons) the homogenous (which differs at the significance level of
F1: {C1, C4, C5, C2}, {C3}. Where C2 is statistically significant (0,005 <
F2: {C4, C2, C3, C1}, {C2, C3, C1, C5}. Where C4 is statistically significant (0,005 <
F3: {C2, C1, C3}, {C5, C4}. Where C5 is statistically significant (0,005 <
F4: {C3, C1, C4}, {C5, C2}. Where C4 is statistically significant (0,005 <
Results and their discussion
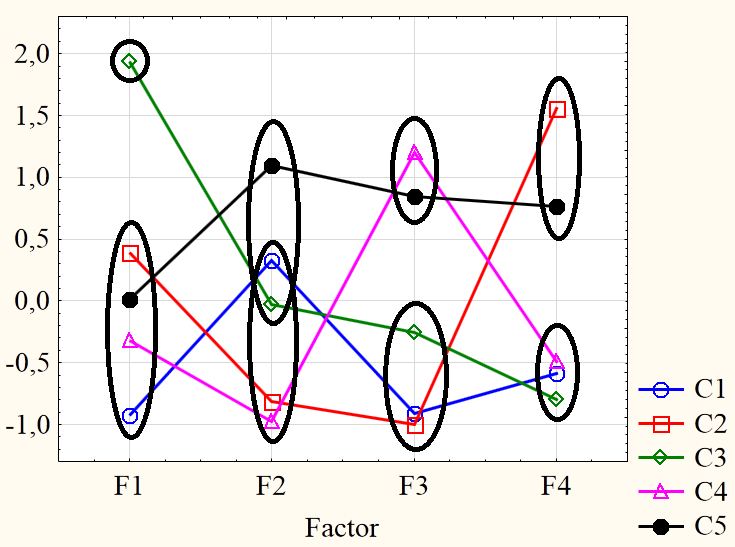
The carried out classification describes the structure of the cluster models of regions of AIRR in details, carrying out measurements of differences of 5 clusters in nominal scale based on totality of 4 factors. Based on results of clustering, 4 types of groups were identified at the level of 5-cluster model of regions of AIRR (table
Type 1 “Industrial innovation-active regions”
Subtype 1 “regions with developed medium-technological industries” (Republic of Tatarstan, Samara region, Perm Territory) they are leaders as per F2, F3, F4; “average performers” as per F1;Subtype 2“regions with developed high-technological industries” (Kaluga Region, Ulyanovsk region) they are leaders as per F1, “average performers” as per F2, F3, outsiders as per F4.
Under “high-technological” and medium-technological” are understood the industries according to methodology of Rosstat (www.gks.ru/metod/metodika_21.docx): high-technological – manufacture of pharmaceutical products, office equipment and computers, electronic components, equipment set for radio, television and communication of medical devices; measuring instruments, monitoring, control and testing; optical instruments, photographic and film equipment, aircraft planes including space vehicles.
The major source of generation of innovations is an industrial sector. Dominating are the innovative industrial enterprises which are distinguished by availability of their own high-capacity industrial base.
Main structures, dealing with research and development are specialized subdivisions of the enterprises. Developments are carried out according to market demand and are of applied nature thereby the probability of their mass production, sale and consumption at domestic and foreign markets is increasing (elements of model of innovative process G2 “pulling up by demand” are prevailing). They are generator and consumer of the innovations in one. Inputs of the results of innovative activity dominate.
Traditionally these are industrial regions the economy of which is based on production, automotive industry, power engineering, metallurgy, and other industries that require high production capacities).
Dominating are the industrial enterprises, which are dealing with their own generation of innovations to a small extent, but they ensure demand for them. Compared to regions of the first type they are not distinguished by high indicators of innovative activity and quality of scientific and educational complex. Inputs of the results of innovative activity dominate.
They are leaders in GRP per head and use of results of intellectual activity, they have low indicators of share in high-technological industries in GRP, expenditures rate on innovations, coefficient of inventive activity, share in innovative products in the total output, generation of the advanced production technologies.
The major source of generation of innovations is a scientific-educational complex. Dominating are small innovative enterprises at universities, scientific and research institutions, Special Economic Zone, based on advanced developments which do not involve the significant production capabilities. Main structures involved in R&D are universities, scientific and research institutions, Small Innovative Enterprises. Developments are carried out based on foundational scientific assumption (elements of model of innovative process G1 “technological push” are prevailing). This is a type with updated institution of intellectual property, high inventive and patent activities. Inputs of the results of innovative activity dominate. Leaders in share of innovation-driven enterprises among small enterprises, expenditures on foundational research, share of staff engaged in R&D in economically active population, level of development of scientific and educational complex (total score of the universities), coefficient of invention activity. They have low indicators on use of results of intellectual property in economics.
Conclusion
Thus, regions of AIRR have the objective economic preconditions for implementation of models of the open innovations in form of the complementary types of regions, identified on the basis of peculiarities of their innovative development. Advantages and disadvantages of different types of regions are mutual-leveling when looking at AIRR as a single subject of innovative activity; their peculiarities allow each region achieving an efficient innovative activity through complementarity of resources if each region fulfills its role, defined by type of innovative development. So, industrial regions have possibilities to attract breakthrough technologies, developments; regions with the developed scientific and educational complex have a stable product market for technologies being developed; catching-up (mixed) regions gain further possibilities for development. Such mutual interests and peculiarities of innovative development lay down foundation and are a precondition for implementation of models of the open innovation in AIRR. In view of this the problem of differentiation between regions in the field of innovation can be transformed into an additional source of regional development on the basis of formation of inter-regional innovation policy, the purpose of which is to strengthen and enhance the effectiveness of innovation in all regions on the basis of synergy of use of regional potentials. Development of mechanism of inter-regional innovative policy can further be researched with respect to development of synergetic approach in innovative policy.
Acknowledgements
This work was performed by the authors in collaboration with Tomsk Polytechnic University within the project in «Development of a model of cross-regional cooperation in innovative activities», RFH project number № 16-02-00492.
References
- Akerman, E.N., Mikhalchuk, A.A., & Burets, Yu.S. (2015). Clustering of regions of AIRR as precondition of forming interregional innovative policy. Tomsk State University Bulletin, 399, 175–182. (in Russian)
- Akerman, E.N., Mikhalchuk, A.A., & Trifonov, A.Yu. (2010). Typology of regions as an instrument of co-organization of the regional development. Tomsk State University Bulletin, 331, 126–131. (in Russian)
- Ayvazyan, S.A., & Mkhitaryan, V.S. (2001). Theory of probability and applied statistics. Moscow: YuNITI-DANA.
- Burets, Yu.S. (2014). Evolution of innovative process models. Tomsk State University Bulletin. Economics, 4, 125–139. (in Russian)
- Burets, Yu.S. (2014). Theoretical and methodological aspects of the open innovation approach: content, forms, instruments, model. Economics and Enterprise, 12-3, 705–711. (in Russian)
- Electronic Statistics Textbook. (2013). Tulsa, OK: StatSoft. Retrieved from http://www.statsoft.com/textbook/.
- Soshnikova, L.A., Tamashevich, V.N., Uebe, G., & Shefer, M. (1999). Multidimensional statistical analysis in economics. Moscow: YuNITI-DANA. (in Russian)
Copyright information

This work is licensed under a Creative Commons Attribution-NonCommercial-NoDerivatives 4.0 International License.
About this article
Publication Date
17 January 2017
Article Doi
eBook ISBN
978-1-80296-018-1
Publisher
Future Academy
Volume
19
Print ISBN (optional)
-
Edition Number
1st Edition
Pages
1-776
Subjects
Social welfare, social services, personal health, public health
Cite this article as:
Barysheva, G., Mikhalchuk, A., Burets, Y., & Novoseltseva, D. (2017). Typology of Innovative Development of AIRR-Regions (Association of Russian Innovative Regions). In F. Casati, G. А. Barysheva, & W. Krieger (Eds.), Lifelong Wellbeing in the World - WELLSO 2016, vol 19. European Proceedings of Social and Behavioural Sciences (pp. 57-66). Future Academy. https://doi.org/10.15405/epsbs.2017.01.8