
Modeling of Return on Pension Funds, Taking into Account Risk Factors and Impact on the Well-Being of the Older Generation


Abstract
The hypothesis that the well-being of the older generation can be improved by increasing the efficiency of pension savings investments into more profitable securities is proposed. A key factor, which increases the return on investment at a constant level of risk, is to diversify risk in the preparation of the portfolio. The well-being of older generations in terms of the need for optimum use of pension savings is considered. Four types of securities with different levels of risk and return, which theoretically can be invested pension funds are taken for analysis. Opportunities for investment securities in the simple and expanded portfolios are determined on the basis of existing legislation. Portfolios with different risk levels are compared. The principle of diversification is used. The curve of return and risk of various possible investment portfolios is simulated. The study is based on statistical methods. The opportunities for investing pension savings in securities with a higher level of profitability while maintaining a constant risk is demonstrated. The study focused on the revision of legislation in the field of investments of the pension funds of the Russian Federation in the stocks and bonds of Russian companies.
Keywords: Pension fundsratio of riskprofitabilitywellbeingsecuritiespension savings
Introduction
The most important indicator of socio-economic development of the state is the age structure of the population. One of the trends of modern society is the demographic aging of the population, causing shifts in the nature of human reproduction, as well as, in part, the migration. As a result of increasing the proportion of older people in the total population structure of the economically active population changed. This in turn has an impact on payments to non-budgetary funds, in particular the Russian Pension Fund, which are not commensurate with the required annual cash payments to non-working citizens of pensions. In the present situation there are two solutions: increase the retirement age, which is impossible for a number of categories of citizens, and to increase the base for pension benefits. As a result, all the more urgent problem is the efficient and optimal use of available funds received in private pension funds and the Pension Fund of Russia. Within the framework of cash management operation strategy includes obtaining the optimal balance between risk and required rate of return. The main task of economic analysis is the prediction of the required amount of payments, the calculation of the desired level of profitability, the composition of an optimum portfolio with an acceptable level of risk. Thus, it’s necessary to effectively invest in the possible risk of shares owned by the investment portfolio.
The purpose of research is to build a model that demonstrates the well-being of older people through the effective use of savings pension funds. The effectiveness of investments is achieved through risk management losses by investing in establishing the necessary level of profitability.
Investigation of possible investment portfolios for pension savings
Under Russian law the State Management Company is empowered to effectively manage incoming funds of the Pension Fund of the Russian Federation. The Management Company produces two investment portfolios: advanced investment portfolio and the investment portfolio of government securities. State Management Company invests in an effort to ensure their growth with minimal risk and respecting the absolute priority of the interests of insured persons.
The SMC is managing two portfolios to effectively invest the citizens in various financial instruments. By default, funds are allocated to the extended investment portfolio, which can provide more stable rates of return. However, citizens can independently apply to the Russian Pension Fund about the choice of government securities portfolio, guaranteeing a higher level of reliability.
July 18, 2009 The Federal Law № 182-FZ "On Amendments to the Federal Law "On Private Pension Funds" and Federal Law "On investment funds for the funded part of labor pensions in the Russian Federation" came into force. According to the law State management company functions which currently performs "Vnesheconombank" (SMC) is investing pension savings of citizens in the two investment portfolio.
The basic portfolio includes state securities of the Russian Federation, corporate bonds of Russian issuers guaranteed by the Russian Federation. The extended portfolio includes state securities of the Russian Federation, corporate securities of Russian issuers, guaranteed by the Russian Federation, bank deposits in rubles and foreign currency, mortgage-backed securities, bonds of international financial organizations.
Pension funds, held in trust by the GAM, are divided into two portfolios: the default option (extended investment portfolio) and the conservative option (investment portfolio of government securities) - for insured persons who wish to restrict investments in government securities.
In the extended investment portfolio funds are collected only those citizens who have not voted in favor of the method of investing the funds received for them from employers' contributions. asset management strategy depends on the type of portfolio and the restrictions imposed on each of them. Conservative investment portfolio involves embedding savings exclusively in government securities and bonds of Russian issuers - securities with the lowest share of the risk. Advanced portfolio allows investments in securities of international financial institutions - not more than 20%, mortgage securities - not more than 20%, government bonds are not secured by state guarantees in the amount of not more than 40%. Private management companies, in turn, may also invest in shares of Russian issuers.
Thus, the main objective of this study is to establish effective and the most favorable possible areas of investment of the accumulated funds, taking into account the risk to increase the rate of return.
The four indicators, which are regularly provided by the Moscow Stock exchange, with varying degrees of risk and return have been chosen as the primary data. The first group is the MICEX Index, which includes prices of the market capitalization of the most liquid stocks of the largest and most dynamically developing Russian companies (Gazprom, Aeroflot, VTB, Sberbank, and others). The MICEX Index is a effective capitalization weighted index which is composed of the most traded shares of Russian companies admitted to trading on the MICEX Stock Exchange. The second group of securities is government bonds of the federal loan, which are state registered coupon securities with maturity of over 1 year and entitling the holder to receive interest income accrued to the nominal value of the bonds, and the principal amount payable at maturity of federal loan bonds. Investments in them are the most risk-free. The third element is the index of the second tier, which is the price of the shares of Russian companies not included in the MICEX index. Shares of the second-tier securities represented less well-known companies. The volume of trading in shares of the second echelon is much lower than the blue chips, but is at a sufficient level; the investor can sell or buy the necessary amount of securities. The fourth group covers the corporate bond index with a maturity of 3-5 years. The study did not take into account the accumulated coupon income, so all indexes are taken on the basis of the calculation of "net price", which reflect the change only the value of securities. The choice of these four parameters to calculate is due to the possibility of diversification of risk in preparing portfolios, different levels of profitability, available sources of information and the period of their existence (Aksyonova, & Barysheva, 2016).
MICEX index
The diagram (Fig. 1) shows the dynamics of changes in the level of profitability of the securities with the greatest degree of liquidity in the period from 1997 to 2015. On the basis of these data, calculated indicators of risk of investments in securities - standard values scatter in the Statistics ( variance and standard deviation δ). The dispersion of the yield of the securities is a measure of dispersion, which describes the deviation between the comparative values of the yield of the securities and the average value. The economic crises of 1998 and 2008 have resulted in a significant drop in stock prices. The sharp jump in 1999 may be due to the development of business in the economy (telecommunications and IT-technologies).
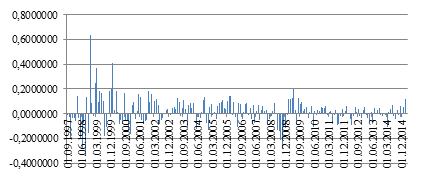
The variance and standard deviation on the MICEX index are showed in the table below. The deviation from the expectation of the most liquid stocks of Russian issuers is 154.017%, indicating a high degree of yield spread level of risk, which in turn is a kind of payment for high returns.
The index of the state of the federal loan bonds
Federal loan bonds are registered government securities, issued in documentary form with mandatory centralized custody, the issuer is Ministry of Finance. Federal loan bonds treatment periods can be long-term or medium-term. Bondholders may be Russian and foreign legal entities and individuals. General service agent of FLB is the Central Bank of the Russian Federation. The graph below shows the dynamics of the rate of return of government bonds in the period from 2012 to 2015 (as a percentage of the value of the bond). Political reasons, as well as the depreciation of the ruble, were influenced by the sharp fall in the value of federal loan bonds in 2014 (Barysheva et al., 2016).
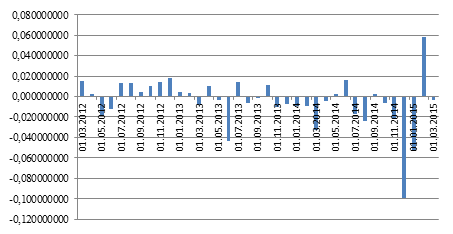
The hypothesis, that the federal loan bonds are the most risk-free securities is supported by the calculation of standard statistical indicators - the variance and standard deviation. In the table below the indicators of volatility OFZ expected return are calculated. The deviation from the expectation of return is 14.9%, which is almost 10 times less than the standard deviation calculated for the MICEX index. Thus, the risk of loss of investments will be diversified when the preparation of a portfolio of common shares of Russian issuers and federal loan bonds.
The second tier
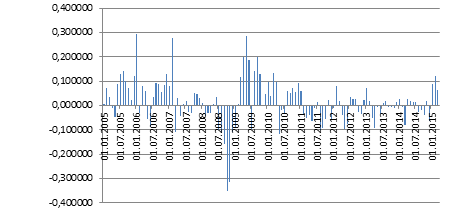
The graph of the rate of return on the securities of the "second tier", not included in the list of the most liquid stocks of Russian issuers, is represented below for the period from 2005 to 2015. The standard statistics (variance and standard deviation) characterize the second-tier stocks as the most risky investments. Thus, the expected average yield is 103.6% deviation, indicating a high degree of risk. At that, yield of 17% is the highest rate of return on the securities market, as there is a significant charge for risk (Barysheva et al., 2016).
Index of corporate bonds with a maturity of 3-5 years
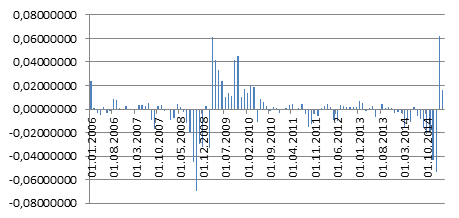
The yield corporate securities with a maturity of 5 years is 3.16%, which varies in the range of 19%, indicating that a sufficient stability and small economic benefit. Below there is a graph of the change in the period of long-term corporate bond index yields from 2006 to 2015. The crises of 1998 and 2008 had an impact on the stability of the index, as indicated by the significant fall of the index in the respective periods. The sharp jump in 1999 is due to the development of business in the economy (telecommunications and IT-technologies).
After calculating the standard statistical indicators for the four indexes, they can be arranged in ascending level of riskiness of investments of pension funds:
state federal loan bonds
corporate bonds with a maturity of 3-5 years,
shares "second tier"
ordinary shares.
Due to the fact that the indices are calculated at different times, according to the calculations ordinary shares were riskier than securities of "second tier", which is contrary to current opinion.
Financial managers claim that diversification reduces the securities portfolio risk. Diversification of risk is the process of redistributing money among different investments that are not related on any criteria objects. This process allows avoiding a certain part of the losses, if we can intelligently allocate investments between targets, leading the activities of different kinds. Securities with the lowest coefficient of the absolute value of the correlation are more interesting. So even a slight diversification, for example, between the two types of securities, can significantly reduce the risk.
It is necessary to make all possible portfolios, calculate for each standard statistics (variance and standard deviation), to construct a curve depending on the amount of risk of the portfolio securities in the portfolio. In this case, we investigated various combinations of the four types of securities with different levels of risk premiums. In our study, each portfolio is made up of an equal share of the securities (Masaya, & Atsushi, 2014).
where 1- most liquid shares dynamically developing Russian companies (MICEX index);
2 - government bonds, federal (government bond index);
3 - shares of Russian companies unrelated to the most liquid (The second tier);
4 - long-term corporate bonds with a maturity of 3-5 years (index of corporate bonds).
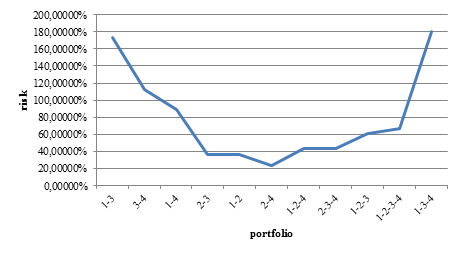
This confirms the fact of reducing the risk of the investment portfolio in its diversification. This effect is achieved because of the portfolio value of shares and bonds are independent of each other and the same event will not affect both securities simultaneously. The statistics say that changes in stock prices are characteristic of an imperfect correlation. Lower prices for some securities are offset by an increase in prices of other changes when comparing with the profitability of ordinary shares which have high volatility of this indicator, and government bonds, which are relatively stable in the changes.
Risk, which can be adjusted by diversification, is the individual risk. He represented the result of certain situations on the market that have an impact on certain companies, therefore, for a certain type of securities. Our study is based only on the elimination of individual risk. Market risk, which is associated with general economic situation, cannot be eliminated through diversification of the portfolio (Iremadze, & Kulinich, 2013).
The chart (Fig.5) illustrates a situation of reducing the standard deviation when a combination of two securities. The lowest risk is achieved by compiling a portfolio of common shares and federal loan bonds. With that, the risk is at a minimum level, investments in this portfolio are quite profitable, which is achieved due to the high profitability of the ordinary shares. However, a portfolio risk begins to increase again when the number are raised more. At some point, some decrease in the yield of the securities cannot be compensated by an increase in the yield of others. It is possible to introduce the concept of limiting the level of risk. In this case, a graph is similar to the graph of the marginal cost of economic theory. The optimal point is the point where the minimum risk.
Determining the level of risk and return is equal weighted portfolio
Modern portfolio theory was formulated by Markowitz. According to this theory the risk of assets is considered as constituting a single risk portfolio rather than individual units. The important point, therefore, is the account of the mutual correlations between the yields of the portfolio assets. This consideration allows for efficient portfolio diversification, leading to a significant reduction in its risk compared with the risks of individual portfolio assets. At the theory of diversification by Markowitz there is the idea of a combination of securities that are less than positive correlation in order to reduce the risk without reducing the expected return. This means inclusion in the portfolio securities, which rise in price, while the others fall. Next, it’s necessary to calculate the effect of a particular type of risk securities in the portfolio as a whole to determine their optimal amount.
Suppose that the portfolio contains 25% of each class of securities (equally weighted portfolio). Thus, the yield of the investment portfolio is:
Portfolio yield = (15.2705+3.1127+17.19+3.1634)*25%=9.68%
However, the standard deviation of the total portfolio cannot be calculated as a weighted average of deviations of certain types of securities, because the prices of stocks and bonds vary differently (Tchigirinskaya et al., 2015).
The risk of the total portfolio is calculated on the basis of the matrix of variances of certain types of securities. The total variance of the securities portfolio is equal to the sum of the values of the matrix elements. In general, the dispersion is equal to the product yield securities and their standard deviation..
Where - yield of a certain type of securities;
- covariance of yield of securities i and j;
– correlation of securities i and j;
– deviation of securities i.
Covariance is the measure of the variability of joint two types of securities. It is determined by multiplying the correlation coefficient on the standard deviations of specific types of securities. Covariance is a measure that takes into account the dispersion of the individual values of the securities yield and strength of the connections between changes in the yield of this paper and others. A more simple definition of covariance is a measure of the interaction between two random variables (Ronova, & Yakovlev, 2011).
Below there is a matrix of dispersions with equally weighted shares of the analyzed securities.
In this case, the dispersion of the portfolio is:
Thus, the risk of the portfolio's value is defined . The yield of the portfolio is 9.68%.
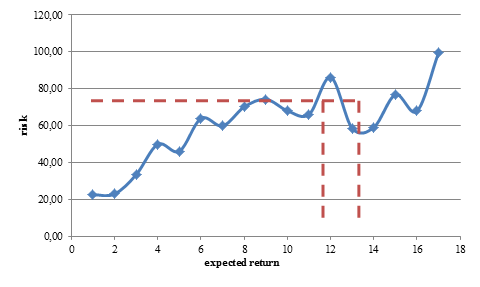
The figure is based on the risk curve of expected returns achievable with different combinations of stocks and bonds. The x-axis represents the expected yield of the portfolio, the vertical axis - the expected level of risk.
Conclusion
This graph illustrates the situation in which the two portfolios with the same risk level may have different yields. Speaking about the optimal balance between profitability and deviation, maximum profitability is obtained by moving the graph to the right and down while reducing risk. The aim of the investor is allocating funds, in this case, the accumulation of the Pension Fund, so as to get the greatest return at an acceptable risk level. Confirmation of the set hypothesis is that one risk level may correspond to different levels of profitability that reaches in the preparation of a more profitable portfolio.
The dotted line shows the possibility of obtaining higher yields of the securities portfolio while maintaining risk at a constant level. It is optimal to achieve a return of 14.6% than the yield of 12.5% for the same degree of risk (Platonova, & Panina, 2015).
This model is not entirely perfect, as obvious is the fact that it is impossible to invest pension funds to the high-risk assets. However, it is an example of the possibility of drawing up an investment portfolio with a higher yield for a given level of risk. Further research it is necessary to take into account all the possible assets for investments.
Moscow stock exchange indices has calculated yield for different investment strategies of using of pension savings. Since the beginning of 2015 the conservative strategy would yield 4.91%, a balanced portfolio - 7.28% and aggressive - 10%. The degree of return is proportional to the share of funds invested in shares of Russian companies. It was shown above, even stocks of dynamic developing companies have a high level of risk. In order to find the optimal value of risk and return, you can use the above model analysis (Kundakchyan, & Zulfakarova, 2013).
Acknowledgements
This research was performed by the authors in collaboration with Tomsk Polytechnic University with financial support of the Science and Education Ministry of the Russian Federation within the project in Evaluation and enhancement of social, economic and emotional wellbeing of older adults under the Agreement No.14.Z50.31.0029.
References
- Aksyonova, Y.V. & Barysheva, G. A. (2016). The Optimum Ratio of Risk and Return Accrued Pension Funds as a Factor of Influence on the Well-Being of the Older Generation. The European Proceedings of Social and Behavioural Sciences. 7. 366-375.
- Barsukov, V.N. (2015). On the question of raising the retirement age in Russia. Problems of development of the territory. 5(79). 111-124.
- Barysheva, G.A., Filippova, T.V., Baryshev, A.A., Aksyonova, Y.V. (2016). Modeling Regional Elderly Employment Due to Seasonal Fluctuation in Tomsk Region. Proceedings IBIMA. 7. 3738-3746.
- Iremadze, E.O. & Kulinich, O.V. (2013). The econometric model of the Russian economy. Applied sciences in Europe: tendencies of contemporary development. 236-241.
- Kundakchyan, R.M. & Zulfakarova, L.F. (2013). Econometric modeling of performance indicators of the companies. World Applied Sciences Journal. 10. 1307-1311.
- Masaya, Y. & Atsushi, M. (2014). Fertility rate and child care policies in a pension system. Economic Analysis and Policy. 122-127.
- Moscow Exchange Indices. (2015). Retrieved from http://moex.com/ru/indices
- Platonova, I.V. & Panina, M.G. (2015). An econometric model of the Russian Federation in terms of quality of life. Bulletin of the Moscow City Pedagogical University. 1. 58-70.
- Ronova, G.N. & Yakovlev, A.Y. (2011) Pension funds, insurance companies and individuals as potential investors are infrastructure funds in Russia. Economics, Statistics and Informatics. 2. 112-117.
- Tchigirinskaya, N.V., Tchigirinsky, Ju.L. & Chesnokov O.C. (2015). Spreadsheet as tool for econometric modeling. SWorldJournal. 1(8). 101-105.
Copyright information

This work is licensed under a Creative Commons Attribution-NonCommercial-NoDerivatives 4.0 International License.
About this article
Publication Date
17 January 2017
Article Doi
eBook ISBN
978-1-80296-018-1
Publisher
Future Academy
Volume
19
Print ISBN (optional)
-
Edition Number
1st Edition
Pages
1-776
Subjects
Social welfare, social services, personal health, public health
Cite this article as:
Aksenova, Y., & Kats, V. (2017). Modeling of Return on Pension Funds, Taking into Account Risk Factors and Impact on the Well-Being of the Older Generation. In F. Casati, G. А. Barysheva, & W. Krieger (Eds.), Lifelong Wellbeing in the World - WELLSO 2016, vol 19. European Proceedings of Social and Behavioural Sciences (pp. 7-17). Future Academy. https://doi.org/10.15405/epsbs.2017.01.2