
Insights Into Portuguese Stock Market Efficiency Using DEA


Abstract
US subprime crisis and the European sovereign debt crisis affected indiscriminately both the economic and the financial sectors giving rise to a bank run which made the survival of many other banks became uncertain, and by contagion the equity markets tumbled. In this context, this study runs a Data Envelopment Analysis model to analyse individual market return and net sales in light of the interest income, depreciation, cost of goods and employees. Using data from the largest companies of the Portuguese index stock market, the results showed that energy, communications and banking are the sectors more prevalent regarding revenue efficiency.
Keywords: Data Envelopment AnalysisPSI20EfficiencyStock Market Portfolio
Introduction
The recent global financial crisis that started in the United States, the largest since the 1930s recession, spread all over the world and indiscriminately adversely affected economic and financial sectors. The financial sector is frequently under stress for different reasons such as economic volatility, predictability, speculation and anomalies not always controllable or expectable. The stress factors and their consequences cause inevitable uncertainty in the stock markets. However, the uncertainty about the economy’s state is unobservable and therefore difficult to quantify but it shuffles the investors’ decisions on their portfolio selection. Notwithstanding, the stock market provides clear and updated indicators of investors’ reaction to the financial stress.
Stock market dynamics is a central issue to optimal portfolio allocation, hedging strategy and policy regulatory actions. This issue has also received attention from academics, given the observed complex behavior of stock markets over the time. As detailed by Omisore
In essence, the analysis of a stock market’s efficiency can enhance the ability to predict future security price movement and then use such predictions to design equity portfolios. Eugene Fama (Fama, 1970) was a pioneer with his formulation of the efficient market hypothesis (EMH) which constituted an issue with special interest within the financial market’s researchers. Being a topic widely discussed in the literature since then, the EMH was approached by different authors and methodologies (e.g. Schartzberg & Reiber, 1992; McMillan, 2005; Todea & Plesoianu, 2013). From a methodological perspective a substantial number of literature documented two distinct approaches, namely: the parametric Stochastic Frontier Analysis (SFA) and the nonparametric Data Envelopment Analysis (DEA). The SFA of Aigner
The DEA methodology however, is the most used approach when analyzing efficiency mostly due its capacity to evaluate technical performance utilizing price-free input/output data. The introduction of this methodology in financial markets is more recent. But it is quite understandable the interest in generate an efficient frontier against with each company reaches an efficiency score comparable with its competitors in study (e.g. Chen, 2008; Lopes et al., 2008; Singh et al., 2009; Wang et al., 2010; Lim & Zhu, 2014). In Portugal, the use of this technique applied in the stock market context is hardly any and not very recent. Only two authors focused this theme (Duque & Madeira, 2004; Nascimento, 2007).
The purpose of the present study is to perform a comprehensive measurement of the twenty largest companies’ revenue efficiency levels (forming part of the Portuguese index stock market - PSI20) since its foundation. In order to accomplish that, a generalized output-oriented DEA model was applied to several variables (interest income, depreciation, cost of goods, number of employees and net sales) of each individual PSI20’s company.
Estimation of the PSI20’s efficiency
The twenty largest companies of the Portuguese Stock Index (PSI20)
The PSI20 is the main index of Euronext Lisbon. It is the main benchmark of the Portuguese capital market and it is composed by the shares of the twenty highest ranking companies of the free float market capitalization. Eligible companies must fulfill a value of €100 million corresponding to the velocity threshold and the minimum free float stablished. The baseline value of 3000 points to the PSI20 was settled in December 31 of 1992. The PSI20 was launched with a dual purpose: firstly, to serve as an indicator of the evolution of the Portuguese equity market, and secondly to provide support for and for contract trading and options’ analysis.
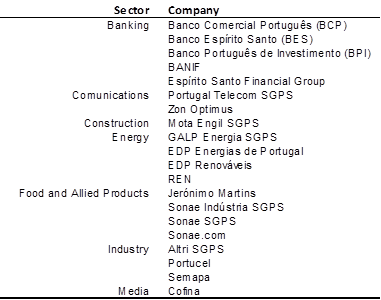
The companies that forming the PSI20 are grouped into seven economic sectors namely: banking, communications, construction, energy, food and allied products, industry and media (Table 1).
The panel data defined to undertake the efficiency analysis considered the individual market return and the net sales as output variables, and the interest income, depreciation, cost of goods and number of employees, as input variables. The choice of this variables was based on the data availability. The time window analysed comprised daily observations from the first of January of 1993 to the last of December of 2013 (Datastream database available online).
The DEA model with an output orientation proposed in this study to measure the individual (DMU) revenue efficiency (RE) follows (Färe et al., 1985):
For the
The DEA model (1) were estimated using the MaxDEA Pro 6.2 software (Gang & Zhenhua, 2011).
Empirical results
In this paper, we proposed a DEA approach for assessing the revenue efficiency of the companies which form the main Portuguese stock market index (PSI20).
Hereafter, we present the revenue efficiency accurate by company, economic sector and year (Tables 2-4) followed by some relevant considerations.
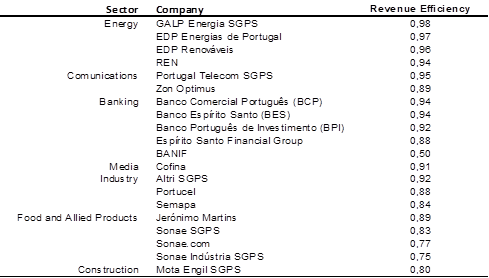
Regarding the DEA model applied (1), the revenue efficiency of all companies (excepting the BANIF bank with 0.50) achieving mean scores above 0.75, on a scale between 0 to 1 (Table 2).
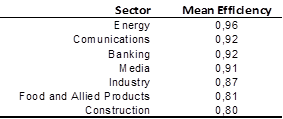
The achieved results revealed that the energy sector was the most prevalent in revenue efficiency during the twenty years analysed, reaching a mean score of 0.96 (Table 3). Closely followed by the communications and banking sectors in ex aequo with a mean score of 0.92 (Table 3).
The analysis by company (and consequently by sector) denotes that, within the PSI20 companies, the food and allied products and the construction companies are the less efficient from a revenue perspective (Tables 2 and 3). In opposition, the more efficient companies were GALP Energia SGPS and EDP Energias de Portugal, achieving mean scores of 0.98 and 0.97 respectively.
Considering the economic scenario of Portugal the results are consistent from the authors’ perspective. In fact, as it would be expected, sectors such as industry, food and allied products and construction were the most affected by the economic contraction due to stablished crisis (clearly sectors that reveal the sensitivity to the purchase power of the families).
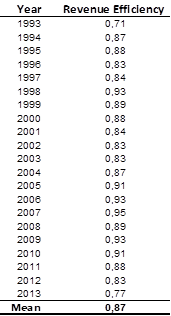
The analysis by year (Table 4) does not seems to bring any further enlightening to the discussion, being the least score related to the primary year of the record of PSI20 foundation. Nonetheless, from the mean revenue efficiency achieved by year (Table 4), three important periods of economic tension can be identified.
The Asian financial crisis in 1996-97. In fact, when the crisis started to settle in January 1998 the stock markets in many of these Asian states had lost over 70% of their value. Also, their currencies had depreciated against the US dollar by a similar amount, and the once proud leaders of these nations had been forced to go cap in hand to the International Monetary Fund (IMF) to beg for a massive financial assistance. Consequently, the most important Portuguese enterprises were affected by a continuous contagion phenomenon process. Second, the Iraq and Afghanistan invasion in 2001 made with the participation of Portuguese military with direct implications on the business performance. Next, the subprime crisis in the US housing sector which associated with consumer credit and all effects to the whole financial market.
Finally the Troika in 2011 and as expected, since their intervention in the country, the PSI20 has fallen.
This slowdown can also be explained by the general slowdown in both European Union (EU) and United States of America (USA) economies, due to the deleveraging of the whole economy and the sovereign debt crisis of Eurozone. Finally, two important events were the Japanese recession and the instability in the Middle East (with an impact on the price of commodities), but whose effects are should blurring in 2012. Nonetheless, the year 2013 was the most problematic for the euro area since the financial crisis in 2008, also corresponding in the present study to the lowest revenue efficiency score since the PSI20 index establishment (1993).
Conclusions
In the present analysis, it was assessed and discussed the revenue efficiency estimation of the PSI20 companies throughout the twenty years’ period (1993-2013) of its existence. To accomplish that a generalized output-oriented DEA model was applied to analyse individual market return and net sales in light of the interest income, depreciation, cost of goods and employees. The results highlighted the energy sector as the most prevalent in terms of mean revenue efficiency throughout the analysed time window. Communications and banking were sectors also well represented regarding revenue efficiency, with the exception of BANIF bank (not surprisingly, since it was already financial assisted). Sectors such as industry, food and allied products and construction were the most affected, achieving the lower revenue efficiency scores, inferring also that these sectors were the most exposed to economic crisis.
The analysis by company confirmed that both energy and communications sectors had more companies used as benchmarks.
It would be possible to predict a company crisis based on its revenue score, considering that the lowest revenue efficiency score achieved belonged to a company (BANIF bank) which needed financial assistance recently? If so, what are the next issues of concern in the PSI20 portfolio? Actually, it is difficult to answer these questions without further analysis.
To future analysis, it would be also interesting to extend the present framework to analyze cross-country stock market revenue performances.
References
- Aigner D.J., Lovell C.A.K. and Schmidt, P. 1977. Formulation and estimation of stochastic frontier production function models. Journal of Econometrics, 6: 21-37.
- Amess, K. and Girma, S. 2009. Do Stock Markets Value Efficiency? Scottish Journal of Political Economy, 56: 321–331.
- Chen, H.H. 2008. Stock selection using data envelopment analysis. Industrial Management and Data Systems, 108: 1255–1268.
- Das, A. and Kumbhakar, C.K. 2012. Productivity and Efficiency Dynamics in Indian Banking: An Input Distance Function Approach Incorporating Quality of Inputs and Outputs. Journal of Applied Econometrics, 27, no. 2: 205-234.
- Duque, J., and Madeira, G. 2004. Effects associated with index composition changes: evidence from the Euronext Lisbon stock exchange. Working paper, ISEG, Technical University of Lisbon.
- Fama, E. 1970. Efficient Capital Markets: A Review of Theory and Empirical Work. Journal of Finance, 25, no. 2: 383-417.
- Fare R, Grosskopf S., and Lovell C.A.K. 1985. The Measurement of Efficiency of Production. Kluwer-Nijhoff Publishing, Boston.
- Fiorentino, E., Karmann, A. and Koetter, M. 2006. The cost efficiency of German banks: a comparison of SFA and DEA. Deutsche Bundesbank Discussion Paper Series 2, 10/2006.
- Gang, C., and Zhenhua, Q. 2011. MaxDEA Manual. Peking University, Beijing.
- Habib, M. and Ljungqvist, A. 2005. Firm value and managerial incentives: A stochastic frontier approach. Journal of Business, 78: 2053-2094.
- Lim, S., Oh, K.O. and Zhu, J. 2014. Use of DEA cross-efficiency evaluation in portfolio selection: An application to Korean stock market. European Journal of Operational Research, 236, no. 1: 361-368.
- Lopes, A., Lanzer, E., Lima, M. and Newton da Costa, J.R. 2008. DEA investment strategy in the Brazilian stock market. Economics Bulletin, 13, no. 2: 1-10.
- McMillan, D.G. 2005. Non-linear dynamics in international stock market returns. Review of Financial Economics, 14: 81-91.
- Meeusen, W. and van den Broeck, J. 1977. Efficiency estimation from Cobb-Douglas production functions with composed error. International Economic Review, 18: 435-444.
- Muradoglu,Y.G. and Sivaprasad, S. 2013. The effect of leverage mimicking portfolios in explaining stock returns variations. Studies in Economics and Finance, 30, no. 2: 94-107.
- Nascimento, V. 2007. Eficiência Informacional do Mercado de Acções: O Caso Português, Master’s Dissertation, Faculty of Economics, University of Porto.
- Nguyen, G.X. and Swanson, P.E. 2009. Firm Characteristics, Relative Efficiency, and Equity Returns. Journal of Financial and Quantitative Analysis, 44: 213-236.
- Omisore, I., Munirat, Y., and Nwufo, C. 2012. The modern portfolio theory as an investment decision tool. Journal of Accounting and Taxation, 4, no. 2: 19-28.
- Pawlina, G. and Renneboog, L. 2005. Is Investment-Cash Flow Sensitivity Caused by Agency Costs or Asymmetric Information? Evidence from the UK. European Financial Management, 11: 483–513.
- Schatzberg, J.D., and Reiber, R.P. 1992. Extreme negative information and the market adjustment processes: the case of corporate bankruptcy. Quarterly Journal of Business and Economics, 31: 3-21.
- Singh, A.K, Sahu, R., and Bharadwaj, S. 2009. Portfolio Evaluation using OWA-Heuristic Algorithm and Data Envelopment Analysis. Journal of Risk Finance, 11, no. 1: 75-88.
- Todea, A., and Plesoianu, A. 2013. The influence of foreign portfolio investment on informational efficiency: Empirical evidence from Central and Eastern European stock markets. Economic Modelling, 33: 34-41.
- Wang, M. and Chin, K.S. 2010. Some alternative DEA models for two-stage process. Expert Systems with Applications, 37: 8799-8808.
- Yu, W., Xu, X., Wang, Y., Zhang, B, Liang, L. and Zhongsheng, H. 2007. Predicting corporate financial distress based on integration of support vector machine and logistic regression. Expert Systems with Applications, 33, no. 2: 434–440.
Copyright information

This work is licensed under a Creative Commons Attribution-NonCommercial-NoDerivatives 4.0 International License.
About this article
Publication Date
30 November 2016
Article Doi
eBook ISBN
978-1-80296-016-7
Publisher
Future Academy
Volume
17
Print ISBN (optional)
-
Edition Number
1st Edition
Pages
1-471
Subjects
Business, management, behavioural management, macroeconomics, behavioural science, behavioural sales, behavioural marketing
Cite this article as:
Ferreira, N. B. (2016). Insights Into Portuguese Stock Market Efficiency Using DEA. In R. X. Thambusamy, M. Y. Minas, & Z. Bekirogullari (Eds.), Business & Economics - BE-ci 2016, vol 17. European Proceedings of Social and Behavioural Sciences (pp. 367-373). Future Academy. https://doi.org/10.15405/epsbs.2016.11.02.33