
Investigating The Relationship Between Students’ Performance And Engagement In Online Learning Platform


Abstract
The use of technology and online learning platform have become an essential in teaching and learning environment in all levels of education including higher learning. Various learning activities could be designed, implemented and deployed in online learning platform which can integrate multi-media contents, interactions, repositories, feedbacks and etc. Students’ engagement with the online learning activities can be one of the success factor to students’ performance or learning achievement. This paper presents the implementation of online learning environment onto a course using Learning Management System (LMS) Brighten, extract students’ engagement data from the LMS via the logs reports and analyse the results with the aim to investigate the relationship between students’ performance and the Brighten learning activities engagement. Although the initial analysis does not show a conclusive relationship between the two, further analysis by grouping the engagement levels into low-, medium- and high-engagement levels indicates that the high-engagement group performed better on average compared to the low- and medium-groups.
Keywords: Students’ performance, engagement, learning activities, learning management system
Introduction
Student engagement is important in teaching and learning. It is viewed as closely related to students’ performance. It is often said that students who are more engaged with class learning activities will lead to having better result in their course. According to research, Orji and Vassileva (2020) stated that “student engagement involves the degree of passion, interest and attention that they exhibit in their educational environment”. Participation in learning activities is an important factor that influences student performance in any higher learning institutions. However, there is no widely agreed definition of student engagement where most researchers consider the three-component model of behavioural, cognitive, and emotional engagement (Fredricks et al., 2004).
In online learning environments, engagement on an online learning platform would influence the students’ performance or learning achievement in a course. The use of technology has always been a prominent feature in educational institutions. A learning management system or LMS is an online tool that aids educational institutions in the design, implementation, and assessment of learning systems. Universities and higher education institutions utilize the LMS to build a comprehensive digital structure in their educational system (Al-Mamary, 2022). The use of LMS has been found to improve the students’ performance in both conventional or face-to-face learning, and online learning (Bere et al., 2018).
The students would access the learning materials and attempt the learning activities as part of their learning process. The students’ learning activities can be analyzed further as the LMS data has become available in describing students’ online learning progress and performance. The LMS supports student learning by providing digital content and learning activities such as quizzes, assignments, and discussion forums (Brozina et al., 2019; Motz et al., 2019).
As every action in LMS is monitored and stored, insights can be gained into students’ online behaviour, which in turn can be used to improve teaching and learning. Liu et al. (2019) stated that learning motivation is an important factor of quality online engagement. It is critical to design and implement online activities to attract students’ interest while providing reinforcement to difficult topics (Avcı & Ergün, 2019). It was found that high levels of student participation enhance the students’ engagement to online courses (Al-Tameemi & Xue, 2019; Zhang et al., 2020). Thus, acceptable design of learning activities ensures prevention of online learning difficulties and promotes better students’ performance (Rodgers, 2008). The reports specify the findings of correlation between students’ performance and engagement on online learning platforms.
This paper presents an initial analysis on the study done to find out the engagement level of the Universiti Tenaga Nasional (UNITEN) students in Brighten, a Moodle-based LMS, of their course. In addition, this study also seeks the relationship between student performance and engagement with the online learning activities throughout the semester. The usage data in Brighten and conduct analysis on the students' activities online, to determine the engagement level for a selected course. This engagement data is used to investigate the correlation between engagement level and performance.
The outcome of this analysis is expected to provide some insight for further research to better design the learning activities in LMS to enhance the student engagement and therefore improve their performance.
Methodology
This study involves the implementation of teaching and learning activities of a course in the Learning Management System (LMS) called Brighten. The course used for this study is CSEB3213 Data Structures and Algorithms, a core course in Bachelor of Computer Science (BCS) for all its majoring programmes – Software Engineering, Systems and Networking, and Cyber Security in UNITEN. The course is found in semester four of the programme structure and compulsory for students to take and pass (at least letter grade D). The course carries 3 credit hours.
The course implementation considered for this study was from Section 01 in Semester 1, 2021/2022 (September 2021 – January 2022) with 54 students. Due to the COVID-19 pandemic at that time, the teaching and learning activities for the entire semester were conducted in a fully virtual or online mode. The course was delivered via two main methods, lectures and labs, with the distribution of 3 hours and 2 hours per week for lecture and lab respectively.
Assessment methods used for this course were quizzes, tests, lab exercises, lab test and group assignment for the continuous assessments, and a final examination. Since the implementation of the course was fully online for that semester, all teaching and learning resources, activities and assessments were implemented on Brighten. For the learning materials/resources, the lecturer used and uploaded lecture notes slides, links to videos, sample programs and revision exercises through the “file”, “folder” and “URL” features of the Brighten, as summarised in Table 1. For the class activities, a few Padlet were embedded to the course page via “label” for students to participate and engage especially responding to the in-class exercises. For the lab exercises and group assignment submissions, the lecturer utilized the “assignment” feature where else the quizzes, tests and final examination were primarily conducted using the “assessment” feature of Brighten. All students’ assessment marks determined the students’ final letter grade or performance for the course.
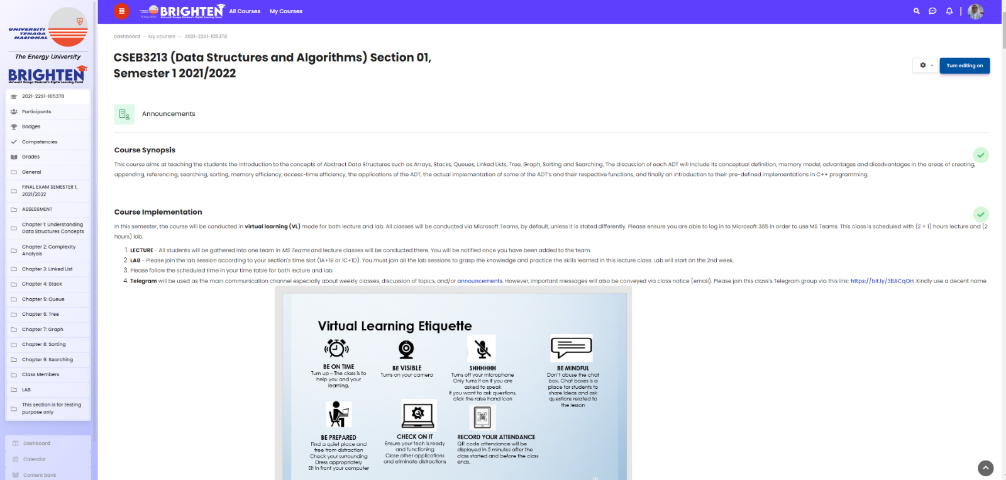
Figure 1 shows the screenshot of Brighten page for Data Structure and Algorithms (CSEB3123) course.
In this study, students’ engagement with the Brighten LMS is defined as the frequency or the number of hits to the course page’s activities by the students. At the end of the semester, students’ engagement data with LMS learning activities were extracted through the logs report of the course page in Brighten. The log report contained the interaction logs data of each event contexts and components performed by all students of the course throughout the semester. The collected student engagement data was then being processed, normalized and cleaned before the analysis.
Meanwhile, the student marks (0-100) or performance data from all assessments were acquired at the end of the semester and later grouped into scaled performance indicator: poor (0-39), weak (40-49), average (50-69), good (70-79) and excellent (80-100). Next, their performance was categorized into three engagement levels based on the students’ number of activity hits on Brighten into low-, medium-, and high-engagement levels.
For a general observation, a scattered plot graph was generated to observe the overall results of the relationship between the students’ engagement with the LMS and the students’ performance. Later, a refined analysis was conducted by grouping the students into three-level engagement groups.
Results and Discussions
This section discusses the findings of our research on student performance when compared to their engagement in learning activities on Brighten. Following that, the relationship between the student performance and the level of engagement is presented.
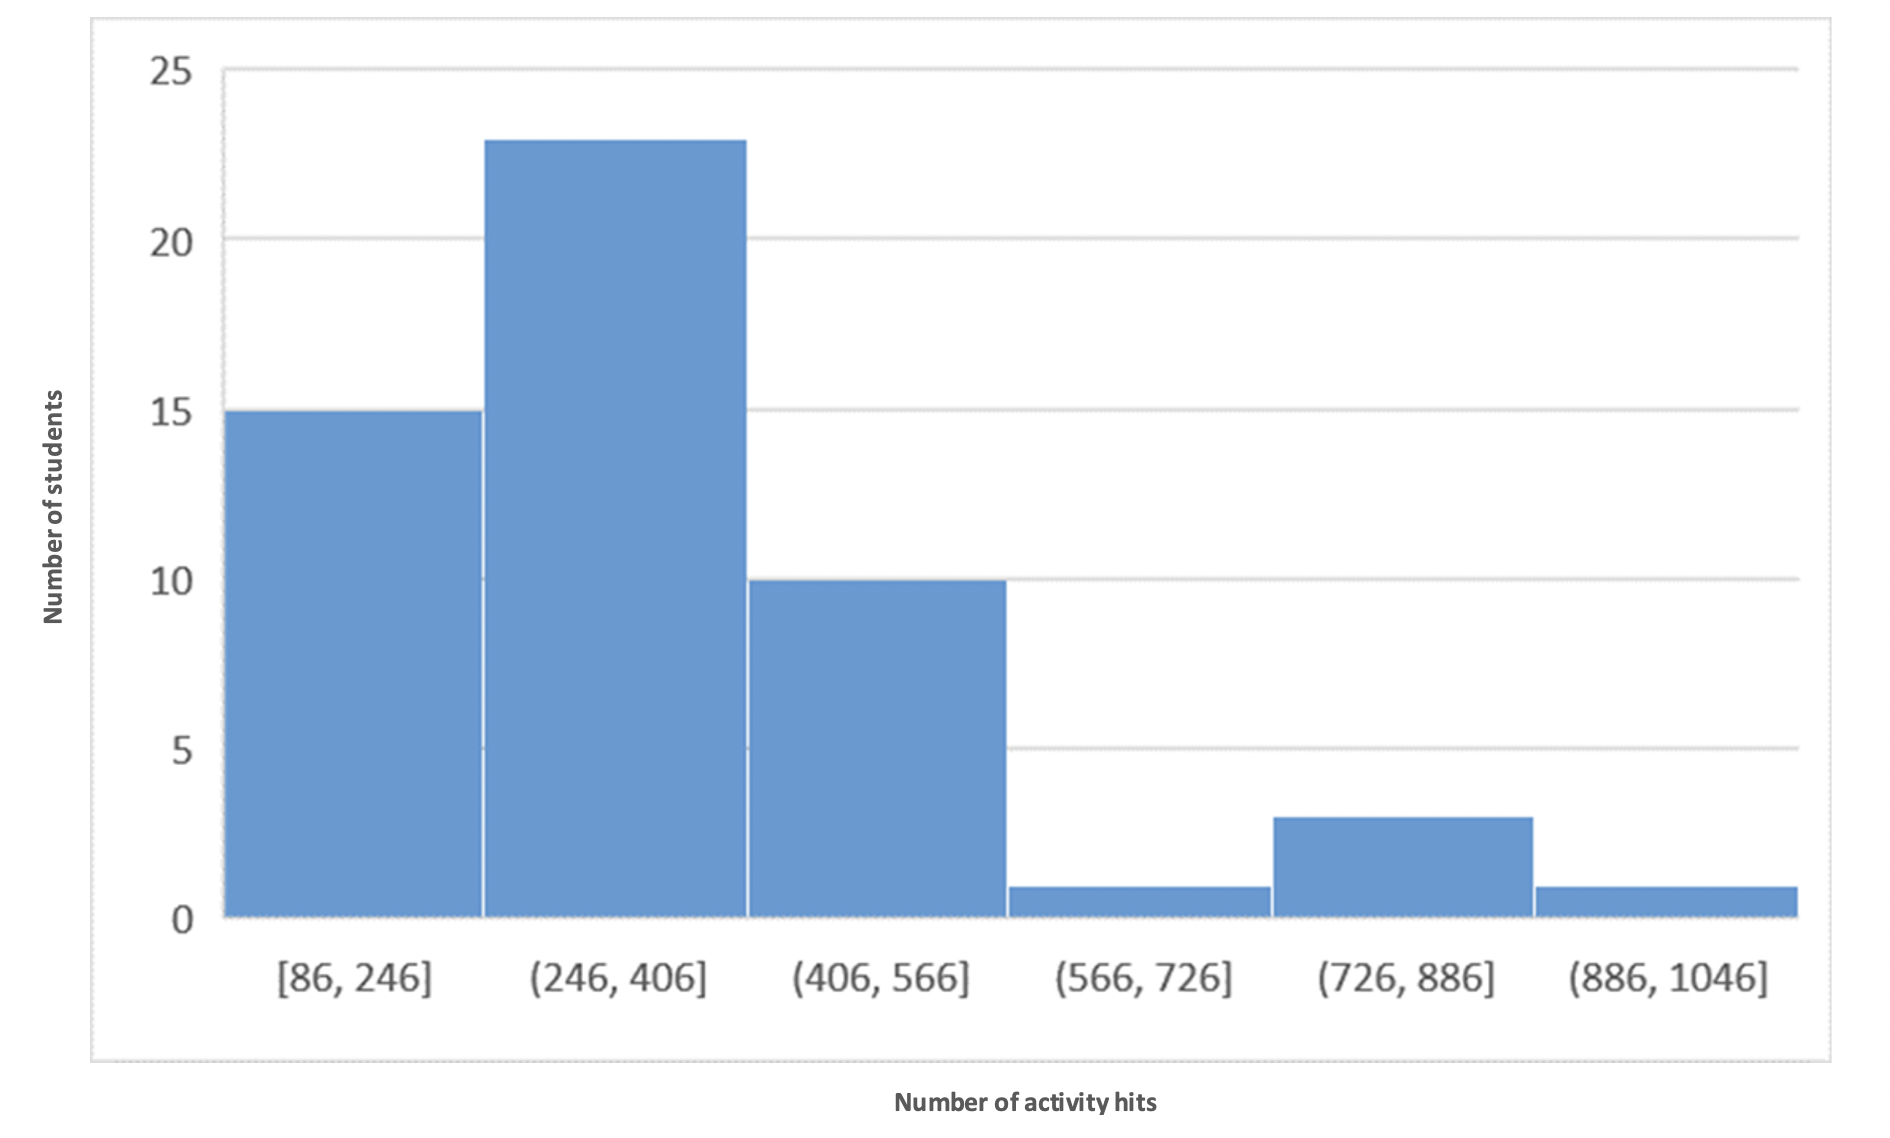
Initial analysis on the Brighten engagement was carried out by looking at the activity hits for each student. From the total of 54 students, the range of number of activity hits is between 86 and 930. The average is 349.92 (standard deviation is 174.28) and the median is 317. Next, a histogram of the hits was plotted as shown in Figure 2. It is observed that the highest number of students (23 student) were found to have activity hits in between 246 and 406. The lowest number of students (1 student) were found to have activity hits in both 566-726, and 886-1046, respectively.
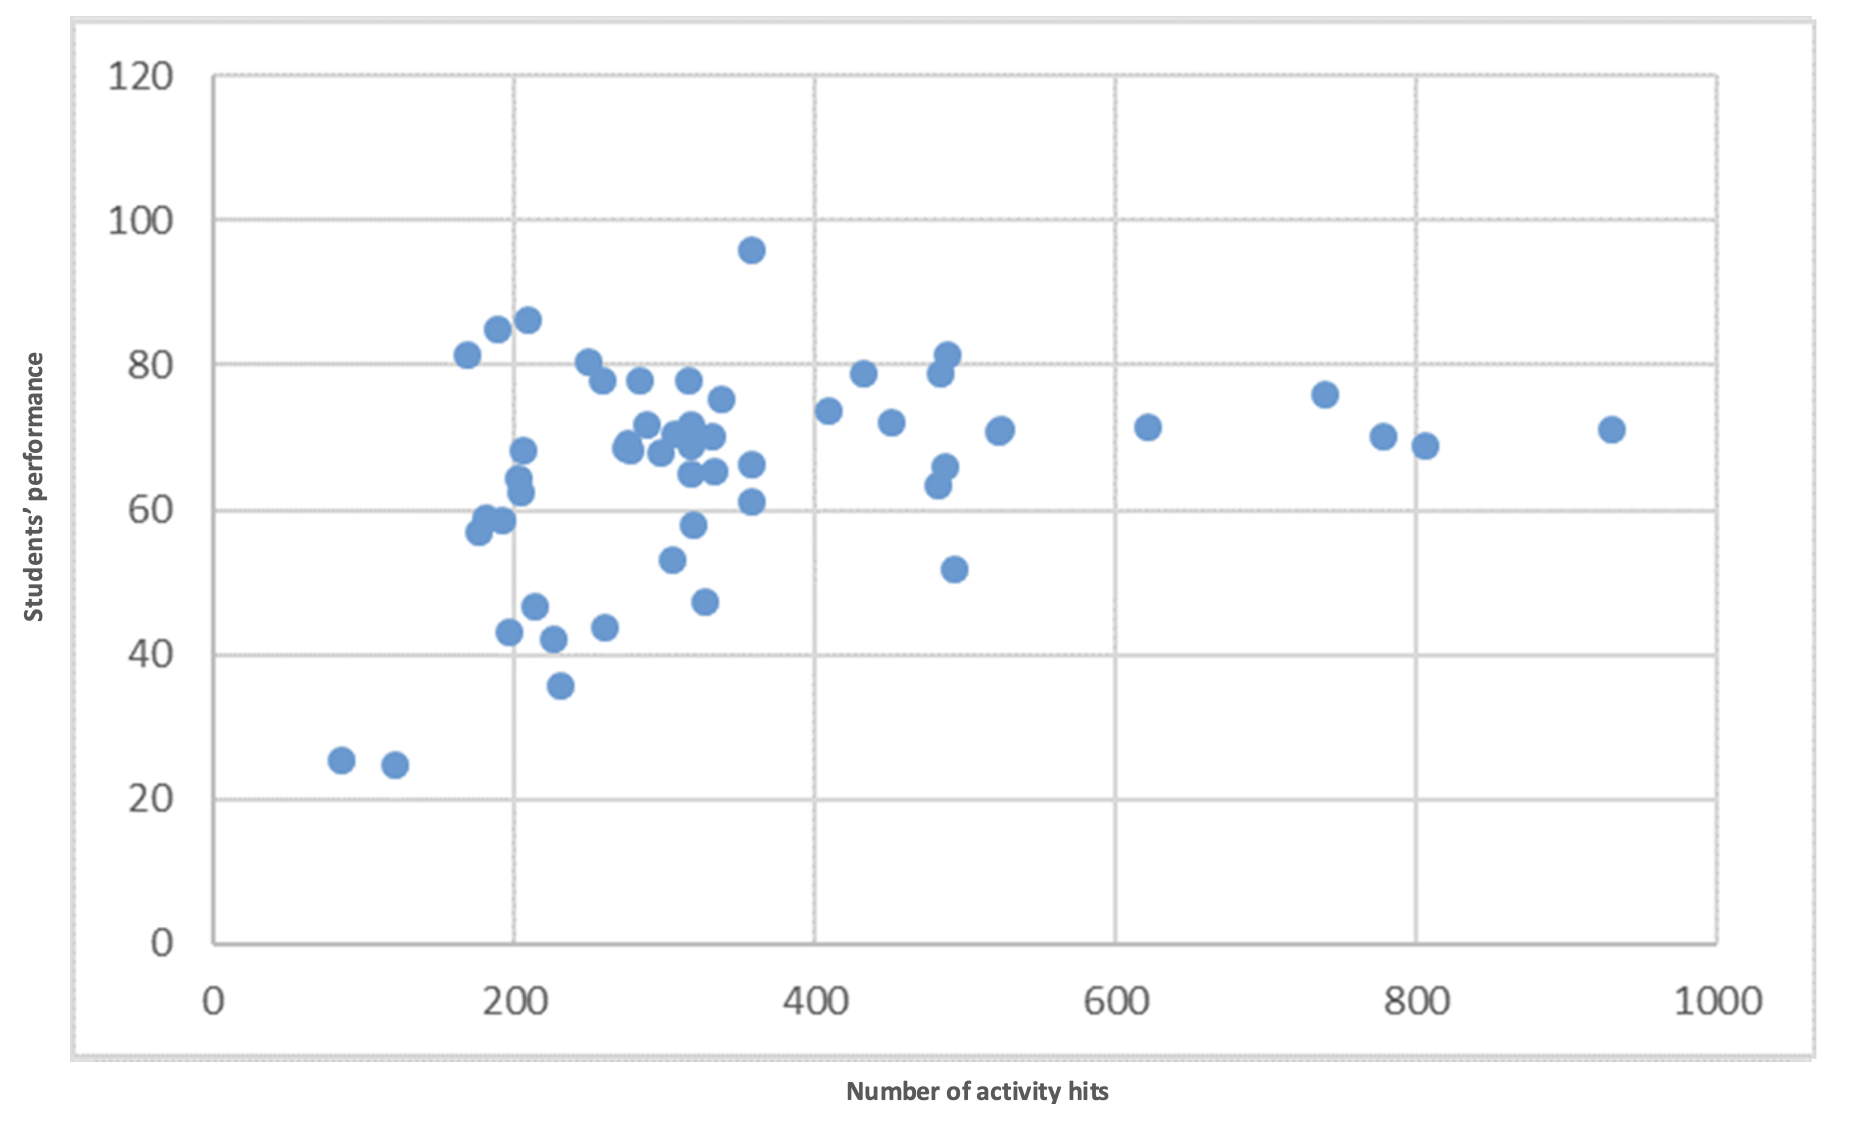
Next, to investigate the relationship between student performance and engagement with online learning activities, the data points were displayed as a scattered plot in Figure 3. Most student engagement was concentrated in between 200-400 hits of the learning activity in. Within this range, it was found that the student performance was spread between 40-80 marks. Regardless, there was no conclusive relationship that can be observed between the student performance and their engagement at this point.
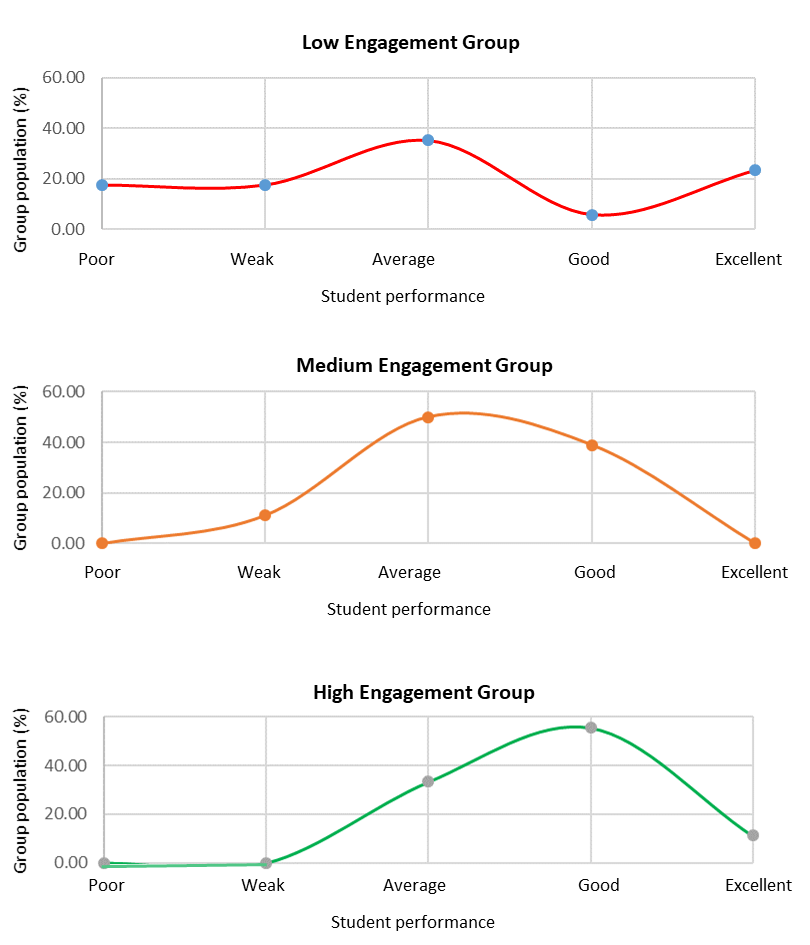
Further analysis was conducted to investigate the relationship between students' performance andengagement. Table 2 shows the student performance that was mapped into the three engagement levels: low-, medium- and high-engagement levels. Firstly, for the low engagement group, the highest number was from the average students (35.29%) followed by the excellent students (23.53%), weak and poor students (17.65% each), and good students (5.88%). Next, the medium engagement group was composed by the highest number coming from the average students (50.00%) followed by the good (38.89%) and weak students (11.11%). Finally, the high engagement group consists of the good students with the highest population (55.56%) followed by the average (33.33%) and excellent students (11.11%).
Table 3 depicts the mean and standard deviation of the three different engagement groups. The high engagement group scored better on mean or average if compared to the low- and medium- engagement groups. In addition, the high engagement group had more consistent marks if compared to the other two groups. Nevertheless, the engagement groups may be effected by outliers with very high student mark or low student mark.
Figure 4 displays the student engagement in comparison with the student performance. For the low engagement group, the student performance was almost bell-curve distributed and there was no direct relationship between the student engagement-performance results. However, both the medium- and high- engagement groups show that the distribution is negatively skewed with most high-performing students having higher engagement with theLMS activities. For this reason, we found that the higher the student performance is, the higher the student engagement with the LMS learning material would be.
Conclusion
This study has demonstrated the relationship between the student performance and the student engagement with the online learning activities in a particular course using a Moodle-based LMS. The early finding on the relationship between the students’ engagement and their performance was further analysed to show that the students’ performance highly correlates with the students’ online engagement. It is hoped that this study promotes a better design of the learning activities in LMS to improve student engagement and thus performance.
Acknowledgments
The authors wish to thank UNITEN for supporting and funding this research through BOLD research grant 2/2021/2021155. The authors also would like to thank all who has directly or indirectly providing assistance for this project.
References
Al-Mamary, Y. H. S. (2022). Why do students adopt and use Learning Management Systems? Insights from Saudi Arabia. International Journal of Information Management Data Insights, 2(2), Article 100088. DOI:
Al-Tameemi, G., & Xue, J. (2019). Towards an Intelligent System to Improve Student Engagement and Retention. Procedia Computer Science, 151, 1120-1127. DOI:
Avcı, Ü., & Ergün, E. (2019). Online students’ LMS activities and their effect on engagement, information literacy and academic performance. Interactive Learning Environments, 1-14. DOI:
Bere, A., Deng, H., & Tay, R. (2018). Investigating the Impact of eLearning Using LMS on the Performance of Teaching and Learning in Higher Education. 2018 IEEE Conference on e-Learning, e-Management and e-Services (IC3e), 2018, 6-10. DOI:
Brozina, C., Knight, D. B., Kinoshita, T., & Johri, A. (2019). Engaged to succeed: understanding first-year engineering students’ course engagement and performance through analytics. IEEE Access, 7, 163686-163699. DOI:
Fredricks, J., Blumenfeld, P., & Paris, A. (2004). School engagement. Review of Educational Research, 74(1), 59-109. DOI:
Liu, D. Y. T., Atif, A., Froissard, J. C., & Richards, D. (2019). An enhanced learning analytics plugin for Moodle: student engagement and personalised intervention. ASCILITE 2015-Australasian Society for Computers in Learning and Tertiary Education. Conference Proceedings.
Motz, B., Quick, J., Schroeder, N., Zook, J., & Gunkel, M. (2019). The validity and utility of activity logs as a measure of student engagement. In Proceedings of the 9th International Conference on Learning Analytics & Knowledge (pp. 300-309). DOI:
Orji, F., & Vassileva, J. (2020). Using Machine Learning to Explore the Relation Between Student Engagement and Student Performance.2020 24th International Conference Information Visualisation (IV), 480-485. DOI:
Rodgers, T. (2008). Student engagement in the e-learning process and the impact on their grades. International Journal of Cyber Society and Education, 1(2), 143-156.
Zhang, Y., Ghandour, A., & Shestak, V. (2020). Using Learning Analytics to Predict Students Performance in Moodle LMS. International Journal of Emerging Technologies in Learning (iJET), 15(20), 102-115. DOI:
Copyright information

This work is licensed under a Creative Commons Attribution-NonCommercial-NoDerivatives 4.0 International License.
About this article
Publication Date
18 August 2023
Article Doi
eBook ISBN
978-1-80296-963-4
Publisher
European Publisher
Volume
1
Print ISBN (optional)
-
Edition Number
1st Edition
Pages
1-1050
Subjects
Multi-disciplinary, Accounting, Finance, Economics, Business Management, Marketing, Entrepreneurship, Social Studies
Cite this article as:
Ibrahim, Z., Jamaluddin, J. E., Anuar, A., & Hari, Z. (2023). Investigating The Relationship Between Students’ Performance And Engagement In Online Learning Platform. In A. H. Jaaffar, S. Buniamin, N. R. A. Rahman, N. S. Othman, N. Mohammad, S. Kasavan, N. E. A. B. Mohamad, Z. M. Saad, F. A. Ghani, & N. I. N. Redzuan (Eds.), Accelerating Transformation towards Sustainable and Resilient Business: Lessons Learned from the COVID-19 Crisis, vol 1. European Proceedings of Finance and Economics (pp. 905-912). European Publisher. https://doi.org/10.15405/epfe.23081.83