
Identifying the Relationship Between Speed Level and Performance in Female Triple Jump


Abstract
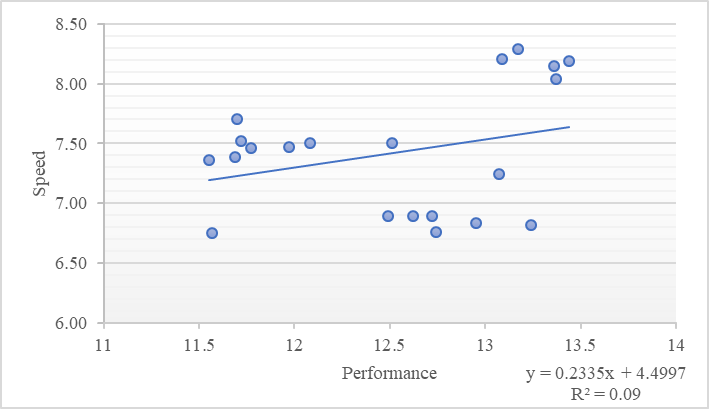
The triple jump is one of the most difficult, demanding and complex events in athletics, and one of the main requirements in order to succeed is maintaining the speed gained in the run-up, on the three phases of the jump. The present research aims to identify the relationship between the level of the speed manifested on the approach and the length of the jump in the female junior triple jumpers. The measurements for this study were performed at the National Junior Championship, Pitesti, July 30, 2021, using Witty photocells and the Optojump Next System. In order to analyse the relationship between the two, we calculated the Pearson linear correlation coefficient both at group level, resulting in r = 0.299, which indicates a positive, direct correlation, but weak in value and at individual level, where were obtained positive as well as negative values. (N.A r = -0.571, D.A. r = 0.477, C.I. r = -1, V.I. r = 0.412, B.A. r = 1.)
Keywords: Athletics, approach speed, linear correlation, performance, triple jump
Introduction
The triple jump is one of the two athletics events in which athletes aim to maximize the jump/horizontal jump, this consists in three take off phases, each one of them having an important role due to the fact that the athletes must tolerate extraordinary impact forces and requires maintaining a high level of horizontal speed, the maximum horizontal distance being obtained by speed and reactivity (Abeer, 2014; Dragomir et al., 2021). Very demanding from a technical and physical point of view, due to its specific requirements, namely the three consecutive take-off phases, flights and landings performed at a very high speed, the triple jump technique is conditioned by the preservation of horizontal speed during the successive flights and landings and it is influenced by certain factors such as: the economic use of the forces employed, strong and fast take-offs, smooth flights and decelerating as little as possible on landings (Alexandreescu et al., 1983; Hui et al., 2015). The take-off technique in each step differs significantly from one athlete to another due to the differences between individual physical characteristics, as the differences between the length of each phase of the jump from one athlete to another, and having a good take-off technique is necessary to maintain horizontal speed, creating an effective link between muscle actions and the moment of their production subjecting the athlete to high impact forces with small speed losses (Perttunen et al., 2000).
According to the distribution of forces, each phase of the jump is important, because when the foot touches the ground, the jumper loses the horizontal speed (Abeer, 2014).
The loss of horizontal speed has a negative effect on performance since the entire distance is closely dependent on the ability to maintain the specific horizontal speed (gained on the run-up) during the three take-off phases in the triple jump (Mihai, 2012, p. 35).
The horizontal speed during the approach is approximately 9.00-9.31 m/s, and of the three flight phases is between 8.4-8.86, 7.58-8.22, 6.46-7.34 m/s, and the losses recorded speed ranges are between: 0.69-0.95, 0.38-0.52, 0.85-1.05 m/s (Abeer, 2014).
The run-up in the triple jump must be long enough to allow the jumper to accelerate to almost maximum speed, but at the same time, it must be relaxed so that he could easily control it (Rogers, 2004). The approach consists of an acceleration run, where the speed developed by the athlete has a great contribution to the determination of the initial flight speed both in the first and in the following take-offs and flights (Bondoc-Ionescu et al., 2018). If the run-up is too slow, the jumper will lose the speed accumulated in the later phases, if it is too fast, he will not be able to control the jump (Rogers, 2004).
The purpose of the jumper in the triple jump is to cover as long a distance as possible after performing the approach, and this depends on the ability to maintain speed and control on all phases of the jump (Mawer & Biggs, 2015). The development of speed in the triple jump is a very important aspect in achieving performance, and the speed gained by a triple jumper is much slower compared to the long jump, because the triple jump requires maintaining posture control on all three phases of the jump (Newman, 2012).
The run-up speed can be divided into three phases: acceleration, reaching maximum speed and maintaining maximum speed (Bompa & Haff, 2014).
Problem Statement
The modest results recorded in the national female triple jump event over the past decade have multiple causes. Among them, we considered that a major cause is the level of speed of the athletes. Based on this premise, the hypothesis was issued that the modest level of performance of the athletes who practice this event in Romania is based on the lack of a positive linear correlation between the speed on the approach and the performance achieved in the competition.
Research Questions
The questions that this research aims to answer are: what is the level of manifestation of the speed of the junior jumpers in the triple jump? And what is the connection between this and the length of the jump?
Purpose of the Study
The purpose of this study is to investigate the relationship between the level of speed developed on the approach and the length of the triple jump jump, as well as the extent to which it is influenced by the speed level.
Research Methods
The determination of the speed on the approach and on the different parts of it as well as the kinematic and length characteristics of each of the three steps / jumps in the event structure was made during the National Junior Championship, 30 July 2021, Pitesti. A number of 7 female athletes entered the competition. The speed on the approach was measured with Witty photocells, placed at a distance of 30m, along the length of the runway for each sector, which provided the value of the speed with intermediate times from 10 to 10m. The jump length was measured using the optical motion analysis system, Optojump Next, located on the left and right side of the lane, from the 11 m board to the nearest edge of the jumping pit.
The research was carried out with the consent of the Romanian Athletics Federation and with the written consent of the parents of the athletes participating in this competition.
Findings
Following the measurements performed on the run-up, we were able to determine and analyse, both at group and individual level, the speed on the run-up in the following forms: the average speed recorded during the whole run-up, the minimum value and its maximum value for each athlete (table 1), the speed recorded on each 10 m segment, for each athlete (table 2), as well as the mean for every athlete and group indicators (table3).
In order to analyse the relationship between the speed level and the result in the competition we calculated the Pearson linear correlation coefficient both at group level and individually for each competitor.
Group analysis
In terms of speed, at group level, we observe an average speed value of 7.37m/s and a coefficient of variation of 6.24%, resulting in a high homogeneity of the group. In terms of competition performance, at the group level we have an average value of 12.32m and a coefficient of variation of 5.93%, the standard deviation is ± 0.73m resulting in high homogeneity and the fact that the dispersion is lower in terms of performance rather than in terms of speed on approach.
In terms of step length, at group level we have a mean value of the first step of 5.36m and a coefficient of variability of 11.24% which means an average dispersion and a lower homogeneity of the group. For the second step we have a mean value of 3.40m and a coefficient of variability of 5.66% expressing a higher homogeneity of the group at the level of the second step, and for the third step a mean value of 3.73m and a coefficient of variability of 6.94%, representing a high homogeneity and a low dispersion of the group. We can observe that, at group level, the first step is the longest, and the second step is the shortest of the 3 steps.
The Pearson correlation index for the group is r = 0.299, which indicates a positive, direct correlation, but weak in value.
Individual analysis of speed results
N.A., who obtained the best result from the competition, also recorded the best speed values on the approach. The values recorded on the 3 measured segments are the best among the 7 competitors. We can see that the acceleration is a constant one, and the best speed index is reached on the last part of the approach. From the point of view of the differences between the average and the minimum speed, as well as the difference between the minimum and the maximum speed, recorded on the run-up, the values expressed (0.12 m/s, respectively 0.14 m/s) indicate a constant movement speed.
Occupying second place, D.A. develops a continuous acceleration from one segment to another, the differences between them are the most visible of the 7 competitors, the difference between the last and the first segment being 2.83 m/s. Although it has the lowest values of average and maximum speed, the differences between them are small (0.04 m/s and 0.09 m/s, respectively), which shows that, although in this case the athlete has a lower speed value, the running approach has a constant character.
C.I. records the best speed value on the last measured segment, namely 9.11m/s. Also in the case of this athlete, the run-up is a constant one, the differences between the average, minimum and maximum speed are 0.18 m/s and 0.14 m/s.
V.I. has a shorter approach, being recorded in only two segments. The difference between the average and maximum speed is 0.04m/s, and between the minimum and average speed is 0.09 m/s.
B.A., also with a shorter approach, of 20m, registers a higher value of the speed on the first segment of the approach which indicates a slowdown before the board, and the difference between average and maximum speed has a slightly higher value than the difference between the minimum and the average speed, expressing a slight inconsistency on the approach runs.
B.C has an increasing speed on the last segment, but the differences between the minimum, average and maximum speed are relatively large, 0.1m/s and 0.22m/s.
L.D. fails to obtain any valid attempts in the competition, and the running on the approach is an inconsistent one, being the athlete with the biggest differences registered, of 0.29m/s and 0.33m/s.
The Pearson correlation coefficient for each athlete was as follows: for N.A. r = -0.571, D.A. r = 0.477, C.I. r = -1, V.I. r = 0.412, B.A. r = 1. N.A. has, by calculation, an inverse, negative correlation index. In the case of D.A. the correlation is positive, but weak. C.I. shows the weakest negative correlation. For V.I. we have a weak, positive correlation. The strongest positive correlation is recorded by B.A., and for B.C. and L.D., the calculation of the correlation index was not possible due to the invalid results in the competition.
Individual analysis of competition results
Following the results obtained measuring the length of the jumps in the competition, we presented in table 4 the kinematic aspects of the best jump of each athlete. In the case of athletes N.A. and V.I. we presented the second best performance due to some external factors that interfered with the equipment during the execution, which did not allow the full analysis of the jump.
N.A. gets the best performance in the competition. According to the measurements in table 5, the first step measures 5.69m, the second 3.77m and the last step 3.91m. This athlete has the second longest step among the competitors included in our research, and the distance on the first two steps is the longest of all athletes, respectively 9.46 m. She has the second contact time on the first and second step, compared to the other athletes. The speed recorded on the first step has the highest value, and the difference between the speed related to the first step and the second step is 0.45 m/s.
The second result belongs to the athlete D.A., according to table 4, with a jump measuring 5.93m on the first step, being the longest of all the measured jumps, 3.44m on the second and 3.87m on the third step. She has the best contact time and the longest flight time on the first step. She also records the highest speed on the second step as well as the highest height of all the athletes on the first step. The difference between the speed on the first and second step is also a small one, of 0.08m/s. It is noteworthy that she is the only competitor who has a positive result on acceleration, proving that she does not lose speed on the steps.
C.I. records the third result of the jumping distance and the second result on the first step, 5.92m, and 3.34m on the second step and 3.81m on the third step. The flight time on the first step is the second in value, and the second step it is the smallest compared to the other athletes. The height recorded by her on the first step is the second of the measured athletes, and on the second step she is the lowest. The difference between the speeds measured in steps is 0.01m/s and the acceleration -0.01m/s.
For V.I. we analyzed the second best performance due to some technical errors, the best jump of 12.08m was not fully measured. The second best jump, 11.97m measures 5.27m on the first step, 3.25m on the second and 3.45m on the third step. This athlete records the second shortest flight time on the second step and the second lowest altitude.
B.A. measures 4.42m on the first step (the shortest in the whole group), 3.32m on the second and 3.96m on the last step, being the longest compared to the other competitors. The contact time on the second step is the shortest of all the measured athletes, and the flight time on the same step is the second longest. The difference between the speeds measured on the first two steps is 0.41 m/s, the acceleration being -0.41m/s.
The first step of B.C. Measures 4.94m, the second 3.28m and the third step 3.35m. For the first step she records the lowest flight time and the lowest altitude of all the participating athletes. The difference between the speeds of the two steps is 0.39m/s.
L.D. did not record any valid attempts.
Conclusions
Considering that at the level of the group, in jumping, the average is 12.32m, a very weak one compared to the national record, 13.96m (https://www.fra.ro/wp-content/uploads/2019/09/ NATIONAL RECORDS-20.06.2019-air-free.pdf), the world record, 14.62 m (https://en.wikipedia.org/wiki/List_of_world_under-20_records_in_athletics), or even with the results at the World Championships from the same year, respectively 13.75m for 1st place (https://www.worldathletics.org/results/world-athletics-u20-championships/2021/world-athletics-u20-championships-7136587/women/triple-jump/final/result), the standard deviation is ± 0.73m, a small one, and the coefficient of variability 5.93%, the dispersion being small, resulting that the group is homogeneous.
Regarding the speed on the approach at group level, this is a weak one, of 7.37m/s, the standard deviation is ±0.46 m/s, and the coefficient of variability is 6.24%, we can conclude that the group is homogeneous, but to a lesser extent compared to the jump data.
A low value of the Pearson linear correlation coefficient was also found, which highlights the lack of a normal relationship between the level of relatively good speed on the run-up and the value of performance in the event, so therefore there is a mistake in managing the technical aspects of kinematics and take-offs on the three steps.
At individual level, the athlete N.A., although has the best performance in the competition, she has a negative correlation due to the low value of the jump length compared to the speed on the run-up, resulting a high loss of speed on the jump as it is also shown in table 4, where we can observe a speed deceleration by 0.45m/s in the second step, compared to the first step.
D.A. has a positive, but weak correlation, by having weak values of both speed and jumps, being the athlete with the lowest value of the average speed respectively 6.85m/s, the athlete C.I., with a correlation coefficient of r = -1, although it has the third best jump in competition, has the second lowest average speed value, due to the fact that she has the largest differences recorded from one segment to another of the approach, thus she is not reaching an optimal speed necessary for the execution of the jump in optimal conditions, for the athlete V.I., the correlation coefficient r = 0.412, is due to the fact that she has low values for both speed and jumps, this athlete also recorded losses of speed during the jump, the speed difference between step one and step two being 0.15m/s, and B.A., who has the highest positive value of the correlation coefficient, r = 1, also has weak values of both jumps and speed, also in this case the problem is maintaining the speed during the jump, as it appears from table 4, where the difference of speed between the first and the second step is of 0,44m/s.
References
Abeer, E. (2014). Biomechanical Evaluation of the Phases of the Triple Jump Take-Off in a top Female Athlete. Journal of Human Kinetics, 40(1), 29–35. https://www.sciendo.com/article/
Alexandreescu, D., Tatu, N. T., & Ardelean, T. (1983). Athletics. Didactic and pedagogical publishing.
Bompa, T. O., & Haff, G. G. (2014). Periodization - Theory and methodology of training. Ad Point Promo SRL.
Bondoc-Ionescu, D., Nechita, F., & Bondoc-Ionescu, A. (2018). Technique and methodology of teaching athletics events with notions of competition regulations. Transilvania University of Brasov.
Dragomir, L., Larion, A., & Rață, B. C. (2021). Study on energy characteristics in the triple jump in athletics, Ovidius University Annals, Series Physical Education and Sport / Science, movement and health, 21(1), 26-31. https://www.iat.uni-leipzig.de/datenbanken/iks/nwls/Record/4067514
Hui, L., Dewei, M., & Bing, Y. (2015). Effect of approach run velocity on the optimal performance of the triple jump, Journal of Sport and Health Science, 4(2015), 347-352. https://cyberleninka.org/article/n/1391232/viewer
Mawer, B., & Biggs, A. (2015). What are the optimal biomechanics required to execute a successful and effective triple jump. Biomechanics Blog. http://hlpe3531biomechanicsblog2015.blogspot.com/2015/06/hlpe3531-biomechanicsblog-triple-jump.html
Mihai, I. (2012). Monitoring the technique of the triple jump test - kinematic aspects. University of Pitesti.
Newman, N. (2012). Horizontal Jumps. JumPR Publishing.
Perttunen, J., Kyrölainen, H., Komi, P. V., & Heinonen, A. (2000). Biomechanical loading in the triple jump. Journal of Sports Sciences, 18(5), 363-70. https://pubmed.ncbi.nlm.nih.gov/10855682/
Rogers, J. L. (2004). US Athletics Coach Handbook. Bucharest.
Copyright information

This work is licensed under a Creative Commons Attribution-NonCommercial-NoDerivatives 4.0 International License.
About this article
Publication Date
10 April 2023
Article Doi
eBook ISBN
978-1-80296-961-0
Publisher
European Publisher
Volume
5
Print ISBN (optional)
-
Edition Number
1st Edition
Pages
1-1463
Subjects
Education sciences, teacher education, curriculum development, educational policies and management
Cite this article as:
Rapotan, A., Mihăilescu, L., & Mihai, I. (2023). Identifying the Relationship Between Speed Level and Performance in Female Triple Jump. In E. Soare, & C. Langa (Eds.), Education Facing Contemporary World Issues - EDU WORLD 2022, vol 5. European Proceedings of Educational Sciences (pp. 142-150). European Publisher. https://doi.org/10.15405/epes.23045.14