
Unlocking Malaysia's Sustainable Success: The Dynamic Link of Green Intellectual Capital


Abstract
This study aims to conduct a comprehensive analysis of the impact of applying green intellectual capital on the sustainable performance of the Malaysian public sector. Investigating key dimensions of green intellectual capital, including green human capital, green structural capital, and green relational capital, we meticulously evaluate their collective influence on environmental, economic, and social performance. Employing an online self-administered survey questionnaire, we seek to collect data from over 538 government offices in Malaysia, including Sabah and Sarawak. Our findings reveal a significant positive impact of green intellectual capital on sustainable performance. Additionally, our research endeavours to assess the current level of green intellectual capital within public sector organizations, intending to provide actionable insights for leaders and stakeholders. Our goal is to contribute valuable insights for leaders, guiding them in enhancing intellectual capital and policy development. This research not only adds to the existing literature on sustainable performance but also offers recommendations for the implementation of other critical factors essential for achieving successful sustainable performance.
Keywords: Green Intellectual Capital, Malaysia, Public Sector, Sustainable Performance
Introduction
Twelfth Malaysia Plan (RMKe-12) 2021-2025, which relates to the 2030 agenda, aims to achieve the goal of "A Prosperous, Inclusive, and Sustainable Malaysia". The RMKe-12 intends to fulfil several objectives, including economic growth, with GDP predicted to expand at a rate ranging from 4.5% to 5.5% each year which consequently hopes to gain higher gross national income (GNI) (Economic Planning Unit, 2021). The RMKe-12 emphasises the government's commitment to attaining the 17 SDGs, focusing on measures to revitalise economic development, ensuring that the nation's prosperity is divided more fairly and equitably, and advancing green growth and enhancing green growth energy sustainability.
Malaysia’s labour productivity growth is expected to increase from 1.1 percent to 3.6 percent per annum. The focus will be given to gearing up for the Fourth Industrial Revolution (IR4.0) (e.g., fostering automation, machine learning and real-time data), enabling the environment for the digital economy (e.g., online retail and services; intensifying research, development and innovation), and developing talent (Economic Planning Unit, 2021). Malaysia's services sector employed more than 63 per cent of the total workforce in 2019. It accounted for more than half of the GDP, making it a significant contribution to the country's economic growth, productivity, and revenues, such as providing jobs, inputs and public services for the economy (Nair, 2021).
In line with the objectives, the RMKe-12 emphasised the role of human capital and the involvement of central agencies such as the Malaysian Administrative Modernisation and Management Planning Unit (MAMPU) to strengthen the public service sector (Bernama, 2021). The way forward for strengthening public sector service delivery is to focus on three key areas: training high-performing civil servants, adopting a whole-of-government strategy and improving budgeting and project management (Economic Planning Unit, 2021). Furthermore, with the acceleration of digital adoption, every government official is anticipated to be digitally literate by 2025. This strategy is consistent with the sustainable agenda to protect the environment by safeguarding the forest and environment by chopping down trees and using paper.
Generally, the scope of this study will focus on the Malaysian Public Sector (MPS), specifically the Federal and State General Public Service. The main reason the public service was selected as the scope of this study is that the government green procurement initiative will be expanded to state governments and local authorities. Furthermore, the state government was responsible for preserving and conserving natural resources.
Problem Statement
In Budget 2021, the Minister of Finance has announced a particular focus on the sustainability agenda. The government has shown their commitment through the introduction and implementation of environmental policies and acts. Noteworthy among these are the National Policy on the Environment, the National Forestry Policy, and the National Policy on Climate Change. Correspondingly, reinforced regulations include the Environmental Quality Act of 1974, which is pertinent to the study's environmental focus. These policies and regulations provide crucial guidelines for stakeholders, ensuring environmental preservation and sustainability.
Top of Form
Environmental initiatives and campaigns have been launched across diverse societal segments, engaging students, educators, rural and urban communities, non-government organizations (NGOs), and and more. These efforts encompass environmental awareness campaigns, exhibitions, and conferences collaboratively organized with government ministries, agencies, and the private sector to elevate public consciousness regarding environmental preservation. Notably, the government has pledged to extend the green procurement initiative to state governments and local authorities, aspiring to achieve a minimum of 25 percent green procurement by 2025. This strategic commitment acts as a transformative catalyst, integrating sustainability into organizational practices and supply chain decisions, weaving environmental responsibility into governance and business. It aligns with conservation goals, fostering a culture of responsible consumption and production for a lasting, widespread influence on sustainable practices.
However, the efforts seem to yield only temporary results. It appears that the reinforcement has not been effective enough to enhance environmental sustainability. These problems may be attributed to a lack of knowledge on environmental issues, including recycling and pollution, coupled with a relatively low public attitude toward environmental preservation (Ahmad et al., 2011). Several factors were recognized as inhibiting stakeholders' involvement in the sustainable programs, including lack of knowledge and awareness, lack of commitment, and lack of staffing aspects. An analysis of determining the differences in the outcome of the participants in the sustainability programs in the community revealed that, among the four determinants of outcome that are knowledge, attitude, skills, and aspirations (KASA), only knowledge showed a moderate level at 60 per cent and significant difference of 42.4 per cent; 18.4 per cent before program and 60.8 after participating the program (Zan & Ngah, 2012). This evidence proves that knowledge of the environment is a critical success factor in determining the success of sustainable programs.
Therefore, with the growth of sustainability awareness, the public sector, businesses, and public society have become more conscious about environmental management systems, determining to protect the natural environment and save natural resources (Wong, 2019). EMS is a guideline among certain internationally accredited systems, such as the European Union Eco-Management and Audit Scheme (EMAS) and/or the standardised ISO 14001 (Von Malmborg, 2003). The EMS is typically considered business sustainable and consistent with the Triple Bottom Line (TBL) theory. The theory describes sustainability in business as "adopting business strategies and practices that meet the organisation's needs and its stakeholders today while also preserving, maintaining, and maximizing potential human and natural resources” (Elkington, 1998, p. 362). Even though EMS is well-known in the corporate and industrial sectors, an increasing number of public sector organisations, including local governments/authorities, in nations all over the world have willingly participated in the implementation and usage of EMS (Burstroom, 2000; Von Malmborg, 2003).
Through industrialisation and globalisation, some business exploits natural resources to maximize profit (Das & Singh, 2016). Despite that, they do not give much attention to social (corporate social responsibility) and environmental sustainability. Due to this, the idea of sustainable performance has been introduced. A company's economic performance is no longer seen as the only aim to accomplish as much focus as has been put on achieving social and environmental objectives (Bombiak & Marciniuk-Kluska, 2018). The sustainable performance concept has triangulated the three essential lines in TBL theory, that is, economy, social, and environmental performance. The measures for economic performance deals with financial matters, social performance covers the interest of the stakeholders (e.g., employees and customers), and environmental performance is about protecting and preserving the environment (Mohd-Yusoff, Amirudin, et al., 2020).
With that notion, organisations nowadays are admitting the importance of sustainability within business operations. Many organisations have realised the importance of securing intangible assets in a knowledge-based economy instead of tangible assets to improve organisational performance. Intangible assets are non-physical assets owned by the organisation for producing goods or delivering services, administrative purposes, and future investment (Irawan et al., 2019). Intangible assets also refer to the firm’s intellectual capital (IC), including the employees’ knowledge, capabilities and experience, technology, and the ability to create innovation (Chen, 2007; Huang & Kung, 2011). The intellectual capital could offer organisations various opportunities to improve performance, such as to obtain a sustainable competitive advantage, to aim for a high-performance work system, to improve business strategies, and to add value and innovation into the organisation (Dwianika & Gunawan, 2020; Shahzad et al., 2019; Xu & Liu, 2019; Yong et al., 2019). Based on the abovementioned facts, existing studies have constantly established the association between intellectual capital and organisations' sustainable performance.
The increasing global focus on environmental issues has forced organisations to incorporate green practices into their operations at an increasing rate (Yong et al., 2019). In pursuit of these green practices, organisations need a skilful workforce with a priority on environmental sustainability. Similarly, (Mohd-Yusoff, Amirudin, et al., 2020) mentioned the organisation's role to exploit their human resources in achieving green objectives that should be linked to sustainable performance. Therefore, the development of green intellectual capital has become essential with the intense growth in global environmentalism in the past decade and increased environmental awareness (Chang & Chen, 2012).
Generally, green intellectual capital can be described as an integration of intellectual capital and environmental concern. It covers all types of intangible assets, either at the organisational or individual level, such as competencies, experience, knowledge and interaction (Chen, 2007). Moreover, Huang and Kung (2011) explain the benefits of adopting green intellectual capital to an organisation to leverage in the process of conducting environmental management and gain a competitive advantage. Further, green intellectual capital enables firms to comply with environmental regulations, increase environmental consciousness, and add value for the organisation (Huang & Kung, 2011).
- Based on the above discourse, this research proposed that green intellectual capital have a significant influence on sustainable performance. Thus, the following hypothesis is established; H1: Green intellectual capital has a positive effect on sustainable performance.
Research Questions
Does green intellectual capital affect sustainable performance of public sector?
Purpose of the Study
This study aims to provide a robust theoretical contribution to the body of knowledge by investigating the influence of green intellectual capital on sustainable performance.
Research Methods
Research Design and Sample
This research utilised an exploratory research design to understand the sustainable issue better. Exploratory research is practical when there is limited pre-existing information about an issue and new relationships, themes, ideas and patterns (J. F. Hair et al., 2020). This study focuses on public sector in Malaysia which comprised of three tier of government that is the federal, state and the local government in Malaysia. To carry out its responsibilities, the federal government creates different ministries, departments, and agencies (statutory entities). State governments are Malaysia's second tier of government, while local governments are the lowest.
Measurement
An online self-administered survey questionnaire served as the primary instrument for data collection. To mitigate common method bias, this study employed multi-item scales featuring various variables and indicators. The instrument's items were drawn and modified from established sources. Specifically, items pertaining to green intellectual capital were adapted from Huang and Kung (2011) and (Yusoff et al., 2019), while those related to sustainable performance were sourced from Gelhard and von Delft (2016).
Data Analysis
The data were analysed using Statistical Package for the Social Sciences (SPSS) 28 for descriptive analysis of frequency, percentage, mean, and standard deviation from the questionnaires. Further, SMART-PLS Version 4 was used as a tool for data analysis to assess the variables’ structural equation model. Partial Least Square (PLS) based Structural Equation Modelling (SEM) was adopted for the data analysis; this method is useful when one dependent variable becomes an independent variable in subsequent relationships. It does not involve assumptions of homogeneity in the dependent variable’s variances and covariances.
Findings
This section details the statistical analysis of the research. Firstly, we explain the preliminary analysis. Then, a few descriptive analyses of each research variable were conducted after the analysis of the respondents' demographic profile. The assessment of structural equation modelling using partial least squares (SEM-PLS) is covered in more detail in the next section of the chapter. It is broken down into two parts: validation of the measurement model and evaluation of the structural model.
Descriptive Analysis
Response Pattern
After data screening and cleared with assumptions, the next step is to run the descriptive analysis. The research questionnaire was distributed using an online survey to the public sector in Malaysia between February to July 2022. Table 1, the response pattern based on organisation category was divided into government offices and statutory bodies. Most respondents were from government offices (N=154, 92.2%) and the remaining were from statutory bodies (N=13, 7.8%).
Descriptive Analysis of Respondents
The demographic details of the respondents are highlighted in Table 2. Out of 167 respondents who participated in this study, 90 (53.9%) were male, and 77 (46.1%) were female. In terms of age, the majority of respondents age are between 31 – 40 years old 62 respondents (37.1%), followed by the age between 41 – 50 years old by 51 respondents (30.5%), the age between 51 – 60 years old 34 respondents (20.4%) and the smallest group is 21 – 30 years old by 20 respondents (12%). The descriptive analysis of the highest level of education reports that 124 (74.3%) respondents possess a Bachelor's degree, 41 (24.6%) respondents with a Master's degree, and two are PhD holders.
Descriptive Analysis of Overall Green Intellectual Capital
Table 3 presents the overall descriptive statistical analysis for green intellectual capital. It indicates that most respondents have appropriate green capabilities, including knowledge, skills, experience and technology in performing the job. The items for this construct were measured using a seven-point Likert scale. The outcome reveals that the overall green intellectual capital scored above moderate values (mean = 4.8704, SD = 1.1109).
Also, the finding of green intellectual capital dimensions highlights that the highest mean score was gained by green human capital (mean = 5.1401, SD = 1.0634). The second highest mean score for green intellectual capital is green relational capital by mean = 4.874, SD = 1.195. Last but not least, the lowest mean score for the green intellectual capital dimension is green structural capital, with a mean of 4.675, SD = 1.20196.
Descriptive Analysis of Sustainable Performance
The endogenous construct in this research is the sustainable performance which consists of five items. Seven-point Likert scale was used to measure the items. As shown in Table 4, the item SP3 indicating, We develop new products/services or improve existing products/services that are regarded as sustainable for society and environment scored the highest mean (mean = 4.98, SD = 1.254). Following this, item SP4 representing, Our reputation in terms of sustainability is better than the sustainability reputation of our competitors (mean = 4.94, SD = 1.365) on second rank, and the third rank goes to item SP5 indicating, Compared to our competitors, we more thoroughly respond to societal and ethical demands (mean = 4.91, SD = 1.392).
Next, the result shows that item SP2 with the score (mean = 4.65, SD = 1.513) proves that the respondents competitors consider them as a leading organisation in the field of sustainability. The lowest mean was gained by item SP1 representing, We are the first that offer environmental-friendly products/services at the marketplace (mean = 4.32, SD = 1.538). Overall, the mean score for sustainable performance from the respondents is above moderate level (mean = 4.7605, SD = 1.2663) indicating that the public sector used sustainable performance measure to ensure their organisation able to operationalise competitive advantage to meet the needs of organisation’s stakeholders and at the same time protecting the people welfare and environment.
Preliminary Assessment
Test of Normality
The purpose of assessing the normality of data is to identify the shape of data distribution. The normality of data for this study was evaluated using Mardia’s Multivariate Skewness and Kurtosis test. J. F. J. Hair et al. (2017) and Cain et al. (2017) suggested that the multivariate skewness and kurtosis are measured using the software available on the statistical analysis website. The analysis is available online at the following URL:https://webpower.psychstat.org/models/kurtosis/results.php?url=d0182f0e8e8caff6cd0617bc01ab49db
The rule of thumb for univariate skewness is in the range of -1 to 1, while univariate kurtosis should be in the range of -7 to 7 (Curran et al., 1996). Table 5 shows that the univariate skewness ranges from -0.305 to -0.495, and the univariate kurtosis ranges from 0.001 to 0.429. Also, the multivariate skewness and kurtosis were calculated for this study. Referring to Kline (2016), the multivariate skewness should be in the range of -3 to 3, while multivariate kurtosis should be in the range of -20 to 20. As shown in Table 6, the data proved that the multivariate skewness and kurtosis data are not normal, where the skewness (β = 2.856922, p< 0.01) and kurtosis (β = 30.167448, p< 0.01). Thus, all tests produced results showing that the normal distribution assumption of the data is violated, which calls for using Smart PLS, a non-parametric analysis tool.
Common Method Bias
Common method variance (CMV) is a systematic error variation that is shared between variables, particularly when the data were gathered using the same sources or techniques (Richardson et al., 2009). This study collect data from a single source that is through online survey questionnaire. A full collinearity test was performed to check the correlation matrix between constructs in the research model (Kock & Lynn, 2012). The linear regression analysis was employed to measure the relationships between the variables, in which the variance inflation factor (VIF) was used to indicate the degree to which one independent variable is explained by the other independent variables. A common cut-off value for tolerance should be more than 0.10, which corresponds to a VIF, must be less than 10 (Bougie & Sekaran, 2020; J. F. J. Hair et al., 2017). As seen in Table 7, the full collinearity assessment of VIF shows value between 3.600 to 4.238, so we can conclude that we do not have single source bias issue.
Structural Equation Modelling
A structural equation modelling analysis involved two analyses that is measurement model and structural model. The measurement model was used to measure the reliability and validity of the constructs. Specifically, the measurement model can be assessed to determine the construct reliability consisting of internal consistency reliability, average variance extracted, and discriminant validity through heterotrait-monotrait (HTMT) ration of correlation (J. F. J. Hair et al., 2017). Following that, the structural model assessed the path coefficients, the standard errors, t-values and p-values for the structural model.
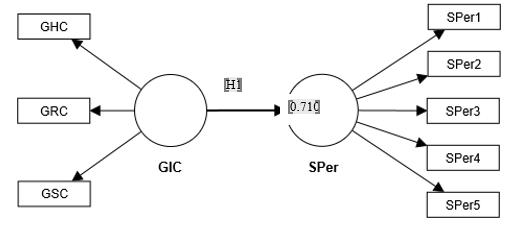
This research used structural equation modelling (SEM) to explain the relationships among multiple variables, which are green intellectual capital (dependent variable) and sustainable performance (dependent variable). This research model comprised multiple constructs that examine higher-order structures containing two layers of constructs, also known as higher-order or hierarchical component models (HCM) (Becker et al., 2012; Lohmöller, 1989). HCM comprises two elements: the higher-order component (HOC) and the lower-order components (LOCs). The HOC represents a more abstract higher-order entity, while the LOCs represent the subdimensions of the higher-order entity (J. F. J. Hair et al., 2017). Referring to Figure 1, green intellectual capital represents the HOC, while green human capital, green structural capital and green relational capital represent the LOCs.
In addition, the research framework illustrates the Type I model, reflective-reflective HCM, which indicates a reflective relationship between HOC and LOCs, and reflective indicators measure all first-order constructs. Due to that, a disjoint two-stage HCM analysis (Ringle et al., 2012; Sarstedt et al., 2019) were used to assess the research model. In the two-stage approach or the sequential latent variable score method, the latent variables scores were determined in PLE-SEM in the first-stage model without the second-order present. Then, this method uses the first-stage latent variables scores as indicators for the higher-order latent variable in a separate second-stage analysis (Chin, 1998; Lohmöller, 1989; Sarstedt et al., 2019). The following subsections discuss the assessments.
Measurement Model Assessment
The measurement model assessment consists of two primary assessments: convergent validity and discriminant validity. For this study, loadings, composite reliability (CR) and average variance extracted (AVE) were determined for the first-order and second-order constructs. J. F. J. Hair et al. (2017) and Ramayah et al. (2018) assert that the loading should be more than the threshold value of 0.708, which denotes a satisfactory degree of indicator reliability. In contrast, loading between 0.4 and 0.7 can be retained if the indicator has a CR value (>0.7) and an average variance extracted value (>0.5) (J. F. Hair et al., 2014). In Table 8, the AVEs are all higher than 0.5, and the CRs are higher than 0.7. Six items were deleted due to low loadings. Additionally, this research assessed the second-order construct's validity and reliability, namely green intellectual capital. Table 9 shows that the second-order measurements were also valid and reliable.
Next, in stage two, the discriminant validity was assessed using the HTMT criterion suggested by Henseler et al. (2015) and updated by Sarstedt et al. (2019). The assessment aims to ensure that the constructs measured are different from one another. According to Ramayah et al. (2018), The HTMT values should be ≤ 0.85 the stricter criterion and the mode lenient criterion should be ≤ 0.90. As shown in Table 10, all constructs were lower than 0.90, which concludes that the discriminant validity is established in the measurement model. In summary, both reliability and validity requirements are met for this study. The data can then be further examined for structural measurement.
Structural Model Assessment
As reported earlier in the normality test, the multivariate skewness and kurtosis showed that the data collected is not multivariate normal, Mardia’s multivariate skewness (β = 2.857, p< 0.01) and Mardia’s multivariate kurtosis (β = 30.167, p< 0.01), thus following the suggestions of J. F. Hair et al. (2019) we reported the path coefficients, the standard errors, t-values and p-values for the structural model using a 10,000-sample re-sample bootstrapping procedure (Ramayah et al., 2018). However, Hahn and Ang (2017) argue that the p-values are not good criterion for testing the hypothesis, therefore recommended to use a combination of criterions such as p-values, confidence intervals and effect sizes.
Table 11 shows the summary of the criterions we have used to test the hypothesis developed. The green intellectual capital was positively related to sustainable performance (β = 0.842, p< 0.01). The Upper limit (UL) was 0.876 and the Lower Limit (LL) was 0.798, which indicate the confidence interval is quite narrow, suggesting a high level of precision in the estimate. The effect size (f2) is 0.244, indicating a substantial effect.
The R2 value, in this context, is the coefficient of determination. It measures the proportion of the variance in the dependent variable (SP) that is explained by the independent variable (GIC) in the model. The R2 value of 0.710 means that approximately 71.0% of the variability in the dependent variable (SP) can be explained by the independent variable (GIC) in the model. In other words, the model, using GIC as a predictor, accounts for 71.0% of the variability observed in the variable to predict (SP). Thus, H1 were supported.
Discussion
This study aimed to investigate the effect of green intellectual capital on the sustainable performance of the public sector in Malaysia. The comprehensive analysis of the result presented in the previous section highlights the interrelation between the main variables in this study. The overall measurement model assessment presented in the preceding section confirmed the reliability and validity of all variables in first-order and second-order constructs.
Moreover, the structural model assessment confirmed the significant effect of green intellectual capital on sustainable performance, which was also found to be consistent with (Mohd-Yusoff, Yong, et al., 2020), in which green intellectual positively correlated to sustainable performance (economic, environmental and social performance). In other words, the study has provided evidence that green intellectual capital was found to have a significant influence on helping the organisation to achieve sustainable performance. Therefore, organisations are encouraged to develop management strategies and invest more in green intellectual capital (Khan et al., 2021). Training, development programs, and industrial linkages programs may contribute to the increase of green intellectual capital value, which in the end, the organisation will gain better sustainable performance.
Conclusion
This study has supported the evidence that investigating various environmental management strategies to overcome the sustainability issue in managing or operating an organisation is important nowadays. This trend has driven researchers towards exploring the impact in numerous sectors and industries, primarily in manufacturing industries (Albort-Morant et al., 2018; Liu et al., 2020; Wasim Syed et al., 2020), as the industry most likely contributes to adverse impact to the environment from their productions. However, there are some limitations when conducting this study as the studies in the public sector are still limited and not widely explored. Many have assumed that government services have the least contribution to environmental actions and low attention towards sustainable development and its goals. Thus, this study posed several practical contributions.
First, this study is believed to contribute to government management and operation policies to improve the current sustainable development implementation and achieve the sustainable development goals in 2030. The finding of this study is hoped to be among the benchmarking research to address the implementation of green intellectual capital in the public service sector, which is mostly not yet well established and recognised in the organisation, particularly in the Malaysian context.
Furthermore, this research finding is anticipated to assist the management in the public sector in developing a guideline for nurturing environmental knowledge within the intellectual capital of the public sector. Finally, this study intends to provide a number of strategies for the public organisation to achieve effective, sustainable performance, which will impact the nation’s sustainable development goals.
Acknowledgments
Nur`ain thanks the University of Technology MARA (UiTM) for the scholarship award to pursue her PhD at the University of Malaya. She also would like to thank the Ministry of Higher Education (MOHE) for the sponsorship and financial support for all expenses during her candidature.
References
Ahmad, J., Mustafa, H., Hamid, H. A., & Wahab, J. A. (2011). Knowledge, Attitude and Practices of Malaysian Society regarding Environmental Issues. Akademika, 81(3), 103–115. http://ejournals.ukm.my/akademika/article/view/488/4137
Albort-Morant, G., Leal-Rodríguez, A. L., & De Marchi, V. (2018). Absorptive capacity and relationship learning mechanisms as complementary drivers of green innovation performance. Journal of Knowledge Management, 22(2), 432–452. DOI:
Becker, J. M., Klein, K., & Wetzels, M. (2012). Hierarchical Latent Variable Models in PLS-SEM: Guidelines for Using Reflective-Formative Type Models. Long Range Planning, 45(5–6), 359–394. DOI:
Bernama. (2021). Three key areas in 12th Malaysia Plan to strengthen public sector. Bernama.
Bombiak, E., & Marciniuk-Kluska, A. (2018). Green Human Resource Management as a Tool for the Sustainable Development of Enterprises: Polish Young Company Experience. Sustainability, 10(6), 1739. DOI:
Bougie, R., & Sekaran, U. (2020). Research Methods For Business A Skill Building Approach (8th ed.). WILEY.
Burstroom, F. (2000). Environment and Municipalities. Stockholm, Royal Institute of Technology, Research School of Environmental Management.
Cain, M. K., Zhang, Z., & Yuan, K. H. (2017). Univariate and multivariate skewness and kurtosis for measuring nonnormality: Prevalence, influence and estimation. Behavior Research Methods, 49(5), 1716–1735. DOI:
Chang, C. H., & Chen, Y. S. (2012). The determinants of green intellectual capital. Management Decision, 50(1), 74–94. DOI:
Chen, Y.-S. (2007). The Positive Effect of Green Intellectual Capital on Competitive Advantages of Firms. Journal of Business Ethics, 77(3), 271-286. DOI: 10.1007/s10551-006-9349-1
Chin, W. W. (1998). Issues and Opinion on Structural Equation Modeling. MIS Quarterly.
Curran, P. J., West, S. G., & Finch, J. F. (1996). The Robustness of Test Statistics to Nonnormality and Specification Error in Confirmatory Factor Analysis. Psychological Methods, 1(1), 16–29. DOI:
Das, S. C., & Singh, R. K. (2016). (PDF) Green HRM and Organizational Sustainability: An Empirical Review. Kegees Journal of Social Science, 8(1and2), 227–236. https://www.researchgate.net/publication/320686237_Green_HRM_and_Organizational_Sustainability_An_Empirical_Review
Dwianika, A., & Gunawan, J. (2020). Sme’s green entrepreneurial intellectual capital. International Journal of Business, Economics and Law, 23(1), 322–332.
Economic Planning Unit. (2021). Twelfth Plan Pamphlet. https://rmke12.epu.gov.my/en
Elkington, J. (1998). Accounting for the triple bottom line. Measuring Business Excellence, 2(3), 18-22. DOI: 10.1108/eb025539
Gelhard, C., & von Delft, S. (2016). The role of organizational capabilities in achieving superior sustainability performance. Journal of Business Research, 69(10), 4632–4642. DOI:
Hahn, E. D., & Ang, S. H. (2017). From the editors: New directions in the reporting of statistical results in the Journal of World Business. Journal of World Business, 52(2), 125-126. DOI:
Hair, J. F. J., Hult, G. T. M., Ringle, C. M., & Sarstedt, M. (2017). A Primer on Partial Least Squares Structural Equation Modeling. In SAGE Publications, Inc. Printed (2nd Ed.). DOI:
Hair, J. F., Hult, T. M., Ringe, C. M., & Sarstedt, M. (2014). A Primer In Partial Least Squares Structural Equation Modeling (PLS-SEM). SAGE Publications, Inc.
Hair, J. F., Page, M., & Brunsveld, N. (2020). Essentials of Business Research Methods Fourth Edition. In Routledge Taylor & Francis Group. Routledge.
Hair, J. F., Risher, J. J., Sarstedt, M., & Ringle, C. M. (2019). When to Use and How to Report the Results of PLS-SEM. European Business Review, 31(1), 2–24. DOI:
Henseler, J., Ringle, C. M., & Sarstedt, M. (2015). A new criterion for assessing discriminant validity in variance-based structural equation modeling. Journal of the Academy of Marketing Science, 43(1), 115–135. DOI:
Huang, C.-L., & Kung, F.-H. (2011). Environmental consciousness and intellectual capital management: Evidence from Taiwan's manufacturing industry. Management Decision, 49(9), 1405-1425. DOI:
Irawan, D., Bastian, E., & Hanifah, I. A. (2019). Knowledge Sharing, Organizational Culture, Intellectual Capital, and Organizational Performance. Journal of Accounting and Investment, 20(3). DOI: 10.18196/jai.2003128
Khan, N. U., Wu, W., Saufi, R. B. A., Sabri, N. A. A., & Shah, A. A. (2021). Antecedents of Sustainable Performance in Manufacturing Organizations: A Structural Equation Modeling Approach. Sustainability, 13(2), 897. DOI:
Kline, R. B. (2016). Principles and Practice of Structural Equation Modeling. Guilford Press.
Kock, N., & Lynn, G. S. (2012). Lateral Collinearity and Misleading Results in Variance-Based SEM: An Illustration and Recommendations. Journal of the Association for the Information Systems, 13(7), 546–580.
Liu, J., Liu, Y., & Yang, L. (2020). Uncovering the influence mechanism between top management support and green procurement: The effect of green training. Journal of Cleaner Production, 251, 119674. DOI:
Lohmöller, J.-B. (1989). Latent Variable Path Modeling with Partial Least Squares. DOI:
Mohd-Yusoff, Y., Amirudin, A., Rahadi, R. A., Athirah, N. A. N. S., Ramayah, T., Muhammad, Z., Dal Mas, F., Massaro, M., Saputra, J., & Mokhlis, S. (2020). An investigation of pro-environmental behaviour and sustainable development in Malaysia. Sustainability (Switzerland), 12(17). DOI:
Mohd-Yusoff, Y., Yong, J. Y., Tanveer, M. I., Ramayah, T., Noor Faezah, J., & Muhammad, Z. (2020). A structural model of the impact of green intellectual capital on sustainable performance. Journal of Cleaner Production, 249(119334). DOI: 10.1016/j.jclepro.2019.119334
Nair, M. (2021). Revive economy by strengthening services sector | Free Malaysia Today (FMT). In Free Malaysia Today. https://www.freemalaysiatoday.com/category/opinion/2021/09/17/revive-economy-by-strengthening-services-sector/
Ramayah, T., Cheah, J., Chuah, F., Ting, H., & Memon, M. A. (2018). Partial Least Squares Structural Equation Modeling (PLS-SEM) using SmartPLS 3.0 (2nd Ed.). Pearson Malaysia.
Richardson, H. A., Simmering, M. J., & Sturman, M. C. (2009). A Tale of Three Perspectives: Examining Post Hoc Statistical Techniques for Detection and Correction of Common Method Variance. Organizational Research Methods, 12(4), 762-800. DOI: 10.1177/1094428109332834
Ringle, C. M., Sarstedt, M., & Straub, D. W. (2012). The Editor’s Corner Request Permissions / Order Reprints. MIS Quarterly, 36(1), iii–xiv.
Sarstedt, M., Hair, J. F., Jr., Cheah, J.-H., Becker, J.-M., & Ringle, C. M. (2019). How to Specify, Estimate, and Validate Higher-Order Constructs in PLS-SEM. Australasian Marketing Journal, 27(3), 197-211. DOI:
Shahzad, K., Arenius, P., Muller, A., Rasheed, M. A., & Bajwa, S. U. (2019). Unpacking the relationship between high-performance work systems and innovation performance in SMEs. Personnel Review, 48(4), 977–1000. DOI: 10.1108/PR-10-2016-0271
Von Malmborg, F. (2003). Environmental Management Systems: What is in it for Local Authorities? Journal of Environmental Policy & Planning, 5(1), 3-21. DOI:
Wasim Syed, M., Zu Li, J., Junaid, M., & Ziaullah, M. (2020). Relationship between human resource management practices, relationship commitment and sustainable performance. Green Finance, 2(3), 227-242. DOI:
Wong, L. (2019). Malaysia CO2 2019. The Edge Markets.
Xu, X.-l., & Liu, C. K. (2019). How to keep renewable energy enterprises to reach economic sustainable performance: from the views of intellectual capital and life cycle. Energy, Sustainability and Society, 9(1). DOI:
Yong, J. Y., Yusliza, M. Y., Jabbour, C. J. C., & Ahmad, N. H. (2019). Exploratory cases on the interplay between green human resource management and advanced green manufacturing in light of the Ability-Motivation-Opportunity theory. Journal of Management Development, 39(1), 31-49. DOI:
Yusoff, Y. M., Omar, M. K., Kamarul Zaman, M. D., & Samad, S. (2019). Do all elements of green intellectual capital contribute toward business sustainability? Evidence from the Malaysian context using the Partial Least Squares method. Journal of Cleaner Production, 234, 626-637. DOI:
Zan, Z. M., & Ngah, K. (2012). Local Agenda 21 Program Effectiveness In Seberang Perai Municipal Council, Penang, Malaysia. OIDA International Journal of Sustainable Development, 4(6), 25.
Copyright information

This work is licensed under a Creative Commons Attribution-NonCommercial-NoDerivatives 4.0 International License.
About this article
Publication Date
06 May 2024
Article Doi
eBook ISBN
978-1-80296-132-4
Publisher
European Publisher
Volume
133
Print ISBN (optional)
-
Edition Number
1st Edition
Pages
1-1110
Subjects
Marketing, retaining, entrepreneurship, management, digital marketing, social entrepreneurship
Cite this article as:
Achim, N., Rahman, N. H. A., & Kamil, N. L. M. (2024). Unlocking Malaysia's Sustainable Success: The Dynamic Link of Green Intellectual Capital. In A. K. Othman, M. K. B. A. Rahman, S. Noranee, N. A. R. Demong, & A. Mat (Eds.), Industry-Academia Linkages for Business Sustainability, vol 133. European Proceedings of Social and Behavioural Sciences (pp. 570-584). European Publisher. https://doi.org/10.15405/epsbs.2024.05.47