
Working Capital Management and Firm Performance: Evidence From Malaysia During COVID-19


Abstract
When it comes to the history of economic expansion, the management of working capital is widely regarded as an essential component of business success worldwide. Both before and throughout COVID-19, it is clear that companies operating in each area are inconsistent with one another. In this study, ten years' worth of data from 2012 to 2021 is collected from three different industries in Malaysia. The purpose of this research is to investigate how certain businesses have been able to sustain good performance over the years, even during a worldwide crisis that has affected the economy of the entire world. We chose these three industries—technology, consumer goods, and healthcare—because they have demonstrated the highest level of consistency in business performance over the years. The primary purpose of this research is to ascertain the reasons behind specific industries' success and identify the aspects of working capital management that are the most important contributors to the performance of businesses before and even after the COVID-19 outbreak. In general, the findings indicated that working capital is essential in driving the company's profitability.
Keywords: COVID-19, firm performance, ROA, ROE, working capital
Introduction
Iterating from previous studies such as (Al-Mawsheki et al., 2019; Essel & Brobbey, 2021; Hameer et al., 2021; Satoto et al., 2022), the components in working capital management have proven record of results toward the profitability of a firm. The connection between working capital management and profitability was proven even in different levels of optimisation by variables and different climatisation of firms based on the country. Managers should be aware of the importance of working capital management, which is the backbone of a firm's capital structure. Therefore, a necessary precaution should be considered more to maintain the stability and core maintenance of a firm and be kept to a certain degree of optimisation for there to be results in its performance (Tauringana & Afrifa, 2013). Due to the breakout of COVID-19 and the establishment of movement control orders (MCO) in Malaysia, there is some confusion and doubt about how businesses are directly affected in terms of working capital management and firm performance and whether there is a direct correlation or not (Hossain & Zariyawati, 2022). Firm performance is measured using the profitability ratio of return on asset (ROA), which will help determine how well a particular firm is doing compared to its peers. Moreover, ROA is a known form of determinant that many researchers use to measure the relationship between working capital management and firm performance (Azis et al., 2018). By utilising Thomson Reuters Datastream, we can fetch a few comparisons of industry sectors in Malaysia from 2012 to 2021 based on each respective average return on asset (ROA) to see the most consistent industry from before and during the pandemic. To see the most consistent firm, we assume that the top 5 of each year represented by the return on asset (ROA) is considered to be doing well over the years and is consistentng this will present an assumption to indicate how well a sector is doing in terms of its performance supported by the firms under its belts.
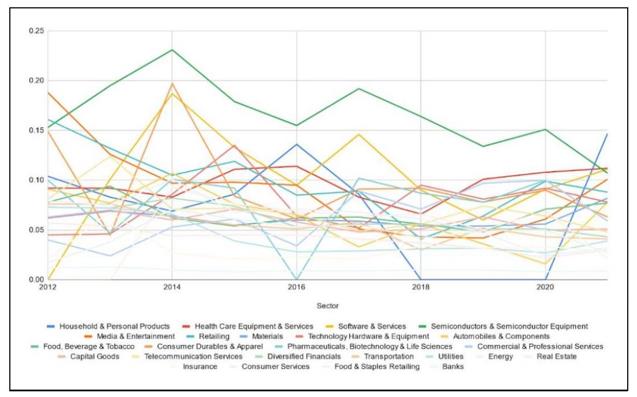
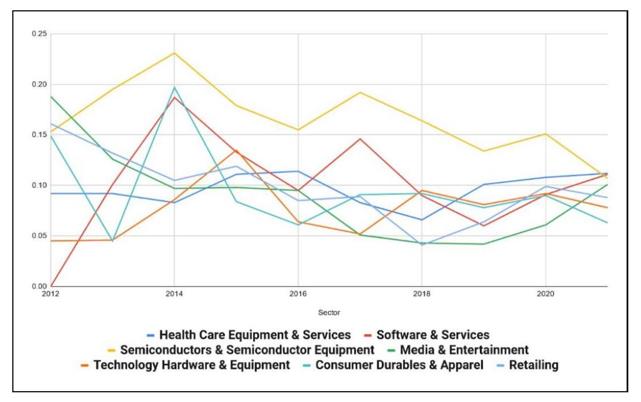
Figure 1 visually shows the movements of return on asset (ROA) of all the industries in Malaysia, which indicates that there are a few industries that generally have lower performance, higher performance, and also spiky fluctuations of return on asset (ROA). The performance could be attributed to the joiners and leavers per industry. By taking points of each industry in the chart, we can extract the most that has appeared in the top 5 per year, as shown in Figure 2. Figure 2 shows that the following industries have emerged as the best in performance: Semiconductors & Semiconductor Equipment, Software & Services, Consumer Durables & Apparel, Health Care Equipment & Services, Media & Entertaining, Retailing, and Technology Hardware & Equipment, in that order.
Based on the statistics and time series of each sector's performance, the question arises of why these industries are still consistent in firm performance and appear unaffected even throughout the COVID-19 period. The statistics stimulate the question does the specific industry have any advantage in terms of their working capital management by nature or have they adapted to the changes that come with the pandemic during the high tides? (Krammer, 2022). Could some working capital management components be responsible for these industries to keep themselves in check? Working capital components such as inventory days (INV) is an essential instrument for firm 2 performance (Akbar et al., 2021; Essel & Brobbey, 2021; Hameer et al., 2021). The ratio indicates that the ability of the firm to convert its inventory to sales will ensure that the firm can maintain its capability to continue the business. Other than that, other variables could play a significant role in the working capital management component, which are account receivables to sales (AR) and account payables to sales (AP). Account receivables to sales(AR) is responsible for the conversion of its current asset to sales, and depending on how fast the turnover of converting the credit sales will determine the profitability of its activities (Herison et al., 2022). On the other hand, account payables to sales (AP) is a liability that creates a debt obligation to a firm. The ratio directly affects how the working capital management will be handled to ensure there is room to make a profit without keeping a certain amount of obligations and bad debts (Akbar et al., 2021).
According to the variables that play the role of components in working capital management, it primarily relates to asset utilisation, especially inventory days (INV) and account receivables to sales (AR). Hence, if the asset utilisation is maintained perfectly through the decrease of its inventory days and its account receivables, will there be an increase in profitability or return on asset (ROA). Therefore, this study aims to examine whether the specific working capital components, such as inventory days (INV) and account receivables to sales (AR), are responsible for the consistency of specific sectors in the industry and the firm within respective sectors. In this paper, the researcher writes based on this sequence; Section 2 reviews the current field's literature. Section 3 develops the methodology and models. Section 4 summarises the major findings from the statistical analysis and the concluding remarks, including a recommendation in section 5.
Literature Review
Working capital management studies have always been utilised to corroborate corporate performance in some way. The importance of working capital management has many questions to be asked about how much it affects the firm performance. Working capital management has components that make up its whole such as inventory days (INV), accounts receivable to sales (AR), accounts payable to sales (AP), and firm size (SIZE). All these three components affect firm performance in the form of return on asset (ROA). Not every mentioned working capital component has a significant impact on the profitability of a firm, and not every variable will improve the firm performance. Inventory days (INV) and Account Receivable days (AR) have a significantly negative impact on return on asset (ROA). The negative relationship indicates that a firm will be able to gain more profitability if the firm decreases how long it holds onto its inventories before selling it. In addition, the higher the account receivable to sales (AR) is negatively related to the firm's performance, especially when the firm has slower collection processes of customers' debt (Hameer et al., 2021). The variables also interact through the usage of return on asset (ROE), with account payable to sales (AP) and days inventory (INV) both having a negative impact because the shorter the account payable cycle and inventory conversion period, the higher the company's profitability (Akbar et al., 2021). Inventory days (INV) negatively influence firm performance due to the firm's reduced sales (Satoto et al., 2022). Firms that are publicly listed will have more profitability when they maintain low inventory (INV) levels to minimise the opportunity cost of locking-up substantial amounts of funds unnecessarily in inventory (Essel & Brobbey, 2021).
According to some researchers, working capital management impacts firm performance negatively, but other studies have contradicted that there is also a positive correlation to firm performance. The statement means that more working capital components will result in more profitability, and lesser working capital components will be lesser profitability. The finding can be observed mainly towards account receivables to sales (AR) and in account payables to sales (AP). Lengthening the days in accounts payable to sales (AP) has increased the return on assets (ROA). The increase in accounts payable may increase the firm's profitability partly because well-established firms are given longer trade credit terms by their suppliers due to their long business relationships, and most of their purchases are in bulk orders (Hameer et al., 2021). Akbar et al. (2021) lend support to the argument, where they found that firm performance is positively affected by higher account receivables to sales (AR) as the more cash the firm can lend to the customer will lead to higher profitability. In contrast, according to the market performance (ROE), both account receivables to sales (AR) and accounts payable to sales (AP) is a positively significant determinants of ROE. The finding suggests that encouraging further investment in receivables and increasing the account payable deferral period can enhance the firm's market value. According to Satoto et al. (2022), people's purchasing power is deteriorating caused of the lower sales by firms, which affects the account receivable to sales (AR), positively impacting the firm performance. Firm performance is positively affected by accounts receivable to sales (AR) is when the receivables are collected by the business quickly and effectively and can turn into cash (Herison et al., 2022). The unwillingness of firms to settle their liabilities as in account payables (AP) on a faster note indicates that firms can maximise profitability by depending largely on trade credit facilities from suppliers (Essel & Brobbey, 2021).
There are instances when the outcomes of all studies on working capital management components and business performance are the same across researchers in different years and climates. However, there are also times when the results lead to different conclusions and different points of view. The most prominent finding is that inventory day (INV) negatively impacts firm performance and is consistent throughout various studies (Akbar et al., 2021; Essel & Brobbey, 2021; Hameer et al., 2021; Satoto et al., 2022).
The variables in working capital components have mixed findings regarding account receivables to sales (AR), whereby the decrease in account receivables will increase the firm profitability (Essel & Brobbey, 2021; Hameer et al., 2021). At the same time, there are moments when account receivables positively impact the firm performance (Akbar et al., 2021; Herison et al., 2022; Satoto et al., 2022). The different finding comes out as a question of why there are some moments where accounts receivable negatively and positively impact firm performance. Are the effects of different findings the result of control variables or climate and situational factors such as COVID-19? Other than that, there is also the case with account payables to sales (AP), which negatively impacts profitability (Akbar et al., 2021). However, other studies have shown that account payables positively impact profitability and that holding onto debts will create more benefits than meeting the due obligations and settling them (Essel & Brobbey, 2021; Hameer et al., 2021).
There are also a few variables that are considered when it comes to finding the results of certain independent variables to have any effect on firm performance. Many of the research that monitors the working capital management to firm performance is well associated with control variables that indicate whether the impact is direct or inevitable outside variable is also responsible for the changes in the outcome. The usage of firm size (SIZE) as a control variable can be seen from the number of sales by firms to determine if a small or larger size firm will have a negative or positive impact on firm performance (Al-Mawsheki et al., 2019; Anton & Nucu, 2021; Akbar et al., 2021; Essel & Brobbey, 2021; Hameer et al., 2021; Hossain & Zariyawati, 2022). Other than that, there is also the use of the current asset to total asset (CATA) ratio as a control variable because depending on the weightage of the current asset of a firm is responsible for certain variables to react and create either negative or positive impact on the firm performance (Al-Mawsheki et al., 2019; Akbar et al., 2021).
Working capital management does not only show significance and relationship towards firm performance based on metric values and assesses it through comparisons between different firms. Underlying previous instances such as the working capital management theories, can be an indicator of whether the connections of the variables have been proven. There are various theories regarding working capital management, and not all are applicable (Sim et al., 2018). One of the theories that are accepted is the trade-off theory. Trade-off theory states that a firm's ability to be more liquid will encounter low profitability problems (Jakpar et al., 2017). The liquidity of a firm can be seen through the meeting of short-term debt obligations of a firm, such as the account payables to sales (AP). Other than that, the prevalent theory seen at a managerial level is the agency theory. Agency theory states that the perspective of financial managers dictates the management and decisions regarding the utilisation of a business's short-term assets and liabilities (Aminu & Zainudin, 2015). The capability of financial managers to take charge of things such as receivables, payables and inventories in a firm could be related to how a firm performs.
Considering all of the literature and evidence, the general findings suggest that working capital management impacts firm performance in some ways in different countries and during a pandemic or crisis. Theories have also supported that certain variables and management have effects on terms of firm performance. However, they have yet to mention how certain firms have adjusted themselves to take advantage of certain working capital management components that have helped them to maintain the firm performance even before and during a pandemic.
Research Methodology
Data Source
A quantitative causal method was used in the research to evaluate the impact and relevance of independent variables on dependent variables. In order to construct our study, we used secondary data we retrieved from Thomson Reuters Datastream and used STATA 14 software to conduct the test and estimate the data such as the Levin et al. (2002), Im et al. (2003) and The Hadri (2000). Data collection was collected from the three sectors of firms in Malaysia for the period 2012 to 2021. We examined the data by selecting which industry has the highest and most frequent data in firm performance from the top 100 until we eliminated only the top 5 firm performance sectors per year from 2012 to 2021. This study investigates the relationship between the working capital components and firm performance during the COVID-19 crisis, whether it affects the company's performance or vice versa. With that said, stratified random sampling was included in our process by separating the population into non-overlapping groups through the disproportionate sampling of every number of companies per sector as shown in Table 2. Furthermore, we extracted 5 per sector and filtered it based on the most companies that have their public data in bursa from 2012 to 2021 depicted in Table 1. It helped us to choose which data we could manage and delete the unmanageable data even more. Finally, we analysed 15 companies in every three sectors, which are as follows: (i) Technology, (ii) Consumer, and (iii) Healthcare.
Variable Measurement (Dependent Variable)
The size of the firm is important for a company to manage their financial performance, however the rating of the companies based on the quantity of their assets will be pointless unless someone knows how successfully those assets are put to work for investors. In this study, the main dependent variable is Return on Assets (ROA) will be an indicator to measure the profitability of the firm itself, on how they manage their assets. ROA is calculated by dividing earnings before interest and taxes (EBIT) by total assets (Braimah et al., 2021; Obeng et al., 2021). Another variable that we used to examine the company financial performance was Return on Equity (ROE) where it is to measure how the shareholder effectively used the money to gain profit. Moreover, it also shows the return rate if the shareholders earned after reducing all the financing charges (Akbar et al., 2021). An effective company must have a comparison throughout their financial performance for them to look forward on how to manage their assets and equity for the firm to gain more profit, that is the reason why ROE must be included in a dependent variable so there will be no bias between one variable to another variable. Plus, it is easier for the researchers to make comparisons and make decision making to solve the problems in this study efficiently and effectively.
Variable Measurement (Independent Variables and Control Variable)
Table 3 summarizes the description of the variables employed in this study. Account receivable to sales (AR), account payable to sales (AP) and inventory days (INV) are the independent variables that will affect the return on assets (ROA) in results to show the firm’s profitability. Accounts receivable to sales (AR) are calculated by multiplying the number of days in a year by the accounts receivable over total annual revenue of a firm which reflects the average number of days the firm holds the stocks. Accounts payable to sales (AP) which the account payable days divided by the total revenue then multiply with 365 days. It is to measure how long the firm takes the average time to pay the suppliers as it will result in the higher the amount the longer the firm will take time to settle their payment to suppliers. Inventory days (INV) is calculated by dividing the inventory with sales and multiplying with 365 days (Raheman & Nasr, 2007)
In a previous study conducted by Raheman and Nasr (2007), they investigated the working capital management effect on the net profitability and liquidity of the firm. However, they found that there was a relationship between the firm’s profitability and working capital management which ultimately affected when they were using the average collection period, inventory days, average payment period, cash conversion cycle, current ratio, debt ratio, size of the firm and financial assets to total assets ratios as their independent variables.
Under return on equity (ROA) we have the firm size (SIZE) which is the average firm size calculated by dividing the number of employees by the number of firms. The next independent variable is the current assets to total assets ratio (CATA) which reflects the amount of total cash spent for the aim of working capital and provides a spotlight on the importance of a firm's current assets. It is important to note how much of that percentage of total assets is represented by current assets, as current assets are primarily involved in the development of working capital and also play an active role in improving liquidity. Lastly, our control variable is COVID-19 since we conducted this research to investigate whether this crisis of COVID-19 will affect all of the variables in the firm's performance of profitability and liquidity.
Data Analysis
Descriptive Analysis
Descriptive analysis is the first type of analysis concerning the data’s mean, standard deviation, variance, skewness, and kurtosis which this test is carried out to better comprehend its nature and characteristics.
The summary of the analysis discusses overall data statistics for three sectors, technology, consumer, and healthcare for the period from 2012-2021. Starting with dependent variables of return on assets (ROA) and return on equity (ROE) with an average of ROA is 0.1596267 while ROE is 0.2202783 where it shows that the return on assets (ROA) and return of equity (ROE) are two variables that determine the company’s efficiency to generate profits. Meanwhile, the financial performance of return on assets (ROA) in variance is 0.0193888, the standard deviation is 0.1392435, and the skewness and kurtosis are 3.411224 and 20.28901. Furthermore, the variance for return on equity (ROE) is 0.0338857, and the standard deviation is 0.1840808, while for skewness is 3.763647 and kurtosis is 23.18141.
Next, the independent variables which have a relation with the dependent variables, the average of inventory days (INV) is 69.78418, and variance and standard deviation are 4106.067 and 64.0786. The skewness and kurtosis of INV resulted in 2.128329 and 7.944774. The account receivables to sales (AR) and accounts payable to sales (AP) on average are 63.60098 and 44.1748 while the variance for both independent variables are 1111.725 and 634.6169. The standard deviation in descriptive analysis for AR and AP are 33.34254 and 25.1916 where the standard deviation of AR is more spread out than AP since the data of AR is higher than the AP. Last but not least is the analysis of asymmetry of distributions and the heaviness of distribution which is skewness and kurtosis in AR is 1.153606 and 3.936088 while for AP is 1.218066 and 4.516685.
The two last independent variables in descriptive analysis are the firm size (SIZE) and current asset to total assets (CATA). The mean of the firm size (SIZE) is 1829735, the variance is 9.66E+12, and the standard deviation is 3108141 while the skewness and kurtosis are 3.041456 and 12.61334. Current assets to total assets (CATA) is the last independent variable in this study where it shows the average of CATA is 0.5596895, 0.0351694 for variance, 0.1875351 for standard deviation, the skewness is -0.8651596 and kurtosis is 2.648851.
This study adopts Levin, Lin, and Chu (LLC) test, Im, Pesaran, and Shin (IPS) test, and Hadri test to check the presence of unit root in all variables. The tests conclude that the variables are stationary at levels and 1st difference order only such as lnROA, lnROE, and AR are at levels while for 1st difference order, dlnINV, AP, dlnSIZE, and also dlnCATA.
Poolability Test
The poolability test is used to assess whether a model is appropriate for panel data analysis. The Breusch Pagan Lagrange Multiplier (BPLM) test is used to examine whether or not the data set can be pooled for panel data analysis. The null hypothesis rejections imply that the set of data may be pooled, indicating that the following phase of the Hausman Specification test can be conducted to determine a panel data model for the regression analysis. If the test fails to reject the null hypothesis, the ordinary least squares (OLS) approach will be used.
When the p-value of Breusch Pagan Lagrange Multiplier (BPLM) is below 0.05, the null hypothesis may be rejected, it is suggesting that the panel set of data can be pooled. When the poolability test results were determined, the next process was to choose the best estimate to apply in the regression model. Greene (2008) proposed applying the Hausman specification test in such a situation as a solution to the question of whether to use the Random Effect model or the Fixed Effect model. The test is carried out to determine which panel data model should be used and whether it should be a random or fixed effect model. When the p-value of the Hausman specifications test is less than 0.05 which is p < 0.05, the null hypothesis can be rejected, showing that a fixed effect model is chosen. Otherwise, the model is a random effect where the p-value is p > 0.05.
Multicollinearity and Diagnostic Check
This test is used to determine collinearity (the connection between the independent variables). The goal is to establish their level of independence, or how separate they are from one another. Multicollinearity is a statistical phenomenon characterised by the strong correlation of one or more independent variables in a multi-regression model. In the case of strong multicollinearity, coefficient estimates may alter unpredictably in response to minor changes in the model or data. The Variance Inflation Factor (VIF) test was used in this study to determine if the multicollinearity issue exists in the regression models. If the result is more than 5, it implies that the issue of multicollinearity exists in the regression models and less than 5 shows that the problem of multicollinearity does not exist.
After that, to determine the relationship between the past value and future value, the panel serial correlation is used to be performed in this study. Not only that, the level of consistency in the data variance needs to be determined by using the heteroscedasticity which is appropriate for Fixed Effect to run the Modified Wald. In addition, both tests can be tested by testing based on the data p-value. A diagnostic check of the heteroscedasticity problem will appear when the p-value is less than 0.05 which indicates p < 0.05 as well as the serial correlation where the problem needs to be corrected.
Conceptual Framework and Formula
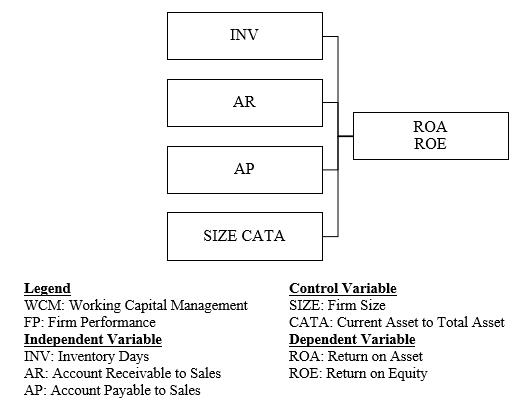
Figure 3 shows the research framework for this study. Working capital management is the process of transforming a company's investment in goods and accounts receivable into cash that can be used to pay its operating costs. As a result, working capital management is fundamental to the firm's day-to-day operations, as is enhancing corporate efficiency as measured by profitability. For this study, working capital management can be measured by various variables to ensure the efficiency of how the company can turn its profitability through working capital management and organizational performance.
The independent variables in the table above show the relationship between working capital management and firm performance where they have a connection when there are any changes in one variable towards another variable. For example, return on assets (ROA) has a relationship with inventory days since it shows the company’s ability to manage its assets and liquidity efficiently. In this case, the conceptual framework indicates that working capital management measures the independent variables that will affect the firm’s performance which is the dependent variable.
The effect of working capital management on firm performance is hypothesized as follows:
- Hypothesis 1(H1): Inventory days is negatively impacting firm performance.
- Hypothesis 2(H2): Account receivable to sales is negatively impacting firm performance.
- Hypothesis 3(H3): Account payable to sales is positively impacting firm performance.
- To test these hypothesis, two regression models were formulated as follows:
- ROAit = α + β1 INVit + β2 ARit+ β3 APit + β4 SIZEit + β5 CATAit [Model 1]
- ROEit = α + β1 INVit + β2 ARit+ β3 APit + β4 SIZEit + β5 CATAit [Model 2]
Where the ROA and ROE are measured on the firm’s profitability and performance respectively which firm i at year t, for the dependent variable ROA and ROE respectively. INVit, ARit, and APit are the working capital constituents for firm i at year t and represent the inventory turnover in days, account receivables in days and the account payables in days while for SIZEit denotes the firm size for firm i at year t, CATAit denotes the current assets to a total asset for firm i at year t respectively. For COVIDit is the control variable to measure the overall firm's performance and whether it gets affected or not for the firm i at year t.
Findings and Discussion
In this research, we have used both the dependent variables of return on asset (ROA) and return on equity (ROE) to create a non-biased assumption through the regression results of the relationship between the independent variables to the dependent variables. Table 4 shows the regression result for the first dependent variable i.e ROA meanwhile Table 5 shows the regression result for the second dependent variable i.e ROE. The result of the regression result is based on the corrected heteroskedasticity and serial correlation. To make it easier to read the regression results there will be tabulated results for an easier readability of the data and its significance as represented in Table 6 and Table 7.
Based on the regression results in Table 6, we can see that inventory day (INV) negatively impacts return on asset (ROA) but not significantly which is consistent with previous studies (Essel & Brobbey, 2021; Hameer et al., 2021). This shows that the lesser number of days that a firm converts its inventory to sales will be more profitable for firms. Other than that, we can also see those accounts receivable in sales (AR) has a significant negative impact on return on asset (ROA) and are similar to previous studies (Essel & Brobbey, 2021; Hameer et al., 2021). Account receivable to sales (AR) being lesser is important to a firm as it shows there is a big impact on the firm performance specifically towards return on asset (ROA).
On the other hand, some variables have a positive relationship towards return on asset (ROA) which are accounts payable to sales (AP) and this can be seen in previous studies as well (Essel & Brobbey, 2021; Hameer et al., 2021). This means that more accounts payable to sales (AP) will result in better firm performance. While on the control variables, SIZE is positively impacting just like in Hameer et al. (2021) and Essel and Brobbey (2021). The table also shows that CATA is also positively impacting return on asset (ROA) and this means that the more current asset that a firm holds will be more beneficial towards a better firm performance in terms of return on asset(ROA).
Based on the regression results in Table 7, we can see those inventory days (INV) are negatively impacted toward return on equity (ROE) but not significantly which is consistent with the previous study (Akbar et al., 2021). This shows that the lesser number of days that a firm converts its inventory to sales will be more profitable for firms even though the return will be on the equity side. Other than that, we can also see that accounts receivable to sales (AR) have a significant negative impact on return on equity (ROE). Account receivable to sales (AR) being lesser is important to a firm as it shows there is a big impact on the firm performance.
On the other hand, some variables have a positive relationship towards return on equity (ROE) which are accounts payable to sales (AP) and this can be seen in previous studies (Akbar et al., 2021). This means that more accounts payable to sales (AP) will result in better firm performance. While on the control variables, SIZE is negatively impacting return on equity (ROE). This could mean that the amount of profit a firm gets from return on equity (ROE) is not based on how big or small the firm is. The table also shows that CATA is positively impacting return on equity (ROE) and this means that the more current assets that a firm holds will be more beneficial towards a better firm performance in terms of return on equity (ROE).
Both of the results show that the most prominent variable that has a negative impact towards firm performance overall is inventory days (INV) and account receivable to sales (AR). Therefore, fail to reject H1 and H2. Inventory days (INV) is most consistent with various of other studies that shows the same as negatively impact to a firm performance (Akbar et al., 2021; Essel & Brobbey, 2021; Hameer et al., 2021; Satoto et al., 2022). The faster the inventory is transformed into sales the more profitable it will be and taking advantage on the use of its inventory conversion will result in a better firm performance. Account receivables to sales (AR) is also mostly negative impact with a level of significance for both dependent variable which just means it is very important towards a firm performance and is consistent with some studies (Essel & Brobbey, 2021; Hameer et al., 2021). While it is conflicted with other studies that show there is a positive impact to firm performance (Akbar et al., 2021; Herison et al., 2022; Satoto et al., 2022). This could mean that firm performance is also affected in the way that some firms require a higher amount of account receivables to sales (AR) so that it can rely more on its cash rather than using credit. Account payable to sales (AP) shows that both are positively impacting the firm performance and this is proven by other studies (Essel & Brobbey, 2021; Hameer et al., 2021).Thus, H3 fails to reject. but it is conflicting with certain study such as in Akbar et al., 2021 that states the account payable turnover has a negative impact towards firm performance. Most firms rely on their credits rather than cash and some firms may prefer to use cash basis.
Moreover, the control variables have shown the results similarly between two different dependent variables of return on asset (ROA) and return on equity (ROE) aside from SIZE being different in return on equity (ROE) which just means that the size of a firm has less value when in compared within the market value of a firm other than the whole firm performance. The positive impact of SIZE on firm performance can be seen because a bigger firm size determines that more sales can be generated to create more profitability for a firm (Essel & Brobbey, 2021; Hameer et al., 2021). Adding to that, current asset to total asset (CATA) showed both positive impact on firm performance as holding onto more current assets is necessary for a firm so it shows the short-term liquidity of the capital and ability to pay its short-term obligation (Sudiyatno et al., 2017).
Conclusion
Working capital management is the most important part of firm financial management decisions. The firm’s ability to continue operating for an extended period is determined by the way it manages and handles its investment in working capital management. Firms that can manage the trade-off between profitability and liquidity, can achieve the best-working capital management and firm performance.
This study presents empirical evidence for the effect of working capital management on the firm performance especially specific ones in the components of working capital management. This study has proven that the most important variable between all 3 sectors of Technology, Consumer, and Healthcare has taken advantage of how they manage their inventories by converting their inventories to cash and management of account receivables and account payables to ensure good firm performance. The data that we used supported that within years before the pandemic and during the pandemic to maintain the same performance at a good momentum is to ensure that working capital management must be adjusted for maximum capability of profitability. Firms must be able to ensure that their inventories are converted as fast as possible to ensure there is a stable cash inflow for firms. Next, firms must be able to maintain a certain amount of cash within the firm meaning having a lower cash collection will not represent any kind of greater liquidity risk as for debt obligations, the accessibility of having more credit will facilitate greatly better firm performance through cheap financing.
With all due said, more underlying working capital management components play more role in how some firms can ride onto a better foothold over time even during the worst of times such as the pandemic. It could be that the 3 successful sectors are handled within a boundary of other external factors such as economic factor and geographical factors. With that said, there could be potential for more research on how much other external factors have implications on working capital management and its firm performance.
References
Akbar, M., Akbar, A., & Draz, M. U. (2021). Global Financial Crisis, Working Capital Management, and Firm Performance: Evidence from an Islamic Market Index. SAGE Open, 11(2), 215824402110157. DOI:
Al-Mawsheki, R. M. S. A., Ahmad, N. B., & Nordin, N. B. (2019). The Effects of Efficient Working Capital Management and Working Capital Policies on Firm Performance: Evidence from Malaysian Manufacturing Firms. International Journal of Academic Research in Accounting, Finance and Management Sciences, 9(3). DOI:
Aminu, Y., & Zainudin, N. (2015). A review of anatomy of working capital management theories and the relevant linkages to working capital components: a theoretical building approach. European journal of business and management, 7(2), 10-18.
Anton, S. G., & Nucu, A. E. A. (2021). The Impact of Working Capital Management on Firm Profitability: Empirical Evidence from the Polish Listed Firms. Journal of Risk and Financial Management, 14(1), 9. DOI:
Azis, M., Rohansyah, M., Azis, M. D., Rosikah, & Prananingrum, D. (2018). Effects of return on asset, return on equity, earning per share on corporate value. The International Journal of Engineering and Science (IJES), 7(3), 6-14.
Braimah, A., Mu, Y., Quaye, I., & Ibrahim, A. A. (2021). Working Capital Management and SMEs Profitability in Emerging Economies: The Ghanaian Case. SAGE Open, 11(1), 215824402198931. DOI:
Essel, R., & Brobbey, J. (2021). The impact of working capital management on the performance of listed firms: evidence of an emerging economy. International Journal of Industrial Management, 12(1), 389–407. DOI:
Greene, W. H. (2008). Econometric Analysis (6th Ed.). Pearson Prentice Hall.
Hadri, K. (2000). Testing for stationarity in heterogeneous panel data. The Econometrics Journal, 3(2), 148-161. DOI:
Hameer, N. A. B. A., Ramakrishnan, S., & Hassan Gillani, S. M. A. (2021). The Impact of Working Capital Management on Firm Performance across Bumiputera and Non Bumiputera Manufacturing Firms in Malaysia. Studies of Applied Economics, 39(4). DOI:
Herison, R., Sahabuddin, R., Azis, M., & Azis, F. (2022). The effect of working capitalturnover, accounts receivable turnover and inventory turnover on profitability levels on the Indonesia Stock Exchange 2015-2019. Psychology and Education, 59(1), 385-396.
Hossain, M. R., & Zariyawati, M. (2022). Uncertainty in Working Capital Management and Firm Performance: A COVID-19 Perspective. International Journal of Economics and Management, 16(Special Issue 1), 117-130. DOI:
Im, K. S., Pesaran, M. H., & Shin, Y. (2003). Testing for unit roots in heterogeneous panels. Journal of Econometrics, 115(1), 53-74. DOI:
Jakpar, S., Tinggi, M., Siang, T. K., Johari, A., Myint, K. T., & Sadique, M. (2017). Working capital management and profitability: Evidence from manufacturing sector in Malaysia. Journal of Business & Financial Affairs, 6(2), 1-9.
Krammer, S. M. S. (2022). Navigating the New Normal: Which firms have adapted better to the COVID-19 disruption? Technovation, 110, 102368. DOI:
Levin, A., Lin, C.-F., & James Chu, C.-S. (2002). Unit root tests in panel data: asymptotic and finite-sample properties. Journal of Econometrics, 108(1), 1-24. DOI:
Obeng, H., Kobina Enos, B., & Yensu, J. (2021). Working capital management, working capital policy, and firm performance in Ghana: empirical evidence using a dynamic system GMM. African Journal of Business and Economic Research, 16(1), 249-271. DOI:
Raheman, A., & Nasr, M. (2007). Working capital management and profitability–case of Pakistani firms. International review of business research papers, 3(1), 279-300.
Satoto, S. H., KP, H. N., & WS, S. B. (2022). Working Capital Management Before and During the COVID-19 Pandemic and their Effect on Profitability in Manufacturing Companies Listed on the Indonesia Stock Exchange. International Journal of Economics, Business and Accounting Research (IJEBAR), 6(3), 2119-2126.
Sim, S. L., Ali, A., & Ling, S. Y. (2018). A conceptual paper on working capital management theories. International Journal of Management and Business Research, 8(4), 13-28
Sudiyatno, B., Puspitasari, E., & Sudarsi, S. (2017). Working capital, firm performance, and firm value: An empirical study in manufacturing industry on Indonesia stock exchange. Economics World, 5(5), 444-450.
Tauringana, V., & Afrifa, G. A. (2013). The relative importance of working capital management and its components to SMEs' profitability. Journal of Small Business and Enterprise Development, 20(3), 453-469. DOI:
Copyright information

This work is licensed under a Creative Commons Attribution-NonCommercial-NoDerivatives 4.0 International License.
About this article
Publication Date
06 May 2024
Article Doi
eBook ISBN
978-1-80296-132-4
Publisher
European Publisher
Volume
133
Print ISBN (optional)
-
Edition Number
1st Edition
Pages
1-1110
Subjects
Marketing, retaining, entrepreneurship, management, digital marketing, social entrepreneurship
Cite this article as:
Halim, U. A. A., Ghazali, G. S., Zulkifli, F. H., Bujang, I., & Beli, S. R. (2024). Working Capital Management and Firm Performance: Evidence From Malaysia During COVID-19. In A. K. Othman, M. K. B. A. Rahman, S. Noranee, N. A. R. Demong, & A. Mat (Eds.), Industry-Academia Linkages for Business Sustainability, vol 133. European Proceedings of Social and Behavioural Sciences (pp. 368-384). European Publisher. https://doi.org/10.15405/epsbs.2024.05.31