
Liquidity M2, Inflation, and Sukuk Issuance: Empirical Evidence


Abstract
The volume of sukuk issuance is expanding day by day, which book a high place in the global finance market, requiring developers and researchers to spend more time on this topic. This study investigates the relationship between liquidity M2 and inflation rate with the Sukuk Issuance Volume in the Short and Long Runs in Malaysia. The current study uses an econometric approach to reveal this relationship by applying the model of ARDL and the Cointegration test. The data of this study started from the fourth month of 2011 to the end of 2020. The result of this study shows that there is a high cointegration relationship of the equation in the long-term. In addition, liquidity M2 (LM2) does not affect the on sukuk issuance volume (SIV) in the long-term, while it negatively influences SIV in the short-term. The inflation rate (INFL) negatively affects SIV in the long-term, while INFL positively influences SIV in the short term. This study contributes to the existing literature with the finding of LM2 on SIV in both short-term and long-term in Malaysia.
Keywords: Autoregressive Distributed Lag (ARDL), Inflation Rate (INFL), Liquidity M2 (LM2), Long Run, Sukuk Issuance Volume (SIV), Short Run
Introduction
Sukuk instrument has become the most appealing product of Islamic finance since it pays no interest (no riba) as well as provides a good profit on investment through ownership (Al-Fakih et al., 2022). More crucially, during the last financial crisis, the volume of sukuk issuance grew in popularity, and worldwide investors were drawn to the investment in sukuk instrument (Bhuiyan et al., 2020). Despite the increasing of sukuk issuance in Islamic financial market, there are several factors those may represent risks on sukuk and reduce the volume of sukuk issuance in finance markets. In addition, some of these factors are inflation rate and liquidity rate and others (Alswaidan et al., 2017). As a result, these factors must be considered, as the Islam principles permit and encourage cautious efforts in risk mitigation to yield substantial insights. Not only did the sukuk continue to grow in 2020, but the first market issuances established a new high compared to previous years (IIFM, 2021).
The presence of issuers and investors in many existing locations as well as new participants in sukuk issuances has helped sukuk maintain its position as a primary growth engine in the Islamic financial industry. Furthermore, increased focus on relevant ESG and technology adoption, as well as the use of sukuk as an investment instrument for project finance and inclusion by major index providers, have all contributed to the sukuk market's exceptional positive trajectory. Malaysia is still the leader of the sukuk instrument market and has a percentage of seventeen percent from the assets within worldwide Islamic finance (Al-Fakih et al., 2022). Malaysia maintained its top position in the issuance of sukuk between 2001 and 2020, with a cumulative international and local issuance of roughly USD 800 billion (IIFM, 2021).
In this study, we investigate the relationship between the inflation rate and liquidity M2 in terms of short and long in Malaysia as a contribution to the existing literature. Therefore, the next section will list some of the literature reviews about the variables of the study.
Literature Review
Sukuk Issuance Volume
Based on Arabic language sukuk is a plural of 'Sakk' which also known as Islamic bond (Chong, 2021). Sukuk is a certificate of assets investment ownership which the issuances need underlying assets (Iftikhar, 2022). Sukuk is a financial instrument in the Islamic finance market which fundamentally target the sector of corporates as well as the high wealth of individuals (Jahan et al., 2021). The increasing of sukuk issuance volume refers to a positive reaction from the investors, which may be expected that this volume will maintain to increase in the future (Effendi, 2021).
Liquidity M2
According to Sayedy and Ghazali (2017), the broad sense of second (M2) money supply type includes short-term deposits and savings made at financial institutions, as well as some market-based pools of money. One sort of liquidity that may have an effect on the volume of sukuk issuance is liquidity M2, which will be taken into account in the current study.
Inflation Rate
The inflation rate can represent a risk and affects the investments revenues. The risk of inflation defined as a risk, which the return of investment cannot cover the decreasing of money value due to the high inflation (Bartram et al., 2015; Paul et al., 2021). Therefore, the inflation leads to the currency dropping. In terms of sukuk, inflation refer to the drooping of sukuk investors' currency power in the future for principal and return payments (Rauf & Lebbe, 2018). Thus, risk of the inflation come from the difference between the return in the future and the decreasing of the money power. As a result, the return will be less than the drop of the purchasing power.
Methodology of the Study
Data and Sources
The current study is using the secondary data that gathered monthly from April 2011 to December 2020 including hundred and seventeen observations from the database of Thomson Reuters. The Sukuk Issuance Volume (SIV) represents the dependent variable in the present study, while the Liquidity M2 and Inflation Rate represent the independent variables of this study. Moreover, there are other sources of the literature review used in this study.
The Method of Analysis
The econometric approach was applied in this quantitative study. Thus, the method of Autoregressive Distributed Lag (ARDL) as well as Cointegration test will be used in the current study as a regression method of a multiple linear. Furthermore, the researcher will use the software version of E-views 12 to reveal the short- and long - run among these variables.
The Model
The method of ARDL can differentiate between the response of dependent variable in long run and short run to each unit of independent variables changing. Thus, the study model can be design as follows:
Δ SIVt = β0 + β1 Δ SIVt-i + β2 Δ LM2t-i + β3 Δ INFLt-i + θ1 SIVt-i + θ2 LM2t-i + θ3 INFLt-i + εt ………………. (Equation 1)
Where:
SIV t: Malaysian sukuk issuance volume of the same level.
SIV t-i: Malaysian sukuk issuance volume lag.
LM2 t-i: Malaysian liquidity M2 lag.
INFL t-i: Malaysian inflation rate lag.
εt represent error terms that reflex the other variables which are not involved in the present study model.
β1 β2 β3: represent the coefficients of the variables in short-term.
θ1 θ2 θ3: represent the coefficients of the variables in long-term.
β0: represents the Constant.
k: represents the Lag length.
i: represent the Lag order.
δ: is the coefficient of the Error Correction Term (ECT), which demonstrates the adjustment speed from the short run to the long run balance. The result of ECT have to be negative as well as significant to reflex the validity of the study model.
The Study Result
The Study Variables’ Data Graphs
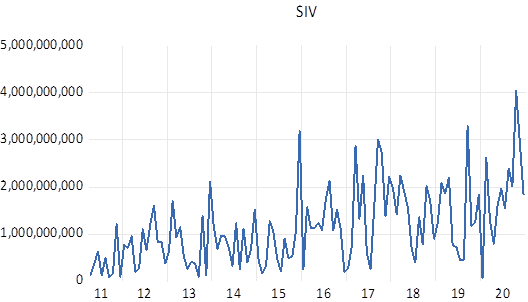
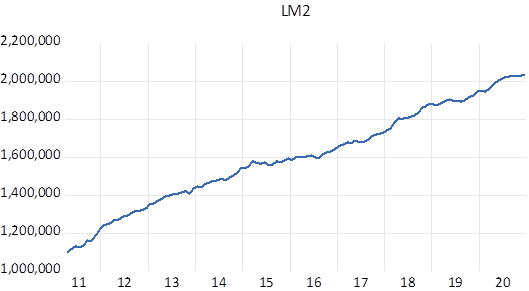
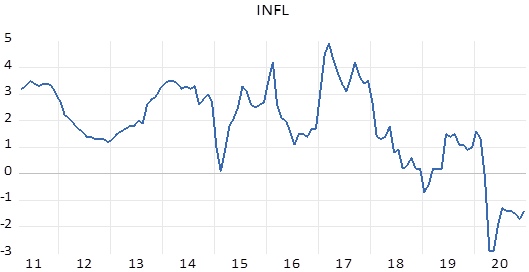
To start the analysis of the econometric approach, the researcher needs to look at the data at the beginning. The next graphs present the data of study variables during the period of the current study. The figure 1 indicates the sukuk issuance volume in Malaysia from April 2011 to the end of 2020 as a dependent variable in the model of this study. The figure 2 shows the data of Liquidity M2 in Malaysia for the same period, while the figure 3 presents the data of inflation rate in Malaysia as the independent variables of the present study.
The Result of Stationary Test
The stationary test is applied to reveal whether the data of the study variables are stationary or not at three standards at level which means that the data of the variable are stationary at I(0), at first difference which means that the variable data are stationary at I(1), or at second difference which mean that the data of the variable are stationary at I(2). The most popular test can use for this purpose is Augmented Dickey Fuller (ADF) to test the unit root. The result of stationary test is presented in table 1.
The above table shows that the data of study variables are stationary at I(0) and I(1) which allows the researcher to use the ARDL method that cannot be used if there is one or more variables are stationary at I(2) second difference. As the result of the table, SIV as a dependent variable is stationary at I(0) at the level, while both independent variables are stationary at I(1) at first difference.
The Optimal Lag Length Result
The study optimal lag length can be found by this test through many criteria’ result which can be presented in Table 2:
As appeared in the above table there are five criterions used from E-Views to find the optimal lag of the study model. Two criterions refer to lag 1 which they are HQ and SC criterions. Whereas three criterions indicate to lag number 2 which they are AIC, FPE and LR criterions.
ARDL Estimation Result
In this study as mentioned before used ARDL model to know the effect of liquidity M2 and inflation rate on the sukuk issuance volume in Malaysia during the predetermined period. Table 3 indicates that the model result relies on Criterion of Akaike Information (1,1,2).
Based on the above table, the value of R=squared is 91.5% which is high value close to one or 100%. The result means that the current study’ independent valuables namely, liquidity M2 and inflation rate explain a high percentage of sukuk issuance volume gross changing in Malaysia. In addition, value of F-statistic is 8.303735 while the probability value of F-statistical is 0.0000 which is very significant at less than one percentage point. The very significance of F-statistic P. value indicates that the model of this study is perfect in terms of the variables. Furthermore, Durbin Watson value is 1.930022 which is between two critical values which are 1.38-2.62. This Durbin Watson value of the current study prove there is no correlation within the series of study variables.
Autocorrelation Test Result
As the value of Durbin Watson confirmed there is no correlation within the series of variables in this study. This test can be applied separately to prove that. Table 4 presents the Autocorrelation test result.
As the result of the above table the probability value of both F-statistic and Obs*R-squared are more than 5 percentage points. Therefore, the researcher accepts the null hypothesis which prove that the are no serial correlation in this study at lag number 2.
Heteroskedasticity Test Result
In order to know the variance homogeneity of the study variables, the test of Heteroskedasticity can be used and the results of the hetroskedasticity are displayed in table 5.
According to the above table, all P. values are bigger than 5 percent. Thus, the author accepts the null hypothesis and not be rejected which means there is no heteroskedasticity.
The Cointegration Test result
The researcher used the test of cointegration to know the impact of liquidity M2 and inflation rate on sukuk issuance volume in the long run. The result of test of cointegration are reported in table 6.
EC = SIV - (1776.5497*LM2 - 12121993.5220*INFL + 1865806996.4045)
From the above table the LM2 coefficient is 1776.5497 and its P. value is 0.1460. As a result, the impact of liquidity M2 on sukuk issuance volume in long-term is positive but not significant at 14.6%. In terms of inflation rate, coefficient is -12121993.5220 and its P. value is 0.0060. Therefore, the effect of INFL on SIV in long-term is negative and very significant at less than one percent. In addition, constant coefficient showed at 1865806996.4045 and its P. value is 0.0076.
Short Run Results
The result of impact of LM2 and INFL on SIV in the short run can be known by using Error Correction Model of ARDL. The short term results are presented in table 7.
Cointegrating Equation:
D(SIV) = -0.894216647305*(SIV(-1) + (1776.54974325*LM2(-1) - 12121993.52197804*INFL(-1) + 1865806996.40447354))
From the above table can see the coefficient of D(LM2) is -18199.60 and its P. value is 0.0005 that refers to the factor of liquidity M2 has negative high significant effect on sukuk issuance volume in Malaysia in short-term. In addition, the D(INFL) coefficient is 29845065 and its P. value is 0.0000 which indicates that inflation rate has very significant positive impact on SIV in Malaysia in short-term. Moreover, it is same relationship for D(INFL(-1)). Furthermore, the CointEq(-1) coefficient is -0.894216647305 and it has 0.0000 P. value that prove the relation between the variables of the present study is very perfect. In addition, error term has negative signal which means that the errors within short-term adjust or converge to long-term equilibrium by speed at 89.4%.
Cointegration Bounds Test results
The test of bounds applies to reveal whether the study variables have relationship in long-term or not. The result of cointegration (bounds test) are showed in table 8.
From the bounds test results table, the K represents the independent variables numbers which in the current study are two variables LM2 and INFL. The very significant result of the table is the value of F-statistic of bounds test that is 13.64262. Therefore, when compare between this result ant the critical values in the two areas I(0) and I(1). As it is clear the F-statistic value is larger than the biggest value at the bounds’ static. This refers to that the study variables have a high relationship in long-term. Lastly, the actual sample size is 115 after use two lags.
Visualizing the Long-Term Equation Fit, and Sukuk Issuance Volume
In this part will visualize sukuk issuance volume as dependent variable and long-term equation by ECT without sukuk issuance volume. Therefore, the long-term line is representing the ECT cointegration relationship after subtracting sukuk issuance volume. Thus, the visualizing of long term fit for equation is showed in figure 4.
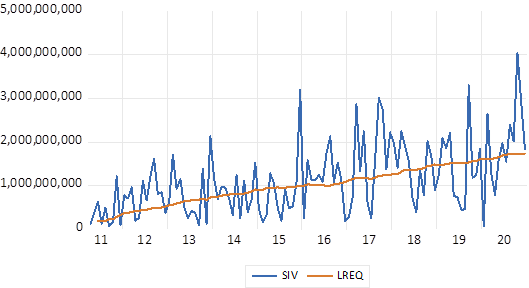
From the above figure can see the cointegration relationship clearly between sukuk issuance volume and equation of the current study (without SIV) in the long-term. This relationship is going within the same path. As it shows, the SIV in long-term by blue colour while of other variables without SIV in long-term by brown colour. To illustrate that, the study regression applied in order to investigate the rate of adjustment.
Stability Test results
Figure 5 indicates the Cumulative Sum test (CUSUM) is applying in the current study to investigate the stability of the study model.
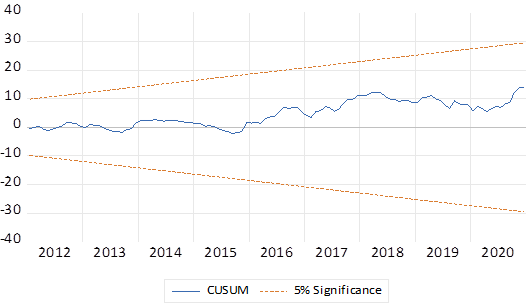
From the above figure, the test of stability (CUSUM) is at 5 percent. That means the model of this study consistent with the time. The recursive depicted residuals are within the reliable prescribed range or between both crucial lines. This is demonstrating that the factors of this study have a long run connect with the parameter values stability.
The Study Discussion
In the discussion section, we will present the study results and compare the results of previous studies that focused on similar factors. As already mentioned in this study, the independent variables are two which they are LM2 and INFL, while SIV is the dependent variable. Many studies in the past tried to examine some factors of liquidity on SIV, but this study is the first to focus on the effects of LM2 on SIV. Thus, the main contribution of the current study is to investigate the relationship between LM2 and SIV. Based on many previous studies focused on the relationship between liquidity and sukuk issuance volume, Ahmad and Radzi (2011) attempted to examine the effect of reserves except gold on SIV. The result showed that reserves without gold have a positive significant effect on SIV only in the short run. Another study by Doktoralina and Nisha (2019) between liquidity (not including M2) and SIV. The result presented that liquidity influences SIV positively in the state of Indonesia. Sudarsono and Saputri (2018) studied the effects of liquidity (financial ratios to deposit) on SIV in the short- and long-term. The finding in the short term said that this type of liquidity affects SIV significantly positively, while eventually the impact is non-significant negative. Nevertheless, the results of the current study are shown in Tables 6 and 7 for long- and short-term. The long-term result said that LM2 has positive but non-significant, which means there is no impact in the long run. This result may be because LM2 was already invested in the previous investments. This result is inconsistent with the study of Sudarsono and Saputri (2018), even though the type of liquidity is different. However, this study is the first to focus on the long-term impact of LM2 on SIV. LM2 has a very significant negative effect on SIV in the short term, which means that high LM2 decreases SIV and vice versa. This result not consistent with any previous study because there is no previous study has investigated the impact of LM2 on SIV. The reason for the negative relationship result is that Malaysians prefer to maintain their LM2 of liquidity in their saving accounts.
For the second factor which is inflation rate, most of the previous studies focused on the relationship between INFL and SIV in short-term except Juaris et al. (2018), which studied the effects of inflation on SIV in Indonesia in short-term and long-term. His result showed that there are no impacts of inflation rates on SIV of Indonesian Government in short-term and long-term. Moreover, another study done by Elkarim (2012) about the effects of inflation on SIV. The results showed that INFL makes a negative impact on SIV in short-term. However, the result of Said and Grassa (2013) study revealed that INFL has no significant impact on SIV. In the contrary, Rauf (2015) found that INFL affects SIV positively in market of Dubai sukuk. However, the result of the present study presented in tables number 6 and 7 about the relationship between INFL and SIV in long-term and short-term. The long-term result said that INFL has a negative significant impact on SIV. This result does not consistent with Juaris et al. (2018) study as it is only one that focused on this relationship in the long-term. This relationship means that when the inflation rate is high, the issuance of sukuk will decrease and vice versa. The reason for this is the decrease in purchasing power of the fund and the reduction in the value of sukuk returns in long-term. In terms of the short-term results of the current study, INFL influences SIV significantly positively. This result is consistent with the study of Rauf (2015). This relationship is due to the belief of investors that the short-run maturity period has less uncertainty and risk than the long run, and that the sukuk instrument can be used as a tool to overcome short-term inflation. Therefore, when inflation is high, the issuance of sukuk will increase and vice versa.
Conclusion
Based on the results of the current study, the authors obtained several conclusions from using the data of SIV in Malaysia from the fourth month in 2011 until the end of 2020, which still witness a high volume of the issuance. According to the present methodology, there is a long run cointegration relationship between the independent variables (LM2 and INFL) and dependent variable (SIV), and their direction is the same as shown in Figure (4). In conclusion of the results of the study variables, LM2 had no significant impact on SIV in the long term, whereas INFL had significant negative effects on SIV in the long term. On the other hand, both variables LM2 and INFL have significant impacts on SIV in the short-term, but LM2 is negative and INFL is positive in Malaysia during the study period.
The present study contributes to the existing literature by doing the examining of the relationship between liquidity M2 of money supply on the sukuk issuance volume in both short-term and long-term in Malaysia market and can apply the result on the other markets. The reason of chosen Malaysian sukuk market is because that Malaysia is leader country in the Islamic financial industry as well as the sukuk portion still at 17% from the assets of global Islamic finance (Al-Fakih et al., 2022). In addition, for the future studies, the researchers may examine the impact of LM2 and INFL on SIV in other countries and adding variables and data based on the available database.
Acknowledgements
We wish to extend our gratitude to the Faculty of Business and Management, UiTM and Research Management Centre of UiTM for their financial support, which made this research possible.
References
Ahmad, W., & Radzi, R. M. (2011). Sustainability of Sukuk and Conventional Bond During Financial Crisis: Malaysia’s Capital Market. Global Economy and Finance Journal, 4(2), 33-45.
Al-Fakih, D. H. S., Zakaria, S., & Ismail, M. K. A. (2022). Does the Influence of Economic, Social and Legal Factors Enhance Sukuk Market Development? A Comprehensive Review. Korea Review International Studies, 15(Special Issue 04), 1-12.
Alswaidan, M. W., Daynes, A., & Pasgas, P. (2017). Understanding and evaluation of risk in Sukuk structures. Journal of Islamic Accounting and Business Research, 8(4), 389-405. https://doi.org/10.1108/jiabr-05-2015-0021
Bartram, S. M., Brown, G. W., & Waller, W. (2015). How Important Is Financial Risk? Journal of Financial and Quantitative Analysis, 50(4), 801-824.
Bhuiyan, R. A., Puspa, M., Saiti, B., & Ghani, G. M. (2020). Comparative analysis between global sukuk and bond indices: value-at-risk approach. Journal of Islamic Accounting and Business Research, 11(6), 1245-1256.
Chong, F. H. L. (2021). Enhancing trust through digital Islamic finance and blockchain technology. Qualitative Research in Financial Markets, 13(3), 328-341.
Doktoralina, C. M., & Nisha, F. M. (2019). Mudharabah Deposits Among Conventional Bank Interest Rates, Profit-Sharing Rates, Liquidity and Inflation Rates. International Journal of Financial Research, 11(1), 25.
Effendi, J. (2021). Potential of Islamic Insurance Market: Islamic Banking and Sukuk Sectors Case Study in Indonesia. Global Review of Islamic Economics and Business, 9(1), 097.
Elkarim, G. A. (2012). Factors Influence Sukuk and Conventional Bonds in Malaysia [Doctoral Dissertation, Universiti Utara Malaysia].
Iftikhar, S. (2022). Blockchain Based Retail Sukuk for Infrastructure Development and Financial Inclusion in Pakistan. Journal of Business Administration and Management Sciences (JOBAMS), 4(1), 42-57.
IIFM (International Islamic Financial Market). (2021). IIFM Sukuk Report 2021, 11th Edition. https://www.iifm.net/sukuk-reports
Jahan, S., Muneeza, A., & Baharuddin, S. H. (2021). Islamic Capital Market for Social Development: Innovating Waqf Mobile Sukuk in Sub-Saharan Africa. International Journal of Management and Applied Research, 8(2), 141-154.
Juaris, J., Masbar, R., & Seftarita, C. (2018). Analysis of The Effect of Monetary Policy on Government Sharia Securities (SBSN) in Indonesia. Sriwijaya International Journal Of Dynamic Economics And Business, 2(2), 109.
Paul, F. H., Saeed, A. F., & Khattak, S. W. (2021). Asymmetric Impact of Uncertainty and Political Risk on Foreign Direct Investment: An Empirical Study of South Asia. Pakistan Journal of International Affairs, 4(4), 1-20.
Rauf, A. L. A. (2015). Relationship Between Risk and Return in Sukuk Market. [Doctoral Dissertation, Universiti Utara Malaysia].
Rauf, A., & Lebbe, A. (2018). Relationship between Risk and Return in Sukuk Market: Evidence from Bahrain, UAE and Malaysia. AJIRSET, 1(5), 1-7.
Said, A., & Grassa, R. (2013). The Determinants of Sukuk Market Development: Does Macroeconomic Factors Influence the Construction of Certain Structure of Sukuk?. Journal of Applied Finance & Banking, 3(5), 251-267.
Sayedy, B., & Ghazali, M. Z. (2017). The Impact of Microeconomic Variables on Stock Return by Moderating of Money Supply. Asian Social Science, 13(12), 191.
Sudarsono, H., & Saputri, M. A. (2018). The Effect of Financial Performance toward Profit-Sharing Rate on Mudharabah Deposit of Sharia Banking in Indonesia. Muqtasid: Jurnal Ekonomi dan Perbankan Syariah, 9(1), 82.
Copyright information

This work is licensed under a Creative Commons Attribution-NonCommercial-NoDerivatives 4.0 International License.
About this article
Publication Date
15 November 2023
Article Doi
eBook ISBN
978-1-80296-130-0
Publisher
European Publisher
Volume
131
Print ISBN (optional)
-
Edition Number
1st Edition
Pages
1-1281
Subjects
Technology advancement, humanities, management, sustainability, business
Cite this article as:
Al-Fakih, D. H. S., Zakaria, S., & Ismail, M. K. A. (2023). Liquidity M2, Inflation, and Sukuk Issuance: Empirical Evidence. In J. Said, D. Daud, N. Erum, N. B. Zakaria, S. Zolkaflil, & N. Yahya (Eds.), Building a Sustainable Future: Fostering Synergy Between Technology, Business and Humanity, vol 131. European Proceedings of Social and Behavioural Sciences (pp. 1000-1014). European Publisher. https://doi.org/10.15405/epsbs.2023.11.82