
Impact of Fuel Oil Pricing Policy on Inflation


Abstract
This research aims to analyze the effect of changes in fuel oil pricing policy toward inflation rate in Indonesia, to confirm whether fuel oil pricing policy plays an important role in shaping inflation trends. The dependent variable in this study is inflation, and the independent variables are fuel oil pricing policy, money supply, and interest rate level. We use secondary data sourced from Bank Indonesia, Central Statistics Agency (BPS), Ministry of Energy and Mineral Resources, and PT Pertamina (Persero). ARCH and GARCH methods are used because time series data from 1990:3 to 2022:09 contain volatility issues. The best model in this study is GARCH(1,1. The results of the study indicate that changes in fuel pricing policy during the Soeharto and SBY presidencies, BI Rate and Policy Rate, have a positive effect on inflation. During the leadership of Abdurrahman Wahid (Gusdur), Megawati, and Jokowi, as well as the money supply level, did not have a significant effect on inflation. The indirect impact of fuel price adjustment leads to an increase in the inflation rate and poverty rate, as well as resulting in a decrease in economic growth. We suggests that the policy of reducing fuel subsidy of increasing the fuel oir price should be done gradually to avoid causing short-term inflationary disturbances
Keywords: Inflation, Money Supply, Policy Rate, Subsidy
Introduction
Inflation is one of the variables in macroeconomics used to measure the stability of a country's economy. Inflation generally affects economic instability, slows economic growth, and can lead to an increase in unemployment (Mishkin, 2004; Salim et al., 2021). Inflation is influenced by various factors, including an increase in money supply, an increase in production costs, or an increase in demand for certain commodities, such as fuel (Atmadja, 1999; Manoy, 2017).
The expansion of a country's economy is influenced by changes in global oil prices. This affects general price adjustments for goods and services, causing consumers to limit their consumption and contributing to both cost-push and demand-pull inflation. An increase in oil prices will increase the production costs of goods that use oil as fuel, which will increase the prices of those commodities and possibly the overall price level (inflation) (Basnet & Upadhyaya, 2015).
Fuel price fluctuations have occurred since the early days of Indonesia's government (Salim et al., 2014). There have been 21 modifications to subsidized fuel prices during President Soeharto's periods. For some types of subsidized fuel, price adjustments were made, and this trend has continued under every presidential administration. Table 1 shows the frequency of price changes and fuel subsidies in each presidential period.
These changes were related to increases or decreases in the prices of Gasoline and Solar fuels. Generally, the policy was aimed at raising prices. There was only one decrease in the price of Gasolines in 1970, while for Solar, there were two decreases in prices in 1990 and 1998. During President Gusdur's leadership (2000-2001), there were 7 changes in fuel subsidies policy, including one increase in Gasoline prices in 2001 and a decrease in Solar prices in June 2001. During President Megawati's leadership (2001-2004), there were 19 changes, where gasoline prices gradually increasing, while Solar prices fluctuated and being lowest in 2001-2002. During President SBY's leadership (Susilo Bambang Yudhoyono) (2004-2014), there were 9 changes, with Gasoline prices experiencing significant increases. In 2004, Gasolines was priced at Rp1850 per liter, rising to Rp6500 per liter in 2014. Similarly, Solar prices rose from Rp1650 per liter to Rp5000 per liter during this period. During President Jokowi's leadership (2014-2022), there were 20 changes in fuel prices, where subsidies for Gasolines and Solar initially increased and later decreased, while subsidies for Pertalite fuel experienced a similar pattern of increase and then decrease.
The growth of Indonesia's economy has been influenced by global fuel price changes since the beginning of the New Order government until the reformation era (Harunurrasyid, 2013). Fluctuations in world oil prices throughout the New Order era had an impact on economic expansion. Since 1969, Indonesia's economy has grown rapidly (based on I, economic growth increased from an average of 3 percent to 6.7 percent per year). The increasing price of oil exports, which generated a surplus of foreign exchange from the export of petroleum resources and accounted for a significant portion of Indonesia's total exports, drove this growth.
The value of crude oil exports was 40.3 percent in 1970 and continued to increase until 1982, reaching its peak at 82.4 percent. Prior to the reform era, the value of oil exports fell to around 22 percent of Indonesia's total exports. This was due to the fall in oil prices and the decline in production levels in the country (Dumairy, 1997, p. 183). After that, Indonesia's economic growth began to slow down in line with the income from oil exports.
Unpredictable increases in oil prices tended to rise and had an impact on inflation rates during the reform era, which was marked by the monetary crisis in 1998 (Yudanto & Santoso, 2003). The increased volatility of world oil prices throughout the reform era added to the burden on the state budget, which provided subsidies for customers of fuel oil. As a result, Indonesia has become a net fuel oil importer, making it difficult to meet development budgetary obligations. To overcome the impact of increased world fuel oil price, the Indonesian government offered subsidies to middle and lower-class consumers for domestic fuel prices. However, this complicated the fulfillment of financial obligations in Indonesia's annual budget. As a result, the Indonesian government sought to reduce the burden on the state budget by reducing fuel subsidies, which indirectly would have an impact on broader price increase trends.
The government's budget for fuel subsidies has declined over the past four years and increased in the fifth year based on energy transition data. The budget for fuel subsidies in 2018 was IDR 38.87 trillion, but it was only IDR 30.06 trillion in 2019. It was IDR 17.7 trillion in 2020; this was a significant decrease from the projected amount due to the Covid-19 pandemic, as was the amount of subsidies realized. It decreased by IDR 16.6 trillion in 2021 and increased more than three times that amount in 2022.
The allocation of subsidies for fossil fuels, particularly fuel oil, will end in 2022. Fuel subsidies are expected to cause inefficient energy use and burden the state's finances. The government is trying to protect the people from changes in oil prices, but considering that the budget for subsidies and compensation in 2022 has increased from the initial state budget of IDR 152.5 trillion to IDR 502.4 trillion, the government has decided to redirect some of the fuel oil subsidies to more targeted aid.
Based on the above explanation, we suspect that every change in fuel oil subsidy policy will indirectly affect inflation because an increase or change in domestic fuel prices will also raise the cost of goods in general. This study aims to examine the effect of changes in fuel oil price policy during different leadership eras in Indonesia and to determine whether the policy can be proven to have an impact on inflation.
Literature Review
The effect of changes in fuel pricing on inflation
Fuel oil plays an important role in the economy. The issue of fuel oil has been a challenge in Indonesia. Because Indonesia consumes a lot of fuel and most of its needs are imported, Indonesian fuel oil prices are vulnerable to changes in world oil prices. Since the decrease in people's purchasing power due to fuel oil price inflation, the results of business production have not been fully absorbed, which affects sales levels and potentially reduces company revenue, increasing the burden of living for workers and entrepreneurs.
As a result of the increase in world oil prices, the government can no longer provide fuel for the general public at the same price as the world average price. Consequently, the government has taken various steps and policies to curb price increases. Generally, fiscal policies are implemented through the application of taxes and subsidies (Saragih, 2011). The government provides subsidies through these programs as an effort to reduce the tax burden borne by the community. When the social benefit value exceeds personal gain value, subsidies are offered to consumers or producers as part of the positive externalities impact. Positive externalities are beneficial effects of one party's behavior towards another party without any payment from the beneficiary.
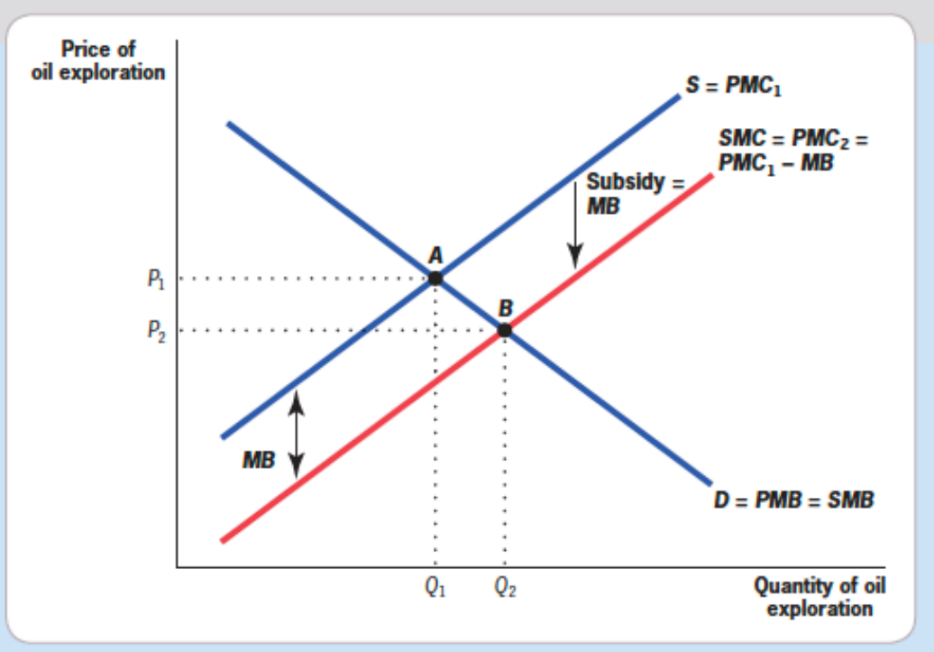
The graph in Figure 1, shows that an increase in the value of subsidies will result in a decrease in the price of fuel and will have implications for a decrease in the inflation rate. Similarly, when the amount of subsidies is reduced, it will have an impact on the increase in the price of fuel and lead to a higher inflation rate. The graph illustrates how subsidies reduce the marginal cost of oil producers from the PMC curve to PMC2, which coincides with the SMC curve. This shows how subsidies are seen as a solution to the existence of positive production externalities in the oil exploration market. This results in an increase in the quantity value produced from Q to Q2, indicating the optimum output level.
Subsidies resulting from positive externalities, according to Jacques (2018), are assistance given by the government to producers in such a way that the price offered is in line with the government's preferences with a lower value than the initial price. Commodity prices fall as a result of the subsidy. Producers can receive subsidies from the government to reduce the impact of externalities. Government subsidies help producers to make a profit and reduce the losses caused by business externalities on the environment, thus helping society.
Pigouvian taxes can be used to reduce negative externalities when taxes are applied. When an impact harms others that are uncompensated, it is called negative externality. Externalities related to the environment have an impact on the happiness of others when the consumption of goods and services has a negative impact on society as a whole. When there are negative externalities, the person or business that causes them is required to pay a tax equal to the marginal impact of the externalities produced. This forces people or businesses to consider the quantity of benefits and effects generated by the amount of commodities produced or consumed by consumers. Production owners will receive incentives when taxes are imposed to help reduce their negative impact. The negative impact will be reduced further with an increase in the tax rate imposed. When social marginal costs exceed private marginal costs, producers must pay Pigovian taxes. The tax obligation causes an increase in the price of the produced goods, which reduces the amount of goods demanded.
Assuming there is an increase, the burden of fuel subsidies in the state budget will increase due to changes in fuel prices policy and the world market prices. The government raises domestic fuel prices to alleviate the burden of fuel subsidies in the state budget. Generally, an increase in domestic fuel prices will have an impact on the increase in product prices (inflation) (Hrp & Aslami, 2022). An increase in fuel prices is unavoidable because it adds to the state budget burden, which has a direct impact on inflation, and because fuel is an important component in the production and delivery of commodities.
Method
A quantitative analytical approach using time series data from 1990:3 to 2022:09 is applied in this study. For each variable, processing begins with testing for stationarity and degree of integration. To determine whether there is a long-term relationship between the independent and dependent variables, a cointegration test is conducted. A dynamic model will be applied when cointegration occurs assuming there is no volatility. The ARCH/GARCH model can be used to improve models that contain volatility.
To determine the effect of independent variables on the dependent variable, a multiple regression model is used as follows:
Inflationt = b0 + b1 Fuel Oil Pricing Policyt + b2 Money Supplyt + b3 Interest Ratet + et
In this research, inflation is measured as a change of CPI (Consumer Price Index) year on year (YoY). The fuel oil pricing policy is measured by using a dummy variable about changes in fuel oil subsidy price policies for each presidential period. The money supply variable is measured by using the monthly M2 Value in billions of rupiah, and the Interest Rate variable is measured using the BI Rate, PUAB (Interbank Money Market rate), and Policy Rate values in percentage on a monthly basis.
The equation is estimated by using ARCH (Autoregressive Conditional Heteroscedasticity) and GARCH (Generalized Auto Regressive Conditional Heteroskedasticity) methods. Nachrowi and Hardius (2006) lists the following as reasons for using these methods, among others:
The time series data used in this research includes monthly data from 1990 to 2022, with statistical variables including money supply, interest rate, inflation, and changes in fuel prices during each presidential era.
The research data has non-constant error variance (et).
Non-constant error variance (et) can be used in modeling.
For the ARCH and GARCH approaches, these models are applied to data that exhibit heteroscedasticity problems. It is possible to generate more effective estimators by utilizing heteroscedasticity correctly in the errors.
These factors lead to the selection of the ARCH and GARCH methods as appropriate analytical techniques for this study. Heteroscedasticity is not seen as a difficulty by the ARCH and GARCH approaches, but rather as a tool for building models. In order to create a model with accurate errors and achieve more effective estimators, heteroscedasticity is actually applied. In variance models, errors often vary over time rather than depending on independent variables. Sometimes, volatility is very high and very low in this model. Because there are error variances that depend on the volatility of previous errors, these volatility patterns indicate the presence of heteroscedasticity. Robert Engle's discovery of the GARCH (Generalized Autoregressive Conditional Heteroscedasticity) and ARCH (Autoregressive Conditional Heteroscedasticity) models can be used to model data with heteroscedasticity (Engle’s, 1982).
This study will use an ARCH/GARCH model, with variable Y(1) = Inflation, X(1) = fuel oil pricing Policy, X(2) = Money Supply, and X(3) = Interest Rate. The equation model is as follows:
Yt= 𝛽0 + 𝛽1𝑋𝑡 + 𝑒t ……………………. (1.1)
On time series data, heteroskedasticity generally occurs due to high volatility, thus requiring regression equation transformation. The residual variance equation in ARCH modeling can be written as follows:
𝛼𝑡2 = 𝑎0 + 𝑎1𝑒2𝑡−p …………………….. (1.2)
Where:
𝛼𝑡2 is the residual variance at time t, 𝑎0 and α1 are model parameters that need to be estimated,
𝑒2𝑡−p is the squared residual at time t-p used as a predictor for the residual variance at time t.
The equation above represents an ARCH(p) model, which is used because the variance of the residual 𝑒𝑡 depends on the squared residual fluctuations from the previous period (lag p). Therefore, an ARCH(p) model can be expressed in equation form as follows:
Yt = β0 + β1 Xt + et ………………….…. (1.3)
𝑎2t = 𝑎0 + 𝑎1e2 t-p ..........................……… (1.4)
This model shouls have positive varian (var(e2)>0), a constraint must be made, namely: a0 > 0 and 0 < a1 < 1. There are also a relatively large number of p, resulting in many parameters that need to be estimated. The more parameters that are estimated, the lower the precision of the estimator. To overcome this problem, var(et) can be modeled as follows:"
σ2t = α0 + α1е2t-p + λ1σ2t-q ………..……… (1.5)
This model is called the GARCH (p,q) model because in this model the value of σ2 depends on the value of e2t-p and 𝜎2t-q, each of which has a time lag pf p and q. To ensure that the variance is positive (var(e2) > 0), this model also requires constraints, namely: 𝑎0> 0 ; 𝛼1 and 𝜆1 > 0 ; also 𝛼1 + 𝜆1 < 1, which bind the parameter values in the model. This is important to ensure that the model is stable and can provide consistent and reliable results. With these constraints, the GARCH (1,1) model can help overcome the problem of heteroskedasticity and provide more accurate and reliable estimates of historical data volatility.
Findings
Based on the result of the stationary dan integration degree test, we found that all variable stationers at first difference. Cointegration tests show that the model is cointegrated which means that there is a long-term relationship between the dependent variable and the independent variable. The volatility test shows that there is volatility in the model, therefore, we use the ARCH GARCH model (Santoso, 2011). The ARCH model aims to address the issue of volatility in economic data forecasting, where the forecasting model may not accurately reflect actual conditions. Meanwhile, the GARCH model is a more flexible forecasting model that is described with a more general lag structure (Sumiyati et al., 2022; Wijoyo, 2016). In the ARCH model, the residual variance of the time series data is not only influenced by the independent variables but also by the residual value of the variables being studied (Wahyu Winarno, 2015). After conducting several estimations, we found that the best model is GARCH (1,1) as follows:
Based on the results of the test in the table above, the variance equation provides good results with p-value for ARCH order 1 is 0.000 or smaller than the 5% significance level, while GARCH order 1 (GARCH (1,1)) is 0.000 or less than 5%. Meanwhile, p value for the main model, such as the Soeharto era is 0.0042, Gusdur is 0.2989, Megawati is 0.2065, SBY is 0.000, and Jokowi is 0.4958. It is stated that the Soeharto and SBY eras are significant because they are smaller than the 5% significance level. While D1 interest rate is 0.0000, D2 interest rate is 0.000, D3 interest rate is 0.4454, and money supply (JUB) is 0.5416. It is known that the BI rate and policy rate have an effect because the p-value are smaller than the 5% significance level. The results of the GARCH (1,1) model analysis are the best forecasting model to predict the relationship between changes in fuel prices and inflation with the following equation:
Inflationt = -0.01161 + 1.1717 Soehartot + 0.5461 Gusdurt + 0.1394 Megawati t + 1.1282 SBY t + 0.086 JKW t + 0.8575 D(LNJUB) t + 0.9287 D(LNSB)*D1 t + 31.871 D(LNSB)*D2t + 1.1337 D(LNSB)*D3 …………... (1.6)
GARCH (1,1) equations:
𝜎12 = 𝜔 + 𝛼𝜀𝑡−12 + 𝛽𝜎2𝑡−1 ……………………….………………… (1.7)
𝜎12 = 0.0699 + 0.9625 * RESID(-1)2 + 0.3657 * GARCH(-1)...…. (1.8)
There is a relationship between changes in fuel prices and inflation in the previous period as shown in the equation above.
To test the robustness of the model, we conducted a heteroscedasticity test using the ARCH-LM method. Probability of Chi-Square of the ARCH-LM test on the GARCH (1,1) model is greater than α = 5%, which is 0.9337 > 0.05, thus it can be concluded that the residual variance is constant (no volatility).
Hypotheses and results of each independent variable on its dependent variable
The Effect of Soeharto's Era Fuel Price Changes on Inflation:
Ho: βi ≤ 0, Subsidized fuel policy has no significant positive effect on inflation
Ha: βi > 0, Subsidized fuel policy has a significant positive effect on inflation
The p-value of fuel pricing policy changes during the Soeharto is 0.0042 < α (0.05) with a positive coefficient value, meaning that Ho is rejected and it can be concluded that fuel price changes during the Soeharto era have a positive effect on inflation. This result indicates that the inflation increase during this period was caused by the monetary crisis triggered by fuel price changes and other factors such as the depreciation of the rupiah exchange rate.
The Effect of Gusdur's Era Fuel Price Changes on Inflation:
Ho: βi ≤ 0, Subsidized fuel policy has no significant positive effect on inflation
Ha: βi > 0, Subsidized fuel policy has a significant positive effect on inflation
The p-value of fuel pricing policy changes during the Gusdur era is 0.2989 > α (0.05) with a positive coefficient value, meaning that we failed to reject Ho and it can be concluded that fuel price changes during the Gusdur era have no significant effect on inflation. This result indicates that the inflation increase during this period was caused by factors other than fuel prices. This was concerns about fiscal mismanagement during Gus Dur's presidency, with the government spending heavily on subsidies and social programs without adequate revenue sources. This led to a widening of the budget deficit, which fueled inflation. Indonesia was hit by several economic shocks during Gus Dur's presidency, including the impact of the Asian financial crisis and the global economic slowdown, which contributed to inflationary pressures.
The Effect of Megawati's Era Fuel Price Changes on Inflation:
Ho: βi ≤ 0, Subsidized fuel policy has no significant positive effect on inflation
Ha: βi > 0, Subsidized fuel policy has a significant positive effect on inflation
The p-value of fuel pricing policy changes during the Megawati era is 0.2065 > α (0.05) with a positive coefficient value, meaning that we failed to reject Ho and it can be concluded that fuel price changes during the Megawati era have no significant effect on inflation. This result indicates that the inflation decrease during this period was due to the end of cooperation with the IMF, which affected the exchange rate changes, the IHSG, and resulted in an increase in economic growth and a decrease in inflation. In 2005, the government increased fuel prices by over 100%, which led to an increase in transportation costs and inflationary pressures. The Indonesian rupiah was depreciated several times during Megawati's presidency, which increased the price of imported goods and led to inflation. The government had a significant fiscal deficit during Megawati's presidency, which was partly caused by heavy subsidies for fuel and electricity, as well as an increase in social spending (Haryanto, 2016). This led to inflationary pressures. Indonesia was also affected by the global economic slowdown during Megawati's presidency, which affected the country's exports and contributed to inflationary pressures.
The Effect of SBY's Era Fuel Price Changes on Inflation:
Ho: βi ≤ 0, Subsidized fuel policy has no significant positive effect on inflation
Ha: βi > 0, Subsidized fuel policy has a significant positive effect on inflation
The variable of fuel pricing policy changes during the SBY era resulted in a p-value of 0.0000 < α (0.05) with a positive coefficient value, meaning that Ho is rejected and it can be concluded that fuel price changes during the SBY era have a significant positive effect on inflation. This result indicates that the increase in oil prices had a negative impact on the economy. The increase in fuel prices directly affects inflation in the opposite direction. World oil prices were relatively stable during SBY’s era, which reduced inflation pressure in Indonesia that heavily depends on oil imports.
The Effect of Jokowi's Fuel Price Changes on Inflation:
Ho: βi ≤ 0 Fuel Subsidy Policy has no significant positive effect on Inflation
Ha: βi > 0 Fuel Subsidy Policy has a significant positive effect on Inflation
The variable of changes in fuel pricing policy during the Jokowi era resulted in a p-value of of 0.4958 > α (0.05), which means that we failed to reject Ho, so it can be concluded that changes in fuel prices during the Jokowi era have no significant effect on inflation. This result indicates that during this period, President Jokowi was able to control inflation so that any increase in fuel prices did not result in a drastic increase in the prices of goods in general, and it has been proven that the inflation rate remains stable.
Inflation during the Joko Widodo (Jokowi) era in Indonesia has been relatively stable, although there have been some fluctuations. In the early years of his presidency, Jokowi's government implemented a number of policies aimed at stabilizing the economy and reducing inflation, including measures to control fuel prices, reform the tax system, and improve infrastructure. In 2015, Indonesia experienced a slight increase in inflation, largely due to the impact of global economic conditions and the depreciation of the Indonesian rupiah. However, the government responded by implementing a number of measures, including cutting fuel subsidies and raising interest rates, which helped to bring inflation back down (Sundoro, 2021).
In recent years, inflation in Indonesia has remained relatively low, with rates generally ranging from 2% to 4%. The government has continued to implement policies aimed at maintaining stability in the economy and keeping inflation under control, including measures to promote investment, boost productivity, and support small and medium-sized enterprises.
Overall, while there have been some fluctuations, inflation during the Jokowi era has remained relatively stable, thanks in part to the government's efforts to implement sound economic policies and maintain macroeconomic stability.
In general, changes in fuel prices in some periods do not have an impact on increasing inflation. The reduction in subsidies has resulted in an increase in fuel prices and has an impact on the increase in various prices of products or commodities, whether they are goods or services needed by the community. This condition indirectly affects the macro economy and the increase in the inflation rate.
The Effect of Money Supply on Inflation:
Ho: βi ≤ 0 Money Supply has no significant positive effect on Inflation
Ha: βi > 0 Money Supply has a significant positive effect on Inflation
The Money Supply variable resulted in a p-value of 0.5416 > α (0.05) with a positive coefficient value, which means that we failed to reject Ho, so it can be concluded that changes in Money Supply have no significant effect on inflation. Money supply can have an impact on inflation, but it is not the only factor that affects inflation. Inflation is a complex phenomenon that is influenced by many different factors, including supply and demand for goods and services, economic growth, government policies, and external factors such as global economic conditions and commodity prices.
In some cases, an increase in the money supply can lead to inflation, as more money in circulation can lead to an increase in demand for goods and services, which can push up prices (Azizah, 2020; Amaliyah & Aryanto, 2022). However, in other cases, an increase in the money supply may not lead to inflation, especially if the increase in money supply is matched by an increase in the supply of goods and services.
Additionally, the relationship between money supply and inflation can be affected by other factors such as the velocity of money, which refers to the rate at which money is exchanged in the economy. If the velocity of money is low, an increase in the money supply may not have a significant impact on inflation.
The Effect of Interest Rates on Inflation:
Ho: βi ≠ 0 Interest rates have no significant effect on Inflation
Ha: βi = 0 Interest rates have a significant effect on Inflation
The Interest Rate variable resulted in a p-value of 0.0000, which means that we reject Ho, so it can be concluded that Interest Rates have a significant effect on inflation. This indicates that when the inflation rate is high, BI will take a policy by increasing the BI rate to provide a reduction in the inflation effect. In a condition when inflation is prolonged and unstable, Bank Indonesia takes a policy to stabilize it through an increase in the benchmark interest rate. This makes the inflation variable have a positive effect on interbank money market interest rates. This will make the public save more money. Thus, through this policy, the inflation rate can be controlled to remain stable and optimal.
The central bank of Indonesia, Bank Indonesia, sets the benchmark interest rate, known as the BI 7-Day Reverse Repo Rate, which serves as a guide for other interest rates in the economy. When inflation is high, Bank Indonesia may raise interest rates to encourage saving and reduce borrowing and spending, which can help to cool down the economy and bring inflation under control. Conversely, when inflation is low and the economy needs a boost, Bank Indonesia may lower interest rates to encourage borrowing and spending, which can stimulate growth (Amaliyah & Aryanto, 2022).
In recent years, Indonesia has experienced moderate inflation, with annual inflation rates averaging around 3-4% over the past decade. Bank Indonesia has generally maintained a cautious approach to monetary policy, balancing the need to control inflation with the need to support economic growth. In 2020, in response to the economic impact of the COVID-19 pandemic, Bank Indonesia cut interest rates several times to support the economy, but has since begun to raise rates again in response to rising inflationary pressures.
Discussion
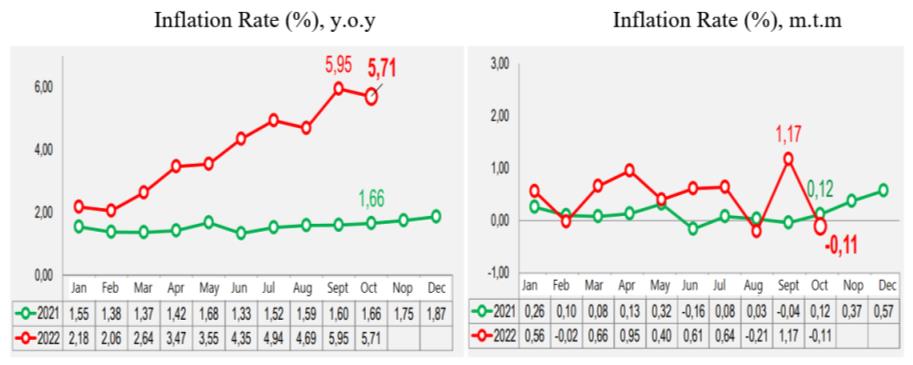
Based on the overall research results, it appears that the adjustment of fuel oil pricing policy has been proven to have an effect on inflation in Indonesia. The increase in fuel prices in Indonesia was initiated by the rise in world oil prices, which made the government unable to sell fuel to the public at the same price as before, as this would cause the state budget expenditure for subsidies to increase. Therefore, the government has attempted to reduce the subsidy burden, and as a result, the imposition of prices on fuel will become higher. The higher fuel prices will impact the increase in the prices of goods/services and will only cause inflation after a certain period of time. Therefore, the increase in fuel prices will be felt heavily by the public, especially with the increase in the prices of various basic needs and transportation costs. With the increase in the prices of basic necessities, various living burdens, especially those experienced by people or families who are not yet able or poor and near poor communities in meeting their daily needs, become increasingly heavier. Figure 2, shows that the increase in commodity prices over a certain period of time causes inflation. This figure in detail describes that Indonesia's inflation in 2022 increased by 71% (YoY), which is a high value since October 2015. This is not only caused by the increase in fuel prices but also due to the increase in commodity prices and geopolitical crises. Therefore, monthly, it has an impact on the increase in inflation, which reached 1.17% (mtm) in Sepember 2022 and has been continuously increasing since May (BPS, 2022)
Therefore, it can be understood that if the increase in fuel oil prices only has an exponential effect on the increase in prices of various products or commodities, whether it is goods or services that are needed by the public, it will have a real impact on the macroeconomic conditions, as reflected through the decline in real gross domestic product (GDP), the increase in unemployment rate, and the increase in inflation rate.
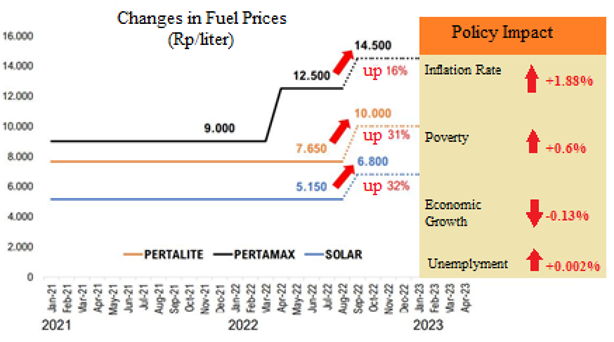
Based on the Figure 3 below, it can be seen that for a certain period of time, the indirect impact of fuel price adjustment leads to an increase in the inflation rate and poverty rate, as well as resulting in a decrease in economic growth.
Fuel oil pricing policies have a significant impact on inflation in Indonesia in several presidency eras, as the country is heavily dependent on imported oil to meet its energy needs. When the price of oil rises on the global market, it can increase the cost of fuel in Indonesia, which in turn can lead to higher prices for goods and services throughout the economy.
The Indonesian government sets fuel prices through a system of subsidies, which aim to keep the price of fuel affordable for consumers while also maintaining the financial stability of state-owned oil company Pertamina. Historically, fuel subsidies have been a major driver of government spending, and have contributed to Indonesia's budget deficit.
In recent years, the government has sought to reduce fuel subsidies in order to improve the country's fiscal position and reduce its reliance on imported oil. In 2015, the government introduced a new pricing mechanism for fuel, known as the Automatic Pricing Formula (APF), which is designed to adjust fuel prices in line with changes in the global price of oil. Under the APF, fuel prices can be adjusted every two weeks based on changes in the average price of a basket of crude oils. While the APF has helped to reduce the fiscal burden of fuel subsidies and promote more efficient pricing of fuel, it has also led to increased volatility in fuel prices and contributed to inflationary pressures. In 2018, the government temporarily froze fuel prices in response to rising global oil prices, which led to concerns about the impact on the country's fiscal position and inflation rate.
Overall, fuel oil pricing policy plays an important role in shaping inflation trends in Indonesia, and policymakers must balance the need to maintain affordable fuel prices for consumers with the need to promote fiscal stability and manage inflationary pressures.
References
Amaliyah, F., & Aryanto, A. (2022). Pengaruh Jumlah Uang Beredar dan Suku Bunga Terhadap Inflasi di Indonesia [The Influence of Money Supply and Interest Rates on Inflation in Indonesia]. Owner, 6(2), 1342-1349. DOI:
Atmadja, A. S. (1999). Inflasi di Indonesia: Sumber-sumber Penyebab dan Pengendaliannya [Inflation in Indonesia: Sources of Causes and Control]. Jurnal Akuntansi dan Keuangan. https://www.neliti.com/publications/73378/inflasi-di-indonesia-sumber-sumber-penyebab-dan-pengendaliannya#id-section-content
Azizah, L. (2020). Pengaruh Nilai Tukar Rupiah dan Jumlah Uang Beredar Luas Terhadap Inflasi di Indonesia Periode 2010 - 2019. Ecodunamika, 3(2). https://ejournal.uksw.edu/ecodunamika/article/view/4046
Basnet, H. C., & Upadhyaya, K. P. (2015). Impact of oil price shocks on output, inflation and the real exchange rate: evidence from selected ASEAN countries. Applied Economics, 47(29), 3078-3091. DOI:
BPS. (Badan Pusat Statistik). (2022). Berita Resmi Statistik 2022 [Official Statistics New 2022]. https://www.bps.go.id/website/materi_eng/materiBrsEng-20221101115900.pdf
Dumairy. (1997). Perekonomian Indonesia [Indonesian Economy]. Erlangga.
Engle, R. F. (1982). Autoregressive Conditional Heteroscedasticity with Estimates of the Variance of United Kingdom Inflation. Econometrica, 50(4), 987. DOI:
Gruber, J. (2019). Public finance and public policy (6th Ed.). Worth Publishers.
Harunurrasyid, H. (2013). Pengaruh perubahan harga Bahan Bakar Minyak (BBM) terhadap tingkat inflasi di Indonesia [The Effect of Changes in Fuel Oil (BBM) Prices on the Inflation Level in Indonesia]. Jurnal Ekonomi Pembangunan, 11(2), 78-90.
Haryanto, J. T. (2016). Kajian Potensi Sharing Subsidi Listrik oleh Pemerintah Daerah [Study of the Potential for Electricity Subsidy Sharing by Regional Governments]. Jurnal Ekonomi, 18(1), 52-67. https://ejournal.borobudur.ac.id/index.php/1/article/view/286
Hrp, G. R., & Aslami, N. (2022). Analisis Dampak Kebijakan Perubahan Publik Harga BBM terhadap Perekonomian Rakyat Indonesia [Impact of Public Policy Changes in Fuel Prices on the People's Economy]. JIKEM: Jurnal Ilmu Komputer, Ekonomi dan Manajemen, 2(1), 1464-1474. https://ummaspul.e-journal.id/JKM/article/download/3601/1261/
Jacques, I. (2018). Mathematics for Economics and Business (9th Ed.). Pearson Education Limited.
Manoy, M. B. (2017). Pengaruh Variabel Makroekonomi Terhadap Perilaku Inflasi Di Indonesia Periode 2007.1-2016.4 [The Influence of Macroeconomic Variables on Inflation Behavior in Indonesia for the Period 2007.1 - 2016.4]. Jurnal Berkala Ilmiah Efisiensi, 17(02). https://ejournal.unsrat.ac.id/index.php/jbie/article/viewFile/17673/17199
Mishkin, F. S. (2004). The Economics of Money, Banking and Financial Markets (7th ed.). Addison-Wesley Publishing Company, Inc.
Nachrowi, D. N., & Hardius, U. (2006). Pendekatan Populer dan Praktis untuk Analisis Ekonomi dan keuangan [Popular and Practical Approaches to Economic and Financial Analysis]. Lembaga Penerbit Fakultas Ekonomi UI.
Salim, A., Fadilla, F., & Purnamasari, A. (2021). Pengaruh Inflasi Terhadap Pertumbuhan Ekonomi Indonesia [The Effect of Inflation on Indonesia's Economic Growth]. Ekonomica Sharia: Jurnal Pemikiran dan Pengembangan Ekonomi Syariah, 7(1), 17-28. https://ejournal.stebisigm.ac.id/index.php/esha/article/view/268/200
Salim, Z., Bawono, K., & Komaidi, N. (2014). Kebijakan Subsidi BBM [Fuel Subsidy Policy]. Jakarta, Indonesia: The Habibie Center. https://www.habibiecenter.or.id/img/publication/bacf9f0b67ce82c46ad57e86eddf0b17.pdf
Santoso, T. (2011). Aplikasi model GARCH pada data inflasi bahan makanan Indonesia [Application of the GARCH Model to Indonesian Food Inflation Data]. Jurnal Ilmiah Aset, 13(1), 65-76. https://media.neliti.com/media/publications/36607-ID-aplikasi-model-garch-pada-data-inflasi-bahan-makanan-indonesia.pdf
Saragih, J. P. (2011). Dilema Kebijakan Subsidi Harga Bahan Bakar Minyak dan Alternatif Solusinya [Dilemma of Fuel Price Subsidy Policy and Alternative Solutions]. Jurnal Ekonomi & Kebijakan Publik, 2(2), 585-605. https://jurnal.dpr.go.id/index.php/ekp/article/view/119
Sumiyati, S., Arisandi, B. D. A., & Wilujeng, P. R. (2022). Metode Arch/Garch Untuk Memprediksi Hubungan Economic Uncertainty Akibat Pandemi Covid 19 Dan Volatilitas Saham [ARCH/GARCH Method for Predicting the Relationship between Economic Uncertainty (Covid 19) and Stock Volatility]. Jurnal Bisnis dan Akuntansi, 24(1), 117-130. DOI:
Sundoro, H. S. (2021). Pengaruh Harga Komoditas Pangan Dan Bensin Terhadap Tingkat Inflasi Selama Pemerintahan Jokowi. Jurnal Ekonomi dan Bisnis Universitas Udayana, 10(02), 73-82. DOI:
Wahyu Winarno, W. (2015). Analisis Ekonometrika dan Statistika dengan Eviews [Econometric and Statistical Analysis with Eviews]. Edisi Empat. Yogyakarta: UPP STIM YKPN.
Wijoyo, N. A. (2016). Kajian Ekonomi & Keuangan dengan Menggunakan Model GARCH Forecasting the Rupiah Exchange Rate to USD by Utilising GARCH. Kajian Ekonomi Keuangan, 20(2), 170-189.
Yudanto, N., & Santoso, M. S. (2003). Dampak Krisis Moneter Terhadap Sektor Riil [Impact of The Monetary Crisis On The Real Sector]. Buletin Ekonomi Moneter dan Perbankan, 1(2), 131-158. DOI:
Copyright information

This work is licensed under a Creative Commons Attribution-NonCommercial-NoDerivatives 4.0 International License.
About this article
Publication Date
29 November 2023
Article Doi
eBook ISBN
978-1-80296-131-7
Publisher
European Publisher
Volume
132
Print ISBN (optional)
-
Edition Number
1st Edition
Pages
1-816
Subjects
Accounting and finance, business and management, communication, law and governance
Cite this article as:
Kunthi, Y. C., Syofyan, S., & Sirait, K. H. (2023). Impact of Fuel Oil Pricing Policy on Inflation. In N. M. Suki, A. R. Mazlan, R. Azmi, N. A. Abdul Rahman, Z. Adnan, N. Hanafi, & R. Truell (Eds.), Strengthening Governance, Enhancing Integrity and Navigating Communication for Future Resilient Growth, vol 132. European Proceedings of Social and Behavioural Sciences (pp. 179-192). European Publisher. https://doi.org/10.15405/epsbs.2023.11.02.14