
An Econometric Analysis of Panel Data for Educational Attainment and Employment in Tertiary Education


Abstract
This paper aims to identify and compare the trends in educational attainment and employment rate in tertiary education in OECD countries between 2000 and 2020. In this study, a quantitative research design with a panel data analysis was adopted using the dataset obtained from the OECD data warehouse. After descriptive analyses of the dataset of educational attainment and employment rate belonging to 28 OECD countries, a panel data analysis was employed in the study. According to the descriptive results, the highest rates for tertiary educational attainment refer to Canada whereas the lowest percentages are detected in Turkey and Mexico. The highest employment rates in tertiary education pertain to Portugal, Switzerland, Sweden, and Slovenia while the lowest rates of employment in tertiary education belong to Korea, Turkey, and Greece. The results of the econometric analysis of the panel data indicate that the employment rate goes down by 0.24 points for every point of tertiary educational attainment and a one-way causality relationship is found from educational attainment to employment rate in the period of 2000-2020.
Keywords: Educational attainment, employment, OECD countries, panel data analysis, tertiary education
Introduction
One of the most important factors determining the education policies of the countries is the capacity to employ the workforce that will meet the sectoral needs. Therefore, the relationship between labour force status and employability in different sectors has considerably become the key area of interest investigated by countries adopting education policies to qualify the labour force accordingly. Organization for Economic Co-operation and Development (OECD) plays a guiding role for countries in developing education policies based on multifaceted and continuously collected data over the years. In the publication entitled “Education at a Glance 2021”, it is stated that “expanded education opportunities have increased the pool of skilled people across countries, and those with higher qualifications are more likely to find employment” (OECD, 2021, p. 65). Obviously, tertiary attainment is significantly advantageous for employment across countries.
Educational attainment is one of the strategic issues in educational policy because it qualifies the status of the workforce in countries. Grimaccia and Lima (2013) pointed out that the development of human capital is considerably connected with the social and economic progress of any nation, which makes education play a central role in the developmental levels of countries. In the policy context, educational attainment refers to “the stock of human capital”; in other words, “the skills/knowledge available in the population” are certified with qualifications providing information about “the type of these skills and knowledge that graduates have acquired in formal education” (OECD, 2017, p. 89). Educational attainment can be categorized into different levels of education according to the age groups of a country.
Tertiary education concerns the development of highly productive skills; therefore, governments employ policies to force higher education institutions to qualify the human capital (Clarke, 2018; Mason et al., 2009), which is directly related to education economics. In other words, to qualify the human capital with generic skills requires an increase in government and/or public expenditure on tertiary education resulting in the expected sustainability in employment. In this context, as a global actor, OECD provides statistical data to its members and non-members to shape policy alternatives for tertiary education (Niemann & Martens, 2018). With the help of the data regularly provided by OECD, it is possible to observe and investigate the changes in tertiary educational attainment and employment rates across countries over time.
Of the determinants of employment, educational attainment can be regarded as a critical factor for countries. As reported by McIntosh (2008), individuals with “low levels of education in the modern labour market in developed countries” are unlikely to find a job, which results in an increase in unemployment rates; thus, policies for the expansion of higher education graduates with higher skills have been adopted for the OECD labour markets (pp. 37-71). Similarly, Biagi and Lucifora (2008) investigated the impact of education on unemployment and revealed that higher educational attainment significantly decreases unemployment rates.
In this context, it is obvious that educational policies have been reconstructed to foster tertiary educational attainment in OECD countries in order to reduce unemployment rates in the OECD labour market. However, due to the economic crisis resulting from Covid-19 influencing employment rates negatively and current developments in internationalisation and digitalisation in higher education, it has been significant to find out the trends in tertiary educational attainment and employment as well as the effect of educational attainment on employment in tertiary education of the OECD countries. Therefore, in this research, the series of tertiary educational attainment and employment rates were investigated for 28 OECD countries during 2000-2020. This study aims to identify and compare the trends in educational attainment and employment rate in tertiary education in OECD countries between 2000 and 2020. Accordingly, the sub-objectives of the research are determined as follows:
- To detect and compare the highest percentages in educational attainment in tertiary education in OECD countries from 2000 to 2020,
- To detect and compare the lowest percentages in educational attainment in tertiary education in OECD countries from 2000 to 2020,
- To detect and compare the highest employment rates by tertiary educational attainment in OECD countries from 2000 to 2020,
- To detect and compare the lowest employment rates by tertiary educational attainment in OECD countries from 2000 to 2020,
- To identify the effect of tertiary educational attainment on employment in OECD countries in the period of 2000-2020.
Methodology
Research Design
In this study, a quantitative research design with a panel data analysis was adopted using the dataset obtained from the OECD (2022) data warehouse. Because the data has a two-dimensional structure including two research variables of the same countries over time, panel data analysis is performed to run a regression for these two dimensions (Davies & Lahiri, 1995). Therefore, a panel econometric approach was employed quantitatively for the collected data.
In order to understand the role of tertiary educational attainment in employment, the following questions were investigated in this research:
RQ1: What are the trends in tertiary educational attainment in OECD countries between 2000 and 2020?
RQ2: What are the trends in employment by tertiary educational attainment in OECD countries between 2000 and 2020?
RQ3: What is the effect of tertiary educational attainment on employment in OECD countries between 2000 and 2020?
Research Sample
The data for educational attainment and employment rate pertaining to 28 OECD countries and OECD- Average for the period of 2000-2020 was used to determine the characteristics of the research variables and the effect of educational attainment on employment rate as listed including their codes and values in Table 1.
Before the analysis, the data cleaning and formatting procedures were followed to exclude deficiencies in the dataset. Accordingly, the data for 10 OECD countries; namely, Austria, Chile, Colombia, Finland, Iceland, Israel, Lithuania, Luxembourg, New Zealand, and Norway, were expelled from the dataset because of the number of missing values.
Data Analysis
To address to RQ1 and RQ2, descriptive analyses were carried out on EXCEL to identify the percentages for tertiary educational attainment and employment rate in 28 OECD countries. For RQ3, a panel data analysis was performed to identify and compare the effect of tertiary educational attainment on employment in 28 OECD countries between 2000 and 2020.
Panel data consists of both cross-sectional and time-series components. Due to the time-series dimension, it is necessary to carry out a stationarity analysis. If the series is not stationary, its mean and/or variance do not remain stable over time, as a result of which the model predictions cannot be considered as accurate, and spurious correlation may occur. The unit root test is one method that tests if the series is stationary (Kwiatkowski et al., 1992), and two of the relevant unit root tests for the specific case of panel data are, among others, LLC (Levin, Lin, and Chu) and IPS (Im, Pasaran, and Shin) (Im et al., 2003; Levin et al., 2002). Therefore, in this study, first, the stationarity of the series is determined by LLC and IPS tests. In the case of non-stationarity, taking the difference of the series is typically sufficient to ensure that the series is stationary.
In the case of spurious correlation, linear regression would not be the correct method to follow because the causal relationship that occurs between variables may in fact be due to sheer coincidence or an unknown third variable that affects both variables. Engle and Granger (1987) suggested that two or more non-stationary series can be cointegrated such that they move towards equilibrium in the long run and that one should carry out cointegration tests instead of performing linear regression analysis. In the context of panel data, the panel cointegration tests developed by Kao et al. (1999) and Pedroni (1999) are commonly used.
Therefore, in the second step of the analysis, the existence of a cointegration relationship was examined via the Pedroni panel cointegration test. Seven cointegration tests of Pedroni have been utilized, divided into two categories. The first category consists of four tests in the “within” dimension while the second category consists of the other three tests in the “between” dimension.
After that, the direction and degree of a cointegration relationship between variables were examined via the FMOLS estimator. FMOLS (fully modified ordinary least squares) method allows cross-country heterogeneity (Pedroni, 2001). One source of heterogeneity is in the form of fixed effects, which accounts for differences in mean levels of variables of different countries. This is incorporated into the model by including country-specific intercepts. Another source of heterogeneity would come from differences in how countries respond to short-run deviations from equilibrium cointegrating relationships. This is incorporated into the model by allowing autocorrelation properties to vary across countries.
Finally, the causality relationship between the variables was examined through the Dumitrescu–Hurlin causality test. The panel Granger causality test, developed by Dumitrescu and Hurlin (2012), gives effective results even in panels with small units. In this method, the panel made up by both the cross-sectional dependence and heterogeneity between the countries can be tested; it can also be performed even when the time dimension (T) is larger or smaller than the cross-section dimension (N), and effective results can also be produced in unbalanced panel data sets (Baltagi, 2005). In the Dumitrescu - Hurlin panel Granger causality test, the absence of a Granger causality relationship across all cross-sections under the main hypothesis is tested against the alternative hypothesis that this relationship exists in at least one cross-section (Bozoklu & Yılancı, 2013).
Findings
The findings of the study are presented by addressing to the research questions, which report trends in tertiary educational attainment between 2000-2020 (RQ1), trends in employment rate in tertiary education between 2000-2020 (RQ2), and effects of tertiary educational attainment on employment between 2000-2020 (RQ3).
Trends in Tertiary Educational Attainment Between 2000 and 2020
Based on the results of descriptive analyses on the data for the educational attainment of 28 OECD countries in tertiary education, 5-year percentage values of these countries were investigated by determining the lowest and highest rates by year as listed in Table 2.
The highest rates for educational attainment in tertiary education belonged to Canada (40.1%, 46.0%, 50.3%, 55.2%, and 60.0%) in 2000, 2005, 2010, 2015, and 2020. Regarding the lowest percentages, Turkey had 8.3% of educational attainment in 2000, 10.2% in 2005, and 13.1% in 2010. Mexico had the lowest rates in tertiary education (16.3% and 19.4%) in 2015 and 2020.
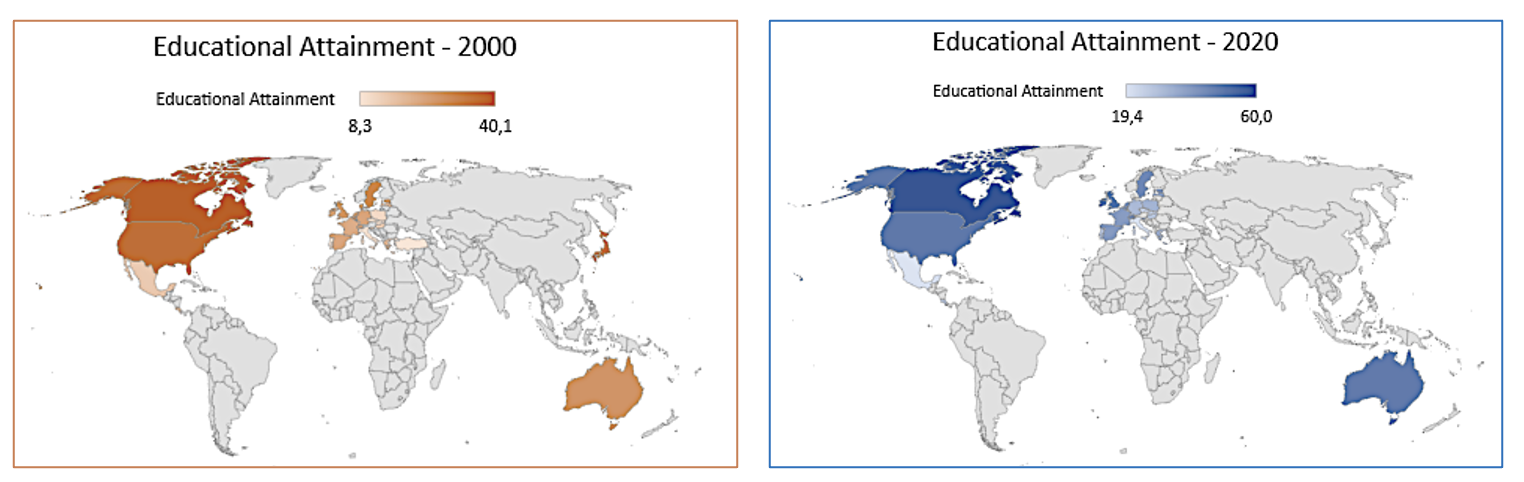
Figure 1 illustrates the rates of educational attainment in tertiary education in 2000 and 2020 on the world map. The lowest percentage was 8.3% in 2000 whereas it was 19.4% in 2020. As for the highest values, it was 40.1% in 2000 while 60.0% was depicted in 2020.
Trends in Employment by Tertiary Educational Attainment Between 2000 and 2020
According to the results of descriptive analyses on the employment rate of 28 countries by tertiary educational attainment, 5-year percentage values of these countries were listed by specifying the lowest and highest rates by year as presented in Table 3.
The highest employment rates by tertiary educational attainment pertained to Portugal (90.6%) in 2000, Switzerland (90.0%) in 2005, Sweden (87.7% and 89.3%) in 2010 and 2015, and Slovenia (90.4%) in 2020. However, the lowest rates of employment by tertiary educational attainment belonged to Korea (75.4%) in 2000, Turkey (75.2%, 75.7%, and 76.2%) in 2005, 2010, and 2015, and Greece (75.4%) in 2020.
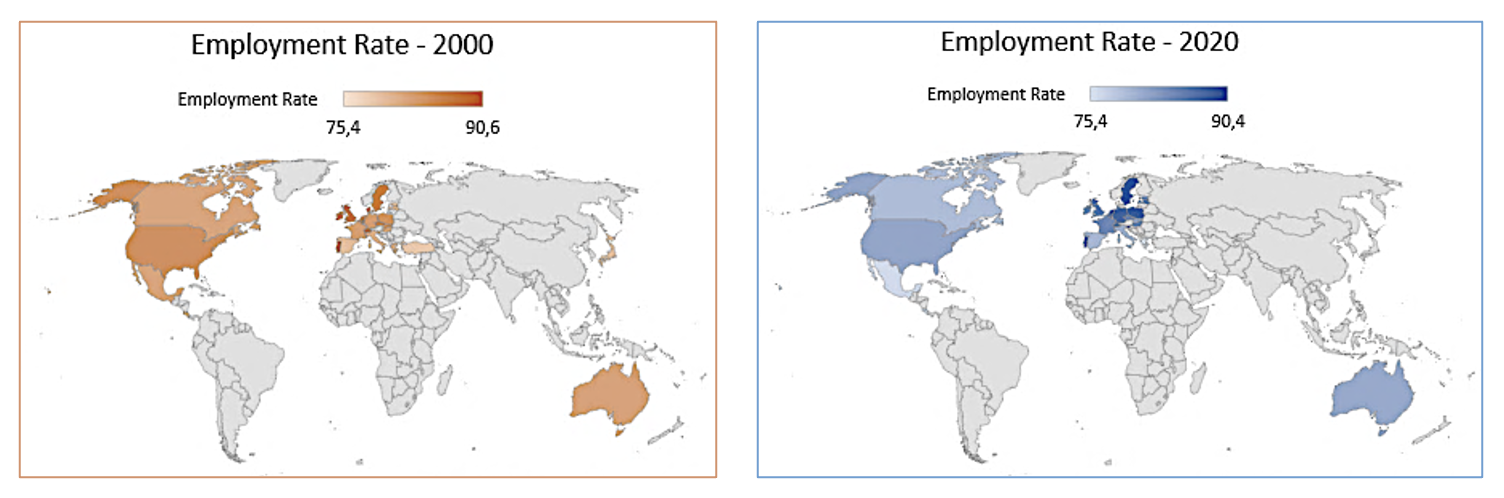
Figure 2 displays the employment rates in tertiary education in 2000 and 2020 on the world map. The lowest percentage was 75.4% in 2000 and 2020. Regarding the highest values, it was 90.6% in 2000 whereas 90.4% was illustrated in 2020.
Effects of Tertiary Educational Attainment on Employment in the Period of 2000-2020
The results of the unit root tests of the variables used in the study are presented in Table 4. Accordingly, it is obvious that the Educational Attainment (EDUATT) and Employment Rate (EMPRATE) series provide stationarity when the first difference is taken (I(1)) according to both the LLC and IPS tests.
As a result of the panel unit root tests, it was revealed that the variables used in the study were stationary when the first difference was taken (I(1)), not in levels (I(O)). Therefore, the Pedroni Panel Cointegration Test and the Kao Panel Cointegration Test were performed to examine the existence of the cointegration relationship in the long run.
The findings of the Pedroni and Kao cointegration tests are shown in Table 5. It is evident that four of the seven statistics analysed according to the Pedroni test were statistically significant (p<0.05). Therefore, the H0 hypothesis which means that there is no cointegration between the series is rejected. The statistical value of the Kao cointegration test performed as an alternative is also significant (p<0.05). Therefore, the H0 hypothesis which means that there is no cointegration between the series is also rejected.
When evaluated in general, there is a cointegration relationship between the series according to the findings of the tests that make up both panel and group statistics in the Pedroni and Kao cointegration tests. Therefore, in the long term, educational attainment and employment rate move together towards equilibrium.
After determining the long-term cointegration relationship between the variables, estimation was made with the FMOLS method to determine the direction and degree of the long-term relationship. The pooled least squares method is used in the FMOLS estimator. The findings of FMOLS estimation are presented in Table 6. Accordingly, the coefficient of the educational attainment variable is statistically significant (p<0.05). In this context, the employment rate goes down by 0.24 points for every point of tertiary attainment.
After examining the presence of panel cointegration between the variables, the causality relationship was examined by the Dumitrescu-Hurlin causality test as presented in Table 7.
According to the results of the Dumitrescu-Hurlin causality test in Table 7, among the variables examined, a one-way causality relationship from educational attainment to employment rate is observed.
Conclusion
The results of the research obviously indicate the trends in tertiary educational attainment and employment rates in 28 OECD countries between 2000 and 2020. According to the descriptive results, the highest rates for tertiary educational attainment refer to Canada whereas the lowest percentages are detected in Turkey and Mexico. The highest employment rates in tertiary education pertain to Portugal, Switzerland, Sweden, and Slovenia while the lowest rates of employment in tertiary education belong to Korea, Turkey, and Greece.
In this respect, the results of descriptive analyses reveal that educational policies employed to rise the amount of human capital with higher skills having tertiary educational attainment consistently project the trends in the actual increase in the rates during 2000-2020. Interestingly, it is remarkable that the countries with the highest educational attainment do not generally obtain a parallel increase in the employment rate, which could be because of some other social and economic factors. Consistently, Holmes (2013) indicated that the employment of the human capital with higher skills is a predictor of growth, but “it does not imply that mass higher education necessarily leads to higher growth” (p. R29).
Additionally, the results of the econometric analysis of the panel data evidently deduce that the employment rate goes down by 0.24 points for every point of tertiary educational attainment and a one-way causality relationship is found from educational attainment to employment rate from 2000 through 2020. Unlike the justifications for the development of educational policies to increase the skills of the workforce providing tertiary educational attainment, there is still a gap in unemployment for the graduates of higher education in 28 OECD countries. However, a one-way causality relationship from educational attainment to employment rate supports OECD educational policies for the development of tertiary educational attainment (McIntosh, 2008; OECD, 2021). Consistently, Biagi and Lucifora (2008), in their panel data analysis of European countries for the 1975–2002 period, empirically revealed that variations in unemployment rates significantly attribute to educational changes.
Briefly, this study contributes to the identification and comparison of the trends in tertiary educational attainment and employment rates in 28 OECD countries in the period of 2000-2020. It is recommended that the projections for the possible results of educational policies should be reconsidered over time including other factors that influence employment in higher education such as internationalisation and digitalisation.
Acknowledgments
The researchers express their gratitude to Dr. S. Pinar (Ceyhan) Darendeli, Adjunct Faculty & Research Fellow at Singapore Management University for her supervision in data analysis of the research with her expertise in econometrics.
References
Baltagi, B. H. (2005). Econometric Analysis of Panel Data (3rd ed.). John Wiley & Sons Ltd. https://library.wbi.ac.id/repository/27.pdf
Biagi, F., & Lucifora, C. (2008). Demographic and education effects on unemployment in Europe. Labour Economics, 15(5), 1076–1101. DOI: 10.1016/j.labeco.2007.09.006
Bozoklu, Ş., & Yılancı, V. (2013). Finansal gelişme ve iktisadi bütüme arasındaki nedensellik ilişkisi: Gelişmekte olan ekonomiler için analiz. Dokuz Eylül Üniversitesi İktisadi ve İdari Bilimler Fakültesi Dergisi, 28(2), 161-187. https://dergipark.org.tr/en/pub/deuiibfd/issue/22723/242510
Clarke, M. (2018). Rethinking employability: The role of capital, individual attributes and context. Studies in Higher Education, 43(11), 1923–1937. DOI: 10.1080/03075079.2017.1294152
Davies, A., & Lahiri, K. (1995). A new framework for analyzing survey forecasts using three-dimensional panel data. Journal of Econometrics, 68(1), 205–227. DOI:
Dumitrescu, E. I., & Hurlin, C. (2012). Testing for Granger non-causality in heterogeneous panels. Economic Modelling, 29(4), 1450-1460. DOI:
Engle, R. F., & Granger, C. J. W. (1987). Cointegration and error correction representation, estimation, and testing. Econometrica, 55(2), 251–276. DOI:
Grimaccia, E., & Lima, R. (2013, September). Public expenditure on education, education attainment and employment: a comparison among European countries. In XXVIII Conference of the Italian Association of Labour Economists (AIEL) Rome (pp. 1-18).
Holmes, C. (2013). Has the expansion of higher education led to greater economic growth? National Institute Economic Review, 224(1), R29–R47. DOI:
Im, K. S., Pesaran, M. H., & Shin, Y. (2003). Testing for unit roots in heterogeneous panels. Journal of Econometrics, 115(1), 53–74. DOI: 10.1016/S0304-4076(03)00092-7
Kao, C., Chiang, M.-H., & Chen, B. (1999). International R&D spillovers: An application of estimation and inference in panel cointegration. Oxford Bulletin of Economics and Statistics, 61, 691-709. DOI:
Kwiatkowski, D., Phillips, P. C. B., Schmidt, P., & Shin, Y. (1992). Testing the null hypothesis of stationarity against the alternative of a unit root: How sure are we that economic time series have a unit root? Journal of Econometrics, 54(1-3), 159–178. DOI:
Levin, A., Lin, C.-F., & Chu, C.-S. J. (2002). Unit root tests in panel data: asymptotic and finite-sample properties. Journal of Econometrics, 108(1), 1–24. DOI: 10.1016/S0304-4076(01)00098-7
Mason, G., Williams, G., & Cranmer, S. (2009). Employability skills initiatives in higher education: What effects do they have on graduate labour market outcomes? Education Economics, 17(10), 1–30. DOI: 10.1080/09645290802028315
McIntosh, S. (2008). Education and employment in OECD countries. UNESCO, International Institute for Educational Planning.
Niemann, D., & Martens, K. (2018). Soft governance by hard fact? The OECD as a knowledge broker in education policy. Global Social Policy, 18(3), 267–283. DOI:
OECD. (2017). OECD Handbook for Internationally Comparative Education Statistics: Concepts, Standards, Definitions and Classifications. OECD Publishing. http://doi.org/10.1787/9789264279889-en
OECD. (2021). Education at a Glance 2021: OECD Indicators. OECD Publishing. DOI:
OECD. (2022). Data warehouse. OECD.Stat [database]. DOI:
Pedroni, P. (1999). Critical values for cointegration tests in heterogeneous panels with multiple regressors. Oxford Bulletin of Economics and Statistics, 61, 653–670. DOI:
Pedroni, P. (2001). Fully modified OLS for heterogeneous cointegrated panels. In B. H. Baltagi, T. B. Fomby, & R. Carter Hill (Eds.), Nonstationary Panels, Panel Cointegration, and Dynamic Panels (Advances in Econometrics, Vol. 15, pp. 93-130). Emerald Group Publishing Limited. DOI:
Copyright information

This work is licensed under a Creative Commons Attribution-NonCommercial-NoDerivatives 4.0 International License.
About this article
Publication Date
31 December 2022
Article Doi
eBook ISBN
978-1-80296-129-4
Publisher
European Publisher
Volume
130
Print ISBN (optional)
-
Edition Number
1st Edition
Pages
1-270
Subjects
Strategic Management, Leadership, Technology, Post-Pandemic, New frontiers
Cite this article as:
Fayda-Kinik, F. S., & Cetin, M. (2022). An Econometric Analysis of Panel Data for Educational Attainment and Employment in Tertiary Education. In E. N. Degirmenci (Ed.), New Frontiers for Management and Strategy in the Post-Pandemic Era, vol 130. European Proceedings of Social and Behavioural Sciences (pp. 96-107). European Publisher. https://doi.org/10.15405/epsbs.2022.12.02.9