
Fuzzy Cognitive Strategic Map Hierarchies in Performance Measurement, Modeling and Reorganization


Abstract
The paper focuses on the use of Fuzzy Cognitive Mapping (FCM) in the Balanced Scorecard (BSC) performance measurement framework. We present a state of the art in the areas of performance measurement and BSC. We highlight the limitations of BSC frameworks and the drawbacks identified in strategic maps. We then present the FCM algorithm and its use in decision making as a solution to identified limitations and drawbacks. We elaborate on an FCM methodology and a supporting FCM software application called FCM Modeler for the development of FCM hierarchies. The methodology and the tool are used for the application of BSC in Operations Management (OM). The aim is to facilitate the OM decision making process by utilizing and exploiting the predictive modeling and analysis capabilities of FCMs. We present the design and simulation capabilities of the FCM Modeler tool and the analysis reports that can be produced in an OM Enterprise Resource Planning (ERP) case study.
Keywords: Balanced scorecard, business process management, enterprise resource planning systems, fuzzy cognitive maps, operations management, performance measurement
Introduction: Performance Measurement and the Balanced Scorecard
Performance Measurement Systems (PMS) provide managers with sets of measures and indicators that enable managers, stakeholders and shareholders to appropriately analyze organizational performance. They can set targets and objectives to employees, teams, departments, processes and the company as a whole in its strategic plan and link all these targets and objectives in a holistic manner. They can also assess the alignment of employee, process and departmental performance to strategic plan targets and objectives. In cases of poor performance or misalignment between strategic and lower level objectives corrective actions are undertaken so that performance levels reach appropriate standards thus ensuring company prosperity and sustainability (Glykas, 2015; Glykas, 2019a; Glykas 2019b; Glykas et al., 2018; Glykas & Johnichen, 2017; Glykas et al., 2015).
With the ever increasing pace in market conditions only organizations that can evolve and adapt fast to new conditions can survive and prosper. The need for proper design, implementation and utilization of Performance Measurement Systems, is greater than ever for organizations to respond to this challenge (Eccles & Roeser, 2011).The core of performance measurement systems, is the set of measures selected (Ampantzi et al., 2013; Chytas & Glykas, 2011; Glykas et al., 1993a; Glykas et al., 1993b; Glykas et al., 1993c; Glykas et al. 1993d; Glykas & Valiris 1992; Glykas et al. 1992; Pappa et al., 2013; Plakoutsi et al. 2013; Sezenias et al., 2013; Valiris et al., 2005; Valiris & Glykas, 2004; Valiris & Glykas, 2000; Valiris & Glykas, 1999a; Valiris & Glykas, 1999b; Valiris & Glykas 1998; Wilhelmij et al. 1993a; Wilhelmij et al., 1993b; Xirogiannis & Glykas, 2007). Of equal importance are the relationships that exist among measures and in particular the cause and effect relationships among them ought to be properly specified (De Waal, 2003; Glykas, 2013b; Glykas, 2013c; Glykas, 2013d; Glykas, 2013a; Glykas, 2012; Glykas & Chytas, 2004c; Glykas & Chytas, 2004d).
The Balanced Scorecard is one of the most well-known frameworks that can provide this kind of capability and it has been widely used in organizations for many decades (Kaplan & Norton, 1996). It comprises of four distinctive perspectives: the Customer Perspective measuring lead times, quality, performance, service, and costs, the Internal Business Perspective that focuses on core processes and competencies, based on measures such as cycle time, quality, employee skills, productivity etc., the Learning and Growth Perspective that comes from three principal sources, (a) People, (b) Systems, (c) Organizational procedures, and finally, the Financial Perspective based on financial performance measures like cash flow, sales growth, operating income by division, market share by segment, return in equity etc. (Kaplan & Norton, 2004).
Kaplan and Norton (2004) original ideas stated that the Balanced Scorecard should be used on the what to measure as strategic objectives in the four perspectives and their analysis should provide a way or path on how to manage strategy (Rafiq et al., 2020).
The founders of BSC also have suggested the utilization of strategic maps as a means to depict and analyze cause and effect relationships amongst measures (Kaplan & Norton, 2001). Studies have revealed, however, that only 6 in 10 executive managers have confidence in the data exhibited to them (Kellen & Wolf, 2003). The main drawback identified is that in the vast majority of cases organizations disregard the vital interdependencies and trade-offs among measures. The BSC fails to capture indirect interdependencies between the four dimensions (Marr et al., 2004). In addition, there is a lack of ability for a BSC designer to test scenarios and select the most suitable for the company under examination (Armstrong, 2019; Osterwalder et al., 2014) mainly due to the lack of proper simulation and analysis support. This kind of support is particularly needed in cases that there exists an expansive number of multidimensional factors that can influence relationships and interdependencies amongst measures (Holden et al., 1994; Glykas & Valiris 1999; Glykas & Litinas 1995; Glykas et al., 1994; Glykas 1994; Glykas & Holden 1994; Xirogiannis et al., 2008).
Researchers also indicated that the BSC is in many cases too abstract to present company specific performance measures (Norreklit et al., 2008), and as proof for this kind of performance measures generalization they presented surveys that revealed an extraordinary large number of identical performance measures being used for companies that operate in totally unrelated industries (Glykas, 2013a; Glykas, 2004; Glykas & Chytas 2004a; Stakias et al., 2013).
Based on these findings, Nielsen et al. (2016) have concluded that although research in management has been outstanding in the last fifteen years there is very little progress in the field of performance measurement and in particular in the BSC. The little progress in research related to the balanced scorecard has as a consequence resulted in small progress in research in strategy maps that appear to be bound to the slow progress pace of the BSC framework (Glykas, 2014; Glykas & Chytas 2005; Glykas & Chytas 2004b; Rigby & Bilodeau, 2015).
A Review of Required Strategic Map Principles
Some researchers argue that for the strategy map to reach full potential in performance management its relationship and direct reference to BSC should be loosened (De Waal, 2003). The most comprehensive study on the requirements of the new era of strategic maps was conducted by Islam (2018). He reviewed 41 publications focusing on strategy maps as well as 333 strategy map frameworks identified in the literature and proposed fourteen principles that should be satisfied for the future generation of strategic maps. The first five principles are mainly concerned with the link between strategic maps and the organization's strategy, vision and mission as well as the with the focus on key focus areas, strategic themes etc.
The remaining nine principles concentrate on more advanced issues all related to the drawbacks of the BSC identified by the researchers mentioned previously in this section. The study (Islam, 2018) revealed that there is a need for a hierarchical order in line with the organization's strategy and structure (principle 6). It also revealed that strategy maps should be constructed and be based upon strategic objectives that are linked amongst themselves, these business objectives could be mapped across several maps (principles 7 and 8). In strategy maps there is a need for incorporating the time element (principle 9) and in order to provide the notion of sequence (or time) strategic maps should firstly provide the ability of directional arrows between strategic objectives that create cause and effect relationships (principles10,11, 12 and 13). These cause and effect relationships depicted in arrows should be labeled with a "performance marker" that declares a positive (+) or negative (-) relationship between strategic objectives etc (principle 14). The study concludes that there are no frameworks observed providing performance markers with only one notable exception (Cardinaels & van Veen-Dirks, 2010). An example presented by Islam (2018) on the use of a would be future Strategic Map is presented in Figure 1:
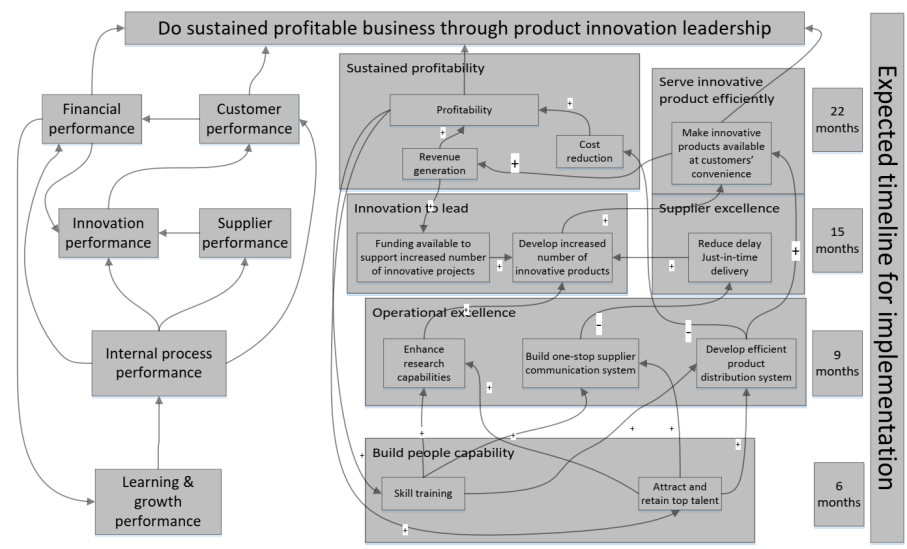
The map proposed can be divided into three distinct areas. The targets area or higher level targets in the left, the focus areas for the achievement of these targets in the middle and the time area in the right. The model proposed by Islam is based on the large number of principles gathered in his study but at the same time raises an even larger number of questions for the researchers in the area.
For example could every focus area in the middle column of the map be considered an expansion of a target? Can the target "Learning and growth performance" be achieved by the elements belonging to the "Build people capability" focus area? If this is the case why do we need both of them being present in a map? Could we create for example a lower level strategic map called "Build people capability" that will be linked to the target concept "Learning and growth performance"? How can we achieve the hierarchy of focus areas, strategic objectives or strategic themes if we do not do that?
Directed arrows create cause and effect relationships amongst concepts like business objectives, focus areas, strategic themes etc. These can have positive or negative markers indicating the type of influence. The flow appears to be bottom up from "learning and Growth Performance" towards "Do Sustained Profitable Business Through Product Innovation Leadership". However, this by no means creates a hierarchical relationship amongst focus areas etc but rather a cause and effect relationship amongst them.
There also appears to be a horizontal relationship between concepts belonging (also horizontally) to the same time slot. For example in the first six months the aim is the establishment of the "Learning and Growth Performance" target and in order to achieve it we need to focus to "Build People Capability" that requires "Skill Training" and "Attract and Retain Top Talent".
However, it is not clear why directional arrows of concepts in focus areas have performance markers (+ or -) and others do not. Does this mean that we have a positive, negative and neutral type of performance marker? Can we scale performance markers (low, medium or high)? Can we have performance markers on directed arrows of target concepts on the left side of the graph?
Can we calculate the level of the achievement of a target? Do concepts-targets have values? Could binary values like true or false be a suggestion? Could these values be true false or neutral (also called trivalent)? Could they be linear values?
The time element in the map resembles project management approaches with concepts (business objectives, strategic themes, focus areas) being represented as tasks and directional arrows being used in task dependencies in the project. A project manager could easily depict the map as a Gantt Chart.
From BSC to Business Models
The slow progress on BSC research has provided the appropriate conditions for the development of new approaches in the area of value chain creation which was the main focus of the BSC as it was initially developed. The most notable of these frameworks is called "business models" that focus on the analysis of new ways of creating value (Fielt, 2014; Osterwalder & Pigneur, 2010), developed by Gassmann et al. (2020).
The approach is composed of 55 patterns categorized in a four-dimensional framework: the value proposition (what?); value chain (how?); profit mechanism (why?); and target customer (who?). The approach, however, presents weaknesses in the creation of relationships between patterns, let alone the non existence of simulation or testing capabilities (Nielsen et al., 2016) and it is still in its infancy (Groth & Nielsen, 2015).
In recent years relationships between patterns has been enhanced and an interesting approach for the interlinking of these 55 patterns has been developed. Patterns (presented as nodes) and their relationships are presented in the so called business models "network". An example of a network diagram is presented in the picture bellow:
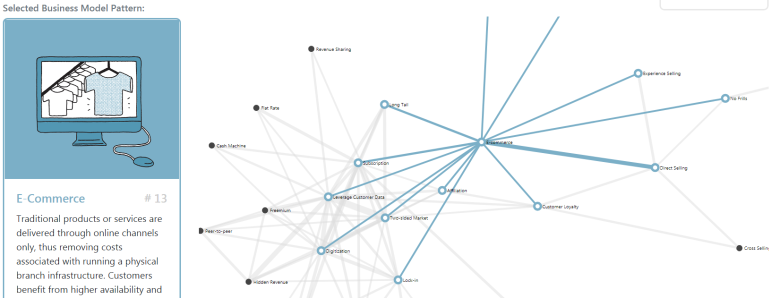
The figure presents a description of the E-Commerce pattern and its relationships to the remaining patterns. The E-Commerce pattern is at the centre of the network. In a similar way the user can select another pattern related to E-Commerce, for example the "Subscription" pattern and then be transferred to a similar page as shown in the picture bellow:
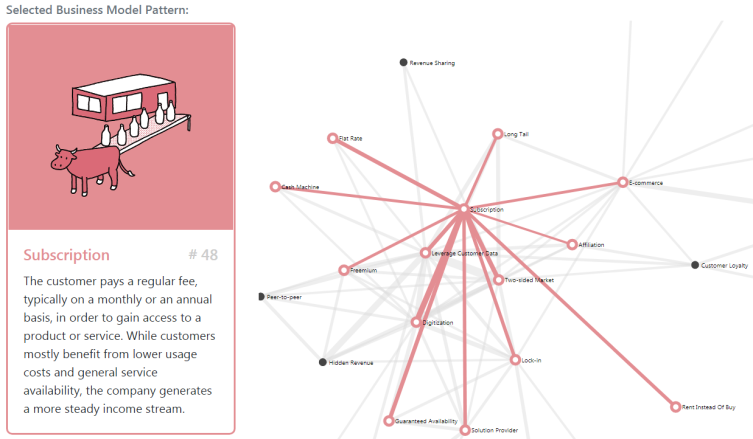
In Figure 3, the E-Commerce pattern appears on the top-right area and the Subscription pattern in the centre of the network highlighted. By following this process the user can navigate in a three dimensional space of nodes and relationships and explore pattern linkages. The aim of this network is to provide navigational capabilities for informational purposes and present selected case studies per pattern in additional web pages, however this network map can not by any means be considered a strategy map and there is no relation to Islam's (2018) strategic map principles presented earlier.
Fuzzy Cognitive Maps in Decision Analysis
Decision analysis focuses on assisting human decision making to choose the most optimal amongst specific alternatives. Each alternative is assessed based on the outcomes of variables-measures or sets of interlinked predefined variables-measures. Decision Trees (DT) is one of the most well known decision analysis methodologies and is based on machine learning techniques like Neural Networks (d'Alché-Buc al., 1994; Xirogiannis & Glykas, 2004; Glykas, 2011a; Glykas 2011b) or Bayesian Networks (Janssens et al., 2006; Janssens et al., 2004; Xirogiannis et al., 2010).
Several researchers have been articulating the benefits of using Decision Trees in Fuzzy Cognitive Maps (Podgorelec et al., 2002; Papageorgiou 2010).
The most notable of these research efforts is the model developed by (Groumpos 2010; Groumpos & Karagiannis, 2013) that combines the FCM model with Decision Treesand Decision Analysis theory.
The proposed model is based on the Nonlinear Hebbian Learning (NHL) algorithm and the resulting Decision Tree-Fuzzy Cognitive Map’s (DT-FCM) creation process is presented in figure 4:
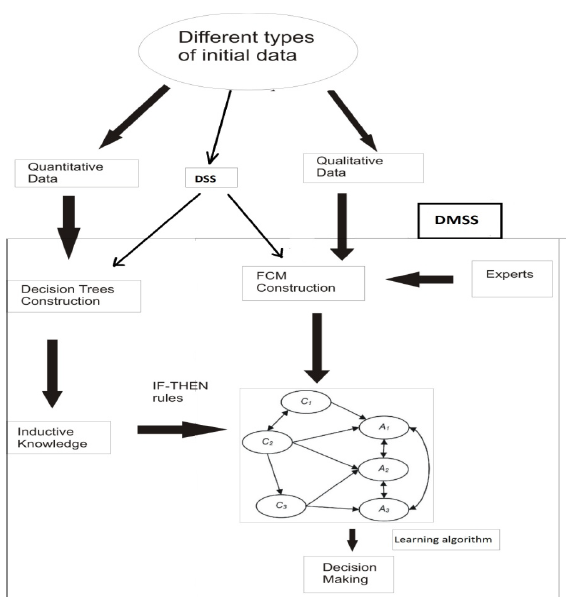
Experts' knowledge is used as a basis for the creation of Decision Trees and create rules for the construction of their associated Fuzzy Cognitive Maps (FCMs) (Xirogiannis et al., 2008). FCMs allow the assignment of cause and effect relationships with the use of directed weights with values in the range of 1 to -1. The FCM model-mapis created based on experts knowledge (mainly providing the concepts-nodes and their relationships) and if-then (or cause and effect) rules provided via the DT analysis. The FCM algorithm can be assigned historical data value sets (or training sets) to test its validity. Via the use of the supervised NHL algorithm modifications and alterations on FCM design will result in a validated FCM in which sets of initial values produce the expected results (Groumpos, 2010; Groumpos & Karagiannis, 2013).
The Groumpos model provided the basis of the use of FCMs in decision making (Xirogiannis et al., 2010). However, there was a lack of automated software tools to support the model as it required the use of cumbersome and continuous mathematical calculations (Glykas & Xirogiannis 2005; Glykas 2010).
The Proactive Balanced Scorecard Methodology (PBSCM)
Chytas and Glykas (2011) proposed a solution to the drawbacks of strategy maps and business models stated above. They provided a tool and methodology that automated and supported the Groumpos DT-FCM model.
They also used and augmented the tool and their methodology for the application of Fuzzy Cognitive Maps (FCMs) in performance measurement and the Balanced Scorecard approach (Chytas et al., 2010). Research mainly focused on the utilization of Fuzzy Cognitive Maps (FCMs) for the creation of Strategy Maps and their interlinking for the creation of hierarchies. In their modelmeasures are represented by nodes and their cause and effect relationships are presented by directed arcs (Chytas et al., 2008). These directed arcs can be assigned fuzzy values in the range of -1 to 1 as the FCM algorithm suggests.
The resulting methodology and software tool provide the ability of map interlinking via common nodes amongst maps in a hierarchical or sequential manner. The tool also offers simulation capabilities based on the FCM theory and algorithm utilized (Xirogiannis et al., 2004).Simulation has proven to be very suitable for strategic mapping and analysis in a holistic manner with business objectives, represented as concepts or nodes and interlinked in process maps from the strategic level all the way down to maps of individual employees (Chytas & Glykas, 2011).
The proposed methodology called a "Proactive Balanced Scorecard Methodology" (PBSCM) is depicted in figure 5. PBSCM is capable of illustrating non-linear interactions and feedback loops using FCMs and performing what-if scenarios through the use of FCMs simulation.
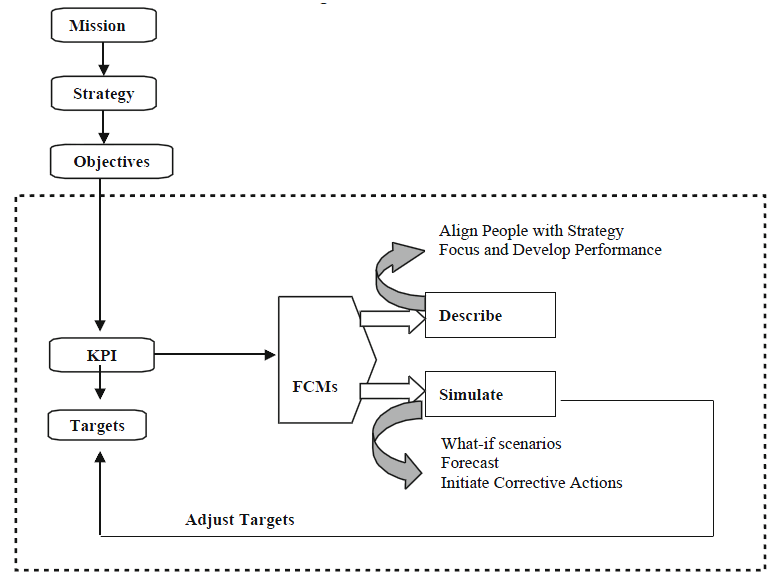
The PBSCM stages of FCM creation and their interlinking for the development of strategic maps are presented in table 1. Maps are created by business domain experts and/or professionals specializing in the fields of Performance Measurement and if possible in the BSC:
The FCM Modeler Tool
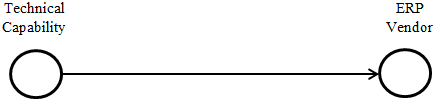
In the FCM Modeler Tool concepts-nodes represent decision variables or business metrics-measures. Relationships amongst concepts are represented by directional arcs (Glykas, 2013a). Directional arcs depict the cause and effect relationships amongst concepts-nodes. In figure 6 for example the “Technical Capability”cause concept-node affects the “ERP Vendor” concept:
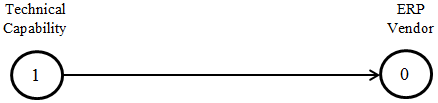
FCM Modeler Tool concepts-nodes states have three distinct values in the most widely used triangular mode, namely:-1,0 and1 as illustrated in7.
The values of the concepts above can be externally defined. During simulation concept values are calculated in accordance with the FCM algorithm i.e on the sum of multiplications of node value times arc value of all incoming directed arcs. In cases of positive causal relationships, an increase in the value of the cause concept will increase the value of the effect concept and vice versa. In negative causal relationships, an increase in the value of the cause concept will decrease the value of the effect concept and vice versa. The degree of belief or certainty that a relationship exists is numerically signified with a number in the bipolar interval of [-1,…,1]. The negative values in that range signify a negative causal relationship, while the positive values mean a positive causal relationship.
The graph in figure 8 shows schematically the assignment of a relationship weight (+0.7) to our example.
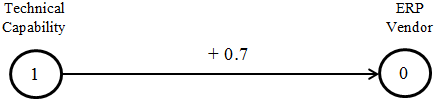
In the example above the Technical Capability concept has a positive causal relationship which will increase the ERP Vendor concept and in simulation the value of ERP Vendor will become one (1) as the thresholds in the trivalent simulation mode are two: -0,5 and 0.5. This means that if the sum of all incoming directed graph multiplications (concept value * arc value) is equal or greater than 0.5 the value of the effect node will be one (1), if the sum is in the range -0.5> sum <0.5 then effect concept value will be 0, if the sum is less or equal to -0.5 then the effect value will be -1.
An arc value of zero (0) indicates that there is no relationship between the cause and effect concepts and therefore there is no need for an arc to exist between the cause and effect concepts.
The FCM Modeler Tool: Rules for Strategic-Operations Map Design
In the FCM modeller tool, FCM concepts or nodes are classified into three categories (Glykas, 2013a):
: Have only outgoing arrows
Have incoming and outgoing arrows
: have only incoming arrows
There are some basic rules that FCM designers should follow:
:“A map has to contain at Least Two nodes and a relationship between them”
Cause nodes in an FCM have to be triggering nodes, i.e. they have to get a value either from a lower level FCM or from the external environment. Intermediate nodes are also allowed to become triggering nodes but it is a good standard to create FCMs with cause nodes as triggering nodes.
: “Cause and intermediate are triggering nodes that take values either from lower level FCMs or from the external environment”
Only effect or intermediate nodes from a lower level FCM may be linked to cause or intermediate nodes of a higher level FCM. The ideal situation is to link effect nodes from a lower level to cause nodes in a higher level FCMs.
: “Only effect or intermediate nodes from a lower level FCM can be linked to cause or intermediate nodes of a higher level FCM. The user should try to link effect from lower to cause in higher level FCMs.”
Another synchronization constraint is related with the number of links that a single node can have with nodes from lower level FCMs.
Only one node from each FCM at a lower level is allowed to be linked with a node of an FCM at a higher level for consistency purposes.If the user wants more than one node at a lower level to be linked with one node at a higher level then, the user must create additional FCMs to cater the case.
: “Anode in a higher level FCM cannot be linked with more than one nodes of lower level FCMs.”
The FCM modeler tool provides all necessary functionality for the design of FCMs. It also provides functionality for FCM map simulation. The calculation of the next state of an effect node is calculated by the sum of multiplications of the value of each cause node multiplied by the weight of its causal relationship. For instance, if we draw a map in the FCM modeler tool as show in figure 9 the concepts “Technical Capability”, “Reputation” and “Ongoing Service” influence the concept “ERP Vendor” with positive causal relationships with weights of 0.5, 0.2 and 0.3 respectively:
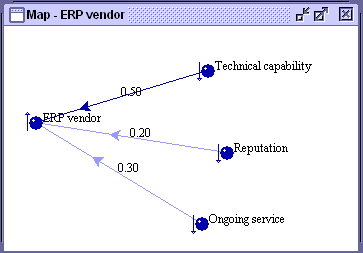
The FCM calculation formula of the next state of ERP Vendor during simulation is:
Value of Technical Capability * 0.5 + Value of Reputation * 0.2 + Value of Ongoing Service * 0.3 = Value of ERP Vendor
Beside each one of the three cause concepts of the ERP Vendor map (Technical Capability, Reputation, Ongoing Service) there is a downward pointing arrow (), this means that the concept's initial value will be calculated by a lower level FCM whose simulation should finish before the enactment of simulation of the ERP Vendor FCM.
Beside the effect concept node ERP Vendor there is an upward pointing arrow () which declares that at the end of the simulation of the ERP Vendor FCM the value of this concept will be passed to a concept of a higher level FCM (or FCMs) with the exact same name.
FCM Hierarchies in ERP Selection for Operations Management
The FCM Modeler Tool includes four different map categories in accordance to the BSC perspectives:
including all metrics related to core business activities.
including all human resources related and external stimuli concepts.
including all infrastructure and assets related concepts with emphasis on technology infrastructure.
including basically concepts falling under more than one of the above three categories and all strategy related concepts.
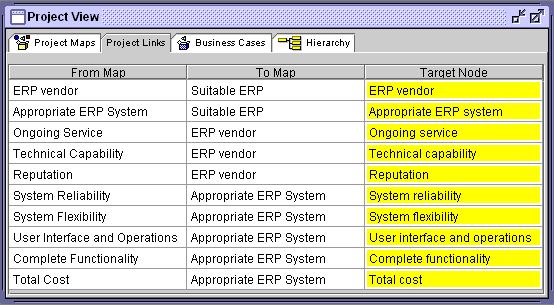
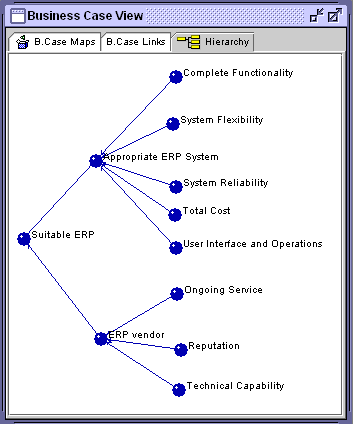
FCM hierarchies are considered "Projects" in the FCM Modeler tool. The first time a user opens the application is presented with an empty project structure (i.e. Business Models, Social Models, Technical Models, and Integrated Models). Via concept-node interlinking the FCM Modeler tool creates the FCM Hierarchy or "Project". For each FCM the system identifies higher and lower level FCMs until the hierarchy has been formed. The hierarchical decomposition of concepts in FCMs produces a group of dynamically interconnected hierarchical FCMs. In order to test its validity, the FCM Modeler tool was used in amultinational firm, in which the operations management department has used it in the ERP selection process. The aim was to solve problems in the ERP selection process as stated by Cebeci (2009) and Bieńkowska et al. (2016). Due to confidentiality reasons we present a sample of the full study. Eleven FCMs were created for this particular application. The figure bellow depicts the concepts-nodes that are interlinked amongst these FCMs:
Based on the node interlinking mechanism of Figure 10 the system creates the hierarchy shown in picture 11:
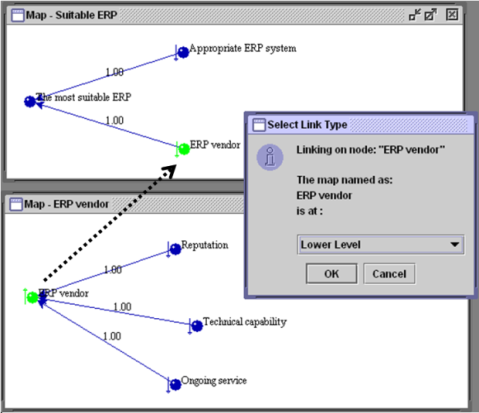
Figure 12 presents the system interface for the generation of the hierarchical relationship between two FCMs, the “Suitable ERP” and “ERP Vendor”. The two FCMs are linked via the concept “ERP vendor”:
Simulating Projects-FCM Hierarchies.
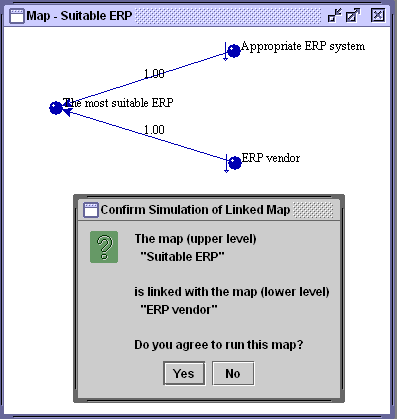
During simulation the user can either select to run the lower level map or assign external values to interlinked nodes. The final FCM hierarchy of our example is shown in Figure 13:
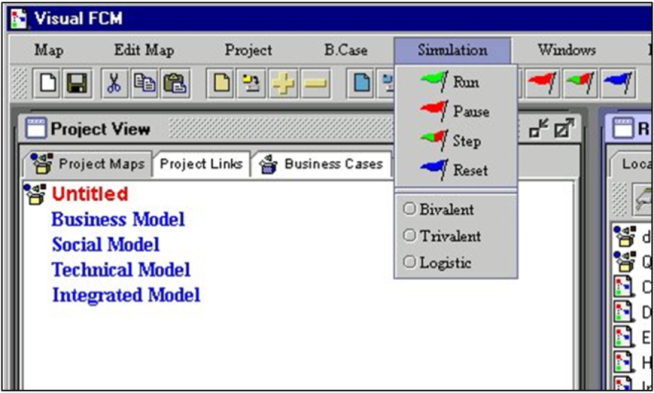
The "Simulation" module of the FCM Modeler Tool is depicted in the picture bellow. FCM simulation can commence via the "run" option and paused at any point in time via the "Pause"option. Simulation can also be performed on a step by step basis via the "Step" option thus the user can monitor closely concept-node value modification during simulation. The "Reset" option reassigns initial concept-node values. The set of these initial FCM concept-values are set by the domain experts when the model is applied to a company and is called a "Business Case". Each company can have its tailor made business case.
There are three simulation modes in the FCM Modeler tool algorithm as shown in picture 14:
, ,
, ,
The default FCM algorithm is set to Trivalent.
During FCM hierarchy simulation the user is informed on the existence of FCM dependencies and then decides on whether to select interlinked node values from external inputs, as set in the company specific business case, or via the simulation of low level maps.
Table 2 presents how the FCM Hierarchy how the hierarchy algorithm works during simulation:
Reports are produced in the form of HTML files and provide the user with a detailed, step-by-step description of the simulation of FCM hierarchies. Reports present the Business Case Hierarchy as the project is now used for a specific company. It also shows the step by step change in Concept Values including their initial or external values at each step. By analyzing these reports, the user can extract very useful information on the validity of: the model, the cause and effect relationships and the produced results via the application of the FCM algorithm. Reports are also used for training set and historical data analysis and simulation.
Conclusions
We presented Islam's (2018) proposed fourteen principles for proper strategy map frameworks. The first five principles are mainly concerned with the link between strategic maps and the organization's strategy, vision and mission as well as the with the focus on key focus areas, strategic themes etc. We presented the"Proactive Balanced Scorecard Methodology" (PBSCM)that provides the capability of illustrating non-linear interactions and feedback loops using FCMs and performing what-if scenarios through the use of FCMs simulation. PBSCM covers and expands Islam's first five principles.
The remaining nine of Islam's principles concentrate on more advanced issues. The study revealed that there is a need for a hierarchical order in line with the organization's strategy and structure (principle 6). It also revealed that strategy maps should be constructed and be based upon strategic objectives that are linked amongst themselves, these business objectives could be mapped across several maps (principles 7 and 8). In strategy maps there is a need for incorporating the time element (principle 9) and in order to provide the notion of sequence (or time) strategic maps should firstly provide the ability of directional arrows between strategic objectives that create cause and effect relationships (principles 10, 11, 12 and 13). These cause and effect relationships depicted in arrows should be labeled with a "performance marker" that declares a positive (+) or negative (-) relationship between strategic objectives etc (principle 14).
FCMs as exemplified by the extended FCM Modeler Tool and the capability of simulation hierarchy can provide a solution to all aforementioned Islam's advanced principles (6 to 14). FCMs can further enhance the BSC and strategic maps frameworks as they provide simulation capabilities of FCMs hierarchies with concepts-nodes being interlinked amongst maps. They also allow the assignment of negative or positive fuzzy weights in cause and effect relationships between concepts and provide "fuzzy weighted performance markers".
The validity of the use of FCMs in BSC and strategy maps was tested on an application on operations management and ERP selection in a multinational firm. In the future the methodology and the tool will be further tested in the field of operations management in several core operations of firms operating in different industries.
References
Ampantzi, C., Psyllou, M., Diagkou, E., & Glykas, M. (2013). Managing the SME Clustering Process Life-Cycle. In: Glykas, M. (Eds.), Business Process Management. Studies in Computational Intelligence, vol. 444. Springer, Berlin, Heidelberg. DOI:
Armstrong, R. (2019). Revisiting strategy mapping for performance management: a realist synthesis. International Journal of Productivity and Performance Management, 68(4), 721-752. DOI:
Bieńkowska, A., Walecka-Jankowska, K., & Zgrzywa-Ziemak, A. (2016). The Impact on the Organisational Effects of the Implementation of ERP and Selected Management Methods. In: Dudycz, T., Osbert-Pociecha, G., Brycz, B. (Eds.), The Essence and Measurement of Organizational Efficiency. Springer Proceedings in Business and Economics. Springer, Cham. DOI: 10.1007/978-3-319-21139-8_2
Cardinaels, E., & van Veen-Dirks, P. M. G. (2010). Financial versus non-financial information: The impact of information organization and presentation in a Balanced Scorecard. Accounting, Organizations and Society, 35(6), 565-578. DOI:
Cebeci, U. (2009). Fuzzy AHP-based decision support system for selecting ERP systems in textile industry by using balanced scorecard. Expert Systems With Applications, 36(5), 8900-8909. DOI:
Chytas, P., & Glykas, M. (2011). A proactive balanced scorecard. International Journal of Information Management, 31(5), 460-468. DOI:
Chytas, P., Glykas, M., & Valiris, G. (2010). Software Reliability Modelling Using Fuzzy Cognitive Maps. In: Glykas, M. (Eds.), Fuzzy Cognitive Maps. Studies in Fuzziness and Soft Computing, Vol. 247. Springer, Berlin, Heidelberg. DOI: 10.1007/978-3-642-03220-2_9
Chytas, P., Glykas, M., & Valiris, G. (2008). A Proactive fuzzy cognitive balanced scorecard. IEEE International Conference on Fuzzy Systems (IEEE World Congress on Computational Intelligence), 1331 – 1338. DOI:
d'Alché-Buc, F., Zwierski, D., & Nadal, J. P. (1994). Trio Learning: A new strategy for building hybrid neural trees. International Journal Of Neural Systems, 5(4), 259-274. DOI:
de Waal, A. A. (2003). The future of the Balanced Scorecard: an interview with Professor Dr Robert S. Kaplan. Measuring Business Excellence, 7(1), 30-35. DOI:
Eccles, J. S., & Roeser, R. W. (2011). Schools as developmental contexts during adolescence. Journal of research on adolescence, 21(1), 225-241. DOI:
Fielt, E. (2014). Conceptualising business models: definitions, frameworks and classifications. Journal of Business Models, 1(1), 85-105. DOI:
Gassmann, H., Frankenberger, K., & Csik, M. (2020), The Business Model Navigator. Pearson Education Limited, Harlow. https://www.pearson.com/en-us/subject-catalog/p/business-model-navigator-the-the-strategies-behind-the-most-successful-companies/P200000004274/9781292327129.
Glykas, M. (2019a). Quality Management Review: A Case Study of the Application of the Glykas Quality Implementation Compass. Journal of Multidisciplinary Engineering Science and Technology, 6(12). https://www.jmest.org/wp-content/uploads/JMESTN42353230..pdf
Glykas, M. (2019b). Audit Process Quality Management in the Airlines Sector with Glykas Quality Compass. International Journal of Management Sciences and Business Research, 8(12), 155-183. DOI:
Glykas, M., Valiris, G., Kokkinaki, A., & Koutsoukou, Z. (2018). Banking Business Process Management Implementation. International Journal of Productivity Management and Assessment Technologies, 6(1), 50-69. DOI:
Glykas, M., & Johnichen, G. (2017). Quality and Process Management Systems in the UAE Maritime Industry. International Journal of Productivity Management and Assessment Technologies, 5(1), 20-39. DOI:
Glykas, M., Bailey, O. H., Al Maery, M. O., & Al Maery, N. O. (2015). Process and Quality Management in Vocational Education & Training (VET). International Journal of Management Sciences and Business Research, 4(10). https://www.ijmsbr.com/Volume%204%20Issue%2010%20Paper%2013%20Final.pdf.
Glykas, M. (2015). Cluster Business Processes Management with 3D Immersive Environments. International Journal of E-Entrepreneurship and Innovation, 5(2), 1-23. DOI:
Glykas, M. (2014). Fuzzy Cognitive Strategic Maps. In: Papageorgiou, E. (Eds.), Fuzzy Cognitive Maps for Applied Sciences and Engineering. Intelligent Systems Reference Library, Vol. 54. Springer, Berlin, Heidelberg. DOI: 10.1007/978-3-642-39739-4_17
Glykas, M. (Ed.), (2013a). Business Process Management. Studies in Computational Intelligence, Vol. 444. Springer, Berlin, Heidelberg. DOI:
Glykas, M. (2013b). State of the Art in Business Process Management. In Glykas, M. (Ed.), Business Process Management. Studies in Computational Intelligence, Vol. 444. Berlin, Springer. DOI:
Glykas, M. (2013c). Fuzzy cognitive strategic maps in business process performance measurement. Expert Systems with Applications, 40(1), 1-14. DOI:
Glykas, M. (2013d). Fuzzy Cognitive Strategic Maps in Business Process Performance Measurement. In: Glykas, M. (Eds.), Business Process Management. Studies in Computational Intelligence, Vol. 444. Springer, Berlin, Heidelberg. DOI:
Glykas, M. (2012). Performance measurement scenarios with fuzzy cognitive strategic maps. International Journal of Information Management, 32(2), 182-195. DOI:
Glykas, M. (2011a). Effort Based Performance Measurement in Business Process Management. Knowledge and Process Management, 18(1), 10-33. DOI:
Glykas, M. (2011b). Performance Measurement in Business Process, Workflow and Human Resource Management. Knowledge and Process Management, 18(4), 241–265. DOI:
Glykas, M. (Ed.), (2010). Fuzzy Cognitive Maps. Studies in Fuzziness and Soft Computing, Vol. 247. Springer, Berlin, Heidelberg. DOI:
Glykas, M., & Chytas, P. (2005). Next generation of methods and tools for team work based care in speech and language therapy. Telematics and Informatics, 22(3), 135–160. DOI:
Glykas, M., & Xirogiannis, G. (2005). A soft knowledge modeling approach forgeographically dispersed financial organizations. Soft Computing, 9(8), 579-593. DOI:
Glykas, M. (2004). Workflow and process management in printing and publishing firms. International Journal of Information Management, 24(6), 523-538. DOI:
Glykas, M., & Chytas, P. (2004a). Team work based care in speech and language therapy through web-based tools and methods. Studies in Health Technology and Informatics. Medical and Care Compunetics, 103(1), 343-354.
Glykas, M., & Chytas, P. (2004b). Technological innovations in asthma patient monitoring and care. Expert Systems with Applications, 27(1), 121–131.
Glykas, M., & Chytas, P. (2004c). Web-based Asthma Collaboration Management and Public Awareness. Studies in health technology and informatics, 103(6), 19-27.
Glykas, M., & Chytas, P. (2004d). Technology assisted speech and language therapy. International Journal of Medical Informatics, 73(6), 529-541.
Glykas, M., & Valiris, G. (1999). Formal methods in object oriented business modeling. The Journal of Systems and Software, 48(1), 27-41. DOI:
Glykas, M., & Litinas, N. (1995). From rapid growth to maturity: The need for holistic methodologies in business process redesign. In The Proceedings of the 3rd European Conference on Information Systems (pp. 525-545). Athens. https://scholar.google.com/scholar?cluster=3618163568627170957&hl=en&oi=scholarr
Glykas, M., Holden, T., & Wilhelmij, P. (1994). Modelling safety-critical organizational processes using the Agent Relationship Morphism Mehodology. Proceedings of the Twenty Seventh IEEE Annual Hawaii International Conference on System Sciences, 693-702. https://www.infona.pl/resource/bwmeta1.element.ieee-art-000000323450
Glykas, M. (1994). Glykas, M. (1994). Agent Relationship Morphism Analysis [Doctoral dissertation, University of Cambridge]. https://scholar.google.com/scholar?cluster=1393481433258069 5199&hl=en&oi=scholarr
Glykas, M., & Holden, T. (1994). Enterprise Modelling And Process Design Techniques For Configuration Management. Information Engineering Division, Department Of Engineering, University Of Cambridge. https://scholar.google.com/scholar?cluster=175316654723104 72236&hl=en&oi=scholarr
Holden, T., Glykas, M., Wilhelmij, P., & Reynolds, B. (1994). Lifetrack: Organisational Modelling for Safety-Critical Decision Support. In F. Redmill, & T. Anderson (Eds.), Technology and Assessment of Safety-Critical Systems. DOI:
Glykas, M., Holden, T., & Wilhelmij, P. (1993a). Modelling the collective behaviour of organisational agents in the petrochemical industry using the agent relationship morphism analysis (ARMA) methodology. In Proceedings of the OOPSLA 93 Workshop on Modelling the Collective Behaviour of Organisational Agents. https://scholar.google.com/scholar?cluster=7055167842 088038095&hl=en&oi=scholarr
Glykas, M., Wilhelmij, P., & Holden, T. (1993b). Verifiable object oriented designs. In Proceedings of the eleventh international conference on Technology of object-oriented languages and systems, Prentice-Hall (New Jersey). https://www.infona.pl/resource/bwmeta1.element.ieee-art-000000323450
Glykas, M., Wilhelmij, P., & Holden, T. (1993c). Formal methods in object orientation. In Proceedings of the European Conference on Object Oriented Programming (ECOOP), 93, 26-30. https://scholar.google.com/scholar?cluster=5658196128190734691&hl=en&oi=scholarr
Glykas, M., Wilhelmij, P., & Holden, T. (1993d). Object orientation in enterprise modelling and information system design. In COLLOQUIUM DIGEST-IEE, 1(7), 8-8. IEEE. https://scholar.google.com/scholar?cluster=891183205452238597&hl=en&oi=scholarr
Glykas, M., & Valiris, G. (1992). ARMA: a multi‐disciplinary approach to BPR. Knowledge and Process Management, 6(4), 213-226. DOI: 10.1002/(SICI)1099-1441(199912)6:4%3C213::AID-KPM60%3E3.0.CO;2-Q
Glykas, M. M., Patel, U., Sutcliffe, A. G., Dodson, D. C., & Hackett, T. (1992). Towards Interactive Explanation by 3D Visualisation. In Proceedings of Workshop on Task Based Explanation, Research Laboratory of Samos, University of the Aegean. Scolar URL: https://scholar.google.com/scholar?cluster=15986035171611753884&hl=en&oi=scholarr
Groth, P., & Nielsen, C. (2015). Business model taxonomies: using statistical tools to generate valid and reliable business model taxonomies. Journal of Business Models, 3(1), 4-21. DOI:
Groumpos, P. P. (2010). Fuzzy Cognitive Maps: Basic Theories and Their Application to Complex Systems. In M. Glykas (Eds.), Fuzzy Cognitive Maps. Studies in Fuzziness and Soft Computing, Vol. 247. Springer, Berlin, Heidelberg. DOI:
Groumpos, P. P., & Karagiannis, I. E. (2013). Mathematical Modelling of Decision Making Support Systems Using Fuzzy Cognitive Maps. In M. Glykas (Eds.), Business Process Management. Studies in Computational Intelligence, Vol. 444. Springer, Berlin, Heidelberg. DOI:
Islam, S. (2018). A practitioner’s guide to the design of strategy map frameworks. Pacific Accounting Review, 30(3), 334-351. DOI: 10.1108/PAR-05-2017-0038
Janssens, D., Wets, G., Brijs, T., Vanhoof, K., Arentze, T., & Timmermans, H. (2004). Improving Performance of Multiagent Rule-Based Model for Activity Pattern Decisions with Bayesian Networks. Transportation Research Record: Journal Of The Transportation Research Board, 1894(1), 75-83. DOI:
Janssens, D., Wets, G., Brijs, T., Vanhoof, K., Arentze, T., & Timmermans, H. (2006). Integrating Bayesian networks and decision trees in a sequential rule-based transportation model. European Journal of Operational Research, 175(1), 16-34. DOI:
Kaplan, R. S., & Norton, D. (2004). The strategy map: guide to aligning intangible assets. Strategy and Leadership, 32(5), 10-17. DOI:
Kaplan, R. S., & Norton, D. P. (2001). The strategy-focused organization. Strategy & Leadership, 29(3). DOI:
Kaplan, R. S., & Norton, D. (1996). Using the Balanced Scorecard as a Strategic Management System. Harvard Business Review, 74(1), 75–85.9
Kellen, V., & Wolf, B. (2003). Business performance measurement. Information Visualization, 1(312), 1-36.
Marr, B., Schiuma, G., & Neely, A. (2004). The dynamics of value creation: mapping your intellectual performance drivers. Journal of Intellectual Capital, 5(2), 312-325. DOI:
Nielsen, C., Lund, M., & Thomsen, P. (2016). Killing the balanced scorecard to improve internal disclosure. Journal of Intellectual Capital, 18(1), 45-62. DOI:
Norreklit, H., Jacobsen, M., & Mitchell, F. (2008). Pitfalls in using the balanced scorecard. The Journal of Corporate Accounting and Finance, 19(6), 65-68. DOI:
Osterwalder, A., & Pigneur, Y. (2010). Business Model Generation: A Handbook for Visionaries, Game Changers, and Challengers. John Wiley & Sons, Hoboken, NJ.
Osterwalder, A., Pigneur, Y., Bernarda, G., & Smith, A. (2014). Value Proposition Design: How to Create Products and Services Customers Want. John Wiley & Sons.
Pappa, E., Giakoumis, M., Voxaki, V., & Glykas, M. (2013). Managing Organizational Intellectual Capital. In M. Glykas (Eds.), Business Process Management. Studies in Computational Intelligence, vol 444. Springer. DOI:
Papageorgiou, E. I. (2010). A Novel Approach on Constructed Dynamic Fuzzy Cognitive Maps Using Fuzzified Decision Trees and Knowledge-Extraction Techniques. In: Glykas, M. (Eds.), Fuzzy Cognitive Maps. Studies in Fuzziness and Soft Computing, Vol. 247. Springer, Berlin, Heidelberg, DOI:
Plakoutsi, A., Papadogianni, G., Glykas, M. (2013). Performance Measurement in Business Process, Workflow and Human Resource Management. In: Glykas, M. (Eds.), Business Process Management. Studies in Computational Intelligence, Vol. 444. Springer, Berlin, Heidelberg. DOI:
Podgorelec, V., Kokol, P., Tiglic, S. B., & Rosman, I. (2002, October). Decision Trees: An Overview and Their Use in Medicine. Journal of Medical Systems, 25(5), 445-463. DOI:
Rafiq, M., Zhang, X., Yuan, J., Naz, S., & Maqbool, S. (2020). Impact of a Balanced Scorecard as a Strategic Management System Tool to Improve Sustainable Development: Measuring the Mediation of Organizational Performance through PLS-Smart. Sustainability, 12(4), 1365-1382. DOI:
Rigby, D., & Bilodeau, B. (2015). Management Tools & Trends 2015. Bain and Company, Inc., Boston, M.A.
Sezenias, E., Farmakis, A., Karagiannis, G., Diagkou, E., & Glykas, M. (2013). A Holistic Business Performance Measurement Framework. In M. Glykas (Eds.), Business Process Management. Studies in Computational Intelligence, Vol. 444. Springer. DOI: 10.1007/978-3-642-28409-0_3
Stakias, G., Psoras, M., & Glykas, M. (2013). Fuzzy Cognitive Maps in Social and Business Network Analysis. In M. Glykas (Ed.), Business Process Management. Studies in Computational Intelligence, Vol. 444. Springer. DOI:
Valiris, G., Chytas, P., & Glykas, M. (2005). Making decisions using the balanced scorecard and the simple multi-attribute rating technique. Performance Measurement and Metrics, 6(3), 159-171. DOI:
Valiris, G., & Glykas, M. (2004). Business analysis metrics for business process redesign. Business Process Management Journal, 10(4), 445. DOI:
Valiris, G., & Glykas, M. (2000). A Case Study on Reengineering Manufacturing Processes and Structures. Knowledge and Process Management, 7(1), 20-28. DOI: 10.1002/(SICI)1099-1441(200001/03)7:1%3C20::AID-KPM61%3E3.0.CO;2-8
Valiris, G., & Glykas, M. (1999a). Critical review of existing BPR methodologies the need for a holistic approach. Business Process Management Journal, 5(1), 65-86. DOI:
Valiris, G., & Glykas, M. (1999b). Developing Solutions for Redesign. In J. Zupančič, W. Wojtkowski, W. G. Wojtkowski, & S. Wrycza (Eds.), Evolution and Challenges in System Development. Springer. DOI: 10.1007/978-1-4615-4851-5_56
Valiris, G., & Glykas, M. (1998) Management science semantics for object-oriented business modelling in BPR. Information and Software Technology, 40(8), 417– 433. DOI:
Wilhelmij, P., Glykas, M., & Holden, T. (1993a). Formal Methods in Object Orientation. Proceedings of the European Conference on Object Oriented Programming (ECOOP), 93, 26-30. https://dl.acm.org/doi/proceedings/
Wilhelmij, P., Glykas, M., & Holden, T. (1993b). Object Oriented Information Systems Development. In Proceedings of the 4th Hellenic Conference.
Xirogiannis, G., Glykas, M., & Staikouras, C. (2010). Fuzzy Cognitive Maps in Banking Business Process Performance Measurement. In M. Glykas (Ed.), Fuzzy Cognitive Maps. Studies in Fuzziness and Soft Computing, Vol. 247. Springer. DOI:
Xirogiannis, G., Chytas, P., Glykas, M., & Valiris, G. (2008). Intelligent impact assessment of HRM to the shareholder value. Expert Systems with Applications, 35(4), 2017-2031. DOI: 10.1016/j.eswa.2007.08.103
Xirogiannis, G., & Glykas, M. (2007). Intelligent modeling of e-business maturity. Expert Systems with Applications, 32(2), 687-702. DOI:
Xirogiannis, G., & Glykas, M. (2004). Fuzzy casual maps in business modeling andperformance-driven process re-engineering. In Methods and Applications of Artificial Intelligence. Springer. DOI:
Xirogiannis, G., Stefanou, J., & Glykas, M. (2004). A fuzzy cognitive map approach to support urban design. Expert Systems with Applications, 26(2), 257-268.
Copyright information

This work is licensed under a Creative Commons Attribution-NonCommercial-NoDerivatives 4.0 International License.
About this article
Publication Date
31 December 2022
Article Doi
eBook ISBN
978-1-80296-129-4
Publisher
European Publisher
Volume
130
Print ISBN (optional)
-
Edition Number
1st Edition
Pages
1-270
Subjects
Strategic Management, Leadership, Technology, Post-Pandemic, New frontiers
Cite this article as:
Kouroupaki, I., Mpafas, C., & Glykas, M. (2022). Fuzzy Cognitive Strategic Map Hierarchies in Performance Measurement, Modeling and Reorganization. In E. N. Degirmenci (Ed.), New Frontiers for Management and Strategy in the Post-Pandemic Era, vol 130. European Proceedings of Social and Behavioural Sciences (pp. 239-259). European Publisher. https://doi.org/10.15405/epsbs.2022.12.02.18