
Regional Assessment of the Quality of Life in the Northwestern Federal District


Abstract
The paper presents the findings into regional imbalances in quality-of-life indicators. The authors grouped the indicators based on statistical data from the National Set of SDG Indicators collection. The basic approaches to characterizing the quality of life was reviewed. Sampling of indicators was specified. A focus on sustainable development parameters was grounded. Based on 10 indicators, the regions-entities of the North-Western Federal District of the Russian Federation were scored. The indicators were grouped as follows: income component, health component, education component, economic development component. The selected statistical data was translated into relative values, in relation to the average Russian values to obtain objective data on current imbalances in achieving the overall development potential. The findings can be used as guidelines for improving regional sustainable development programs. In particular, the Pskov region, the Nenets Autonomous Okrug, the Republic of Karelia, which received the minimum scores, can be recommended, as soon as possible, to expand the potential for economic growth, address high income differentiation of the population, an existing lag in public health and education from the all-Russian data. The presented original assessment tools will be further tested on data from other regions of the Russian Federation. A follow-up monitoring of indicators is planned to identify the trends in the target entities.
Keywords: Quality of life, regional imbalances, SDG, sustainable development program
Introduction
The year 2015 could be viewed as a benchmark for a major renewal of the UN member states, aimed at achieving the parameters of sustainable development. Seventeen basic goals were set to be implemented by 2030. Russia included these guidelines in the state social and economic programs. The list of national SDG indicators of the Russian Federation was developed in compliance with the resolution of the UN General Assembly A/RES/71/313 of July 6, 2017. Statistical databases are being generated to monitor SDG indicators, both at the national and regional levels. Sustainable development implies both protecting favorable environment for future generations and improving the quality of life of those living today. It is important to equalize the national living standards in all territories. The social and economic category ‘quality of life’ is actively discussed by representatives of various scientific fields. The assessments of the concepts ‘life’ and ‘quality of life’, from philosophical, legal, economic perspectives, and a set of indicators, the choice of assessment tools are debatable. At least 50 different approaches have been proposed to characterize the components of the quality of life of the population, with varying degrees of accuracy. Estimates are based on statistical parameters processed, data from sociological surveys.
Problem Statement
The study focused on the problem of high differentiation of Russian regions in social and economic indicators, which hinders smooth and consistent national progress. In earlier papers concerned with SDG achievements in the Russian Federation, the authors identified regional imbalances and confirmed the hypothesis that the regions that demonstrated the lowest parameters for SDG implementation were not able to lay the groundwork for potential growth on their own, were significantly dependent on inter-budget transfers (Koltsova & Starobinskaya, 2021). Persistent inequality, including quality of life, stimulates outflows of labor resources to the most comfortable residential areas, which contributes to further aggravation of regional imbalances in economic and production potential, in budget revenues and the possibility of implementing national goals across the country.
Research Questions
It seems important to constantly monitor the parameters that characterize certain qualitative and quantitative dimensions of life in different regions nationwide. With this in view, it is necessary to have a practical methodology based on a sample of indicators that provide an objective assessment sensitive to regional specific character. The methodology should be tested based on a sample of regions that take neither leading nor lagging positions by mutual parameters.
The paper deals with regional imbalances in achieving the SDGs in light of the quality of life of the population. It provides a specific assessment of the quality of life in the regions-entities of the Northwestern Federal District. The district was chosen because it unites regions: having different natural and climatic features; implementing variable areas of economic activity, industrial specialization; differentiated by a population.
The National Set of SDG indicators, a collection of statistical data, was chosen as the information base which combines indicators (about 160) calculated by various ministries and departments of the Russian Federation (from Rosstat to Roshydromet) (National Set of SDG indicators, 2019, 2020). The time period is fixed for 2019, with indicators for education for 2020 (many data are currently comparable in these parameters). Further testing of the methodology involves expanding the time estimates, follow-up monitoring of indicators.
Purpose of the Study
The study aims to develop a set of methods for a comprehensive assessment of the quality of life of the population, by selecting parameters from the national SDG database. The proposed approach should provide an opportunity for identifying regional imbalances and focusing on specific problems in the target region. The original methods are sensitive to well-known approaches to determining the characteristics of the quality of life.
Research stages:
- identifying common requirements for assessment tools based on a review of attitudes popular in the scientific community;
- selecting indicators characterizing the quality of life in Russian regions based on the information base;
- developing criteria for assigning a comprehensive score for the target indicators;
- conducting a rounded scoring based on data from 11 regions of the Northwestern Federal District;
- generalizing the effectiveness of assessment tools and the findings.
Research Methods
The study was based on a hypothetical-deductive method. The authors also used some elements of quantitative and qualitative analysis, synthesis and analogy.
From the 160 indicators available for national SDGs, 10 indicators were selected, grouped as follows: income component, health component, education component, economic development component.
The indicators were converted into relative terms to the average data for the Russian Federation. The criteria for scoring the indicators were selected in accordance with the range of resulting calculated data (above average, average for the group, below average). The share of each indicator was calculated depending on the number of indicators in the group. Thus, for the groups “income component”, “education component” there were two indicators, with a specific weight of 0.5. In the groups “health component” and “economic development component” – 3 indicators, each with a specific weight of 0.(3).
The calculations were made in Excel. A score was assigned for each calculated value of indicators. The maximum possible value was 4 points.
Findings
First of all, here is a brief overview of the most popular, widely used methods, covering data for calculations for the Russian Federation.
The first block involves the original methods developed by Russian researchers for carrying out complex assessments. They include Kapelyushnikov’s publications devoted to assessing the quality of life through the parameters of human capital development; Kislitsina’s complex indicator (2016) – national index of quality of life (based on 82 indicators in 10 key aspects from health assessment to environmental assessments); methodology for regional assessment proposed by the team of authors Kozlova et al. (2015) etc. (combination of statistical assessments and online opinion poll findings); Shumetov’s (2012) methodology for a regional index of the quality and standard of living (calculation of indicators based on a method that involves the “region-year” parameter as a statistical unit); rating regional assessment provided by a group of authors, aimed at comparing regions in the quality of life and HDI rankings (Kuznetsov et al., 2017).
The second block includes publications that highlight certain aspects, zones of assessments of living standards and quality of life – Bobkov and Odintsova’s (2020) approach aimed at identifying groups where the quality and standard of living is low; method proposed by the team of authors Shakleina et al. (2020), measuring social comfort.
The common characteristics in all these attitudes and techniques provide a number of requirements for a comprehensive assessment of the quality of life, which the authors bring into the original method proposed in the paper:
1. It must range over groups of indicators that assess the status of health, education, income level, and opportunities to meet material needs. Additional characteristics include parameters of social well-being, gender equality, political situation, environmental conditions in the region. Selecting indicators for a comprehensive regional assessment, the authors did not disregard that indicators characterizing the rate of poverty and uneven distribution of income are often included in a comprehensive assessment of the quality and standard of living. This dimension is especially relevant in the light of economic challenges during the pandemic. Thus, according to Shirov (2021), the relatively favorable macroeconomic indicators achieved in 2020 were accompanied by significant social losses. It needs to be addressed and included in the current assessment. Therefore, the income component is presented in the comprehensive assessment, based on the Gini coefficient and the proportion of the population living below the national poverty line. The standard of public health is assessed by healthy life expectancy (implemented parameter), coverage of citizens with preventive check-ups (area of state responsibility) and the share of the population regularly engaged in physical culture and sports (personal contribution of citizens to health promotion and improved life expectancy).
It was difficult to select data characterizing the educational component, since the indicators of enrollment in higher and secondary educational programs could produce biased estimates due to the centralization of education governance in a priority subject within the Federal District. Therefore, the authors here opted for the parameters of basic secondary education, assessing trends in the level of training and the proportion of students of the corresponding age group who have not mastered the basic program, in accordance with the Federal State Educational Standard (FSES). The economic growth component is presented based on the three indicators – the share of GRP per capita (defining opportunities for final consumption), the share of households with Internet connection (a proxy for the level of consumption of intangible goods) and the share of public roads that meet statutory requirements (infrastructure assessment).
2. Data requirements involve such criteria as choice of data type (objective statistical, subjective opinion poll findings, or combined); timespan for sampling indicators; completeness of data – availability of data for all assessed groups; possibility of evaluation procedures at the national level and in the regional context. An objective assessment was chosen based on statistical data, as it has a number of advantages. There is no need to attract external funding. It is possible to use publicly available data. It is convenient to compare calculations for groups of target entities in different time periods. The indicators selected according to the priority statistical base met all the necessary requirements. The fact that data was converted into relative values allowed for actual parameters that differ in units of measurement.
3. Assessment tools should be easy to calculate, present the final data, both static and dynamic; the identified parameters should be visual, accessibly aligned when drawing up development programs; preference is given to full-fledged, integral assessments. The tools developed within the study comply with all the basic requirements. Table 1 shows the basic indicators, their grouping, average data for the Russian Federation, criteria for assigning a score, variability of points and the formula for the composite index.
The composite score, calculated by summing up all the points received, is presented as a diagram (Figure 01). It features a significant differentiation of regions, nearly twofold discrepancies – St. Petersburg had the leading position (2.82), the minimum values were obtained for the Pskov region (1.17). No subject of the Northwestern Federal District reached the maximum calculated value of 4 points. While the average score in the group was 2.08, 6 subjects showed higher data (leaders in quality of life) and 5 regions showed lower scores (outsiders).
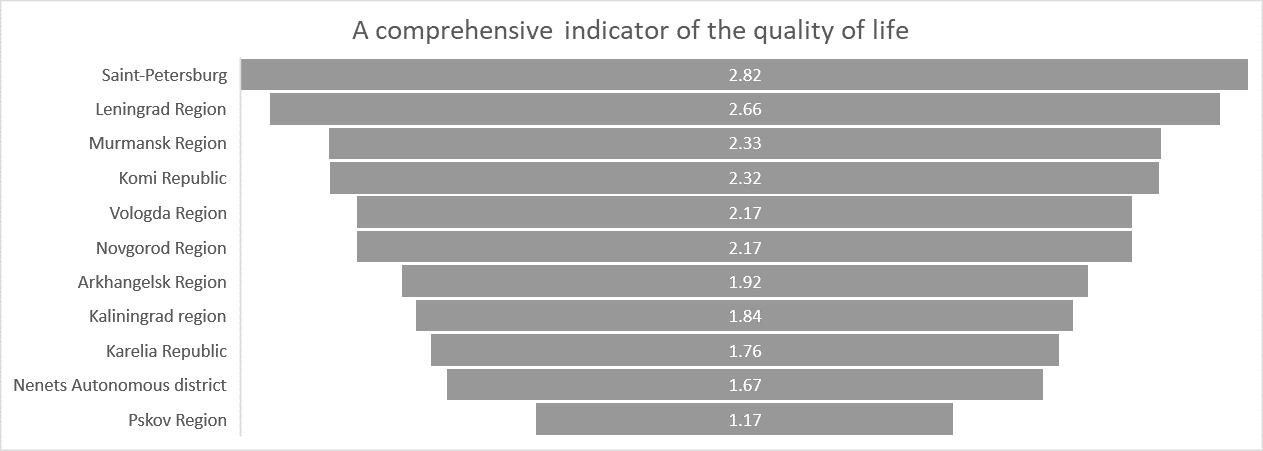
It is important to analyze the divergence in estimates by components shown in Table 2. Thus, for income, the minimum estimates (0.25) indicate a significant number of the population receiving incomes below the subsistence minimum with a high income concentration index. For health – the minimum score (0.33) reports cumulative problems with promoting pubic health (less than the national average for healthy life expectancy and minimal participation in preventive check-ups). The regions that received values at the level of 0.25 for the education component are likely to face the problem of the quality of education at higher educational levels and a shortage of qualified personnel in the future. Values of 0.17–0.34 points for the group of indicators of economic development indicate significant barriers to meeting the basic material and non-material needs of the population in the respective entities.
Conclusion
The findings suggest the following conclusions.
Firstly, the data presented in the statistical materials on National Set of SDG indicators can be used for a comprehensive assessment of the quality of life of the population, in order to further improve the regional development policy of the Russian Federation.
Secondly, there is a need to subsequently specify a number of indicators for a common statistical selection: shifting from absolute to relative values, calculating for individual areas in the regional context.
Thirdly, assessment tools presented by the author will be further tested on data from other regions of the Russian Federation. A follow-up monitoring of indicators is planned to identify the trends in the target entities.
References
Bobkov, V. N., & Odintsova, E. V. (2020). Low level and quality of life among economically active population: identification criteria and assessment of occurrence. Economic and Social Changes: Facts, Trends, Forecast, 13(5), 168–181. DOI:
Kislitsyna, O. A. (2016). Measurement of the quality of life / well-being: international experience. Institute of Economics of the Russian Academy of Sciences.
Koltsova, A. A., & Starobinskaya, N. M. (2021). Sustainable Economic Development – Regional Imbalances. Proceedings of the Second Conference on Sustainable Development: Industrial Future of Territories (IFT 2021) (pp. 157–162). Atlantis Press. DOI:
Kozlova, O. A., Gladkova, T. V., Makarova, M. N., & Tukhtarova, E. Kh. (2015). Methodical approach to measuring the quality of life of the population of the region. Economy of Regions, 2, 182–193. DOI:
Kuznetsov, S. V., Rastova, Yu. I., & Rastov, M. A. (2017). Rating as a measure of assessing the quality of life in Russian regions. Economy of Regions, 13, 137–146.
National Set of SDG Indicators (2019, 2020). Federal State Statistics Service. https://rosstat.gov.ru/sdg/national
Shakleina, M. V., Volkova, M. I., Shaklein, K. I., & Yakiro, S. R. (2020). Theoretical and methodological problems of measuring social comfort: results of empirical analysis based on Russian data. Economic and Social Changes: Facts, Trends, Forecast, 13(5), 135–152. DOI:
Shirov, A. A. (2021). The pandemic crisis: The mechanisms of development and solutions for economic policy. Journal of the New Economic Association, 1(49), 209–216. DOI:
Shumetov, V. G. (2012). Methodology for analyzing the quality of life of the population at the regional level. Economics and Management, 2, 218–226.
Copyright information

This work is licensed under a Creative Commons Attribution-NonCommercial-NoDerivatives 4.0 International License.
About this article
Publication Date
25 November 2022
Article Doi
eBook ISBN
978-1-80296-127-0
Publisher
European Publisher
Volume
128
Print ISBN (optional)
-
Edition Number
1st Edition
Pages
1-742
Subjects
Sociolinguistics, linguistics, semantics, discourse analysis, translation, interpretation
Cite this article as:
Koltsova, A. A., Starobinskaya, N. M., Kostikova, N. N., & Tikhonova, A. M. (2022). Regional Assessment of the Quality of Life in the Northwestern Federal District. In D. Bataev, S. A. Gapurov, A. D. Osmaev, V. K. Akaev, L. M. Idigova, M. R. Ovhadov, A. R. Salgiriev, & M. M. Betilmerzaeva (Eds.), Social and Cultural Transformations in the Context of Modern Globalism (SCTCMG 2022), vol 128. European Proceedings of Social and Behavioural Sciences (pp. 371-377). European Publisher. https://doi.org/10.15405/epsbs.2022.11.52