
Forecasting Of The Cost Of Building Materials In A Volatile Market


Abstract
The article proposes a methodology for forecasting market price indicators of one of the main structural elements of the cost of construction material resources. Predictive models are developed taking into account changes in social and economic factors based on neural network methods. The authors provide recommendations on the use of a predictive model in managing the cost of construction products in the system of construction cost engineering. Conclusions and recommendations on the use of neural network models for predicting the cost of material resources in the system of cost engineering in construction: the developed methodology allows planning prices for building materials, taking into account changes in social and economic factors in the regional building materials market; the use of neural network predictive models of the cost of building materials is effective at various stages of the investment and construction process - when planning capital investments, when forming the estimated cost, when determining the price of contracts.
Keywords: Building materials market, forecast mathematical model, neural network modeling, pricing forecasting
Introduction
Capital construction in the sphere of state material production with a market economy occupies one of the leading positions. The specificity of the types and purposes of construction products, as an industry, predetermines the features and originality of methods and approaches to the pricing system of individual subjects of investment activity at various stages of the creation of fixed assets.
Today, the issue of increasing the competitiveness of construction enterprises is especially relevant. In turn, the solution to this problem is possible when creating an effective management system focused on achieving strategic goals.
The stable development of a construction organization is impossible without the active use of cost engineering; in particular, construction cost management tools, as an integral part of general management system of the enterprise (Samara Center for Pricing in Construction, 2020; Vlasova et al., 2020).
The new principles of market relationships between the subjects of investment and construction activities put economic and technological problems of material resources management on one of the first places.
The concept of «material resources» includes building materials, products, structures, parts, semi-finished products necessary for the production of construction products. The nomenclature of material resources used in construction production amounts to hundreds of thousands of items. All the varieties of building materials for monitoring purposes are combined into enlarged groups. The importance of individual elements of the general list of building materials is determined by decomposing the estimated cost of capital construction objects and structural elements into their components, highlighting the main pricing components.
The grouping and classification of material resources is a format of specified nomenclature lists in the form of generalized groups and subgroups, comparable in terms of technical characteristics of elements, taking into account their structural homogeneity. The assessment of the relative importance of material resources within each group is carried out by ranking them by cost in the general structure of costs for the implementation of construction and installation work on the object as a whole, as well as by individual base build design.
Building cost management at various stages of the life cycle of an investment project largely depends on the economic justification of the need for resources, their quantitative, qualitative and cost indicators.
The methodology of pricing in construction, the development of a system of contractual relations based on firm contract prices determines the need for enterprises in the construction industry, investors, customers, contractors, designers to obtain objective information on the price indicators of construction resources corresponding to the real time periods of investment planning, preparation of project documentation, construction, putting the facility into service (Geraskin & Rostova, 2020).
The process of planning future costs is impossible without scientifically grounded approaches to predicting the resources cost based on market monitoring of their current cost. Continuous monitoring of the prices of materials is carried out in each region, as a rule, by regional authorities for pricing in construction. To organize such monitoring and present its results, it is necessary to use a unified system of classification of material resources in construction. To develop predictive models, we used a standard typology of building materials.
Problem Statement
The process of planning future costs is impossible without scientifically grounded approaches to predicting the resources cost based on market monitoring of their current cost. Continuous monitoring of the prices of materials is carried out in each region, as a rule, by regional authorities for pricing in construction. To organize such monitoring and present its results, it is necessary to use a unified system of classification of material resources in construction. To develop predictive models, we used a standard typology of building materials.
Research Questions
In the context of crisis management, management decisions in the field of pricing based on methods that are sensitive to changes in economic factors come to the fore in the construction industry (Geraskin & Kuznetsova, 2020; Geras'kin & Chkhartishvili, 2017; Komarevtseva, 2017; Ramzaev et al., 2016, 2017, 2020). Of the modern forecasting methods with maximum sensitivity, the neural network modeling method can be distinguished as the most preferable for this parameter (Borovikov, 2001).This method is often used in various fields, for example, such as predicting optimal technological parameters in injection molding, stamping tooling (Demyanenko & Popov, 2012; Grechnikov et al., 2016; Grechnikov et al., 2018) , additive technologies (Agapovichev et al., 2017; Smelov et al., 2016), in modeling the structure of a material (Grechnikov & Khaimovich, 2015). Often these calculations are performed using BIG DATA technology (Bogdanov et al., 2018).
Purpose of the Study
Forecasting the cost of building materials in a volatile market based on neural network modelling.
Research Methods
The methodology for predicting pricing in the building materials market should be as follows:
- Carrying out scaling of estimated prices by elements and groups of typological grouping.
- Carrying out scaling of data on social and economic parameters for 2020, affecting the development of pricing in the construction industry.
- Development of the structure of the perceptron for the neural network for predicting the development of estimated prices in the Samara region.
- Construction of neural networks in the Statistica package, error analysis and selection of the optimal network for further modeling.
- Carrying out training of the optimal network to obtain forecast estimates of changes in estimated prices in the Samara region.
- Development of a predictive model of the level of change in the estimated cost in the region based on the statistical and social and economic parameters of the development of the Samara region.
- Recommendations for using the results of the neural network model in the pricing management system in the construction industry.
The scaling of estimated prices for the elements of the typological grouping is carried out according to the formula:
(1)
where is the new calculated value, is the original table value, is the maximum value in a row, is the minimum value in a row.
The type of scaled data in the «Metal goods and structures» group is shown in Table 1.
The following indicators are attributed to the social and economic parameters, presumably (based on empirical estimates) influencing the formation of the price of material resources in construction:
- inflation;
- scope of work by type «construction»;
- commissioning of residential buildings;
- industrial production indices.
The general and scaled social and economic parameters of the Samara region development in 2020 selected for modeling purposes are presented in Table 2 and Table 3.
The stages of predictive model development of the level of change in the estimated cost in the region are formed on the basis of statistical and social and economic parameters of the development of the Samara region by the method of neural network modelling (Borovikov, 2001; Grechnikov & Khaimovich, 2015 ) and include:
- development of a perceptron structure for a neural network for forecasting the development of estimated prices in the Samara region;
- building neural networks in the Statistica package;
- error analysis;
- selection of the optimal network for further modeling;
- modeling of a new estimated price for a group of building material resources.
The basic principle of neural network formation (BPNN module in the Statistica package) is to minimize the error function using the gradient descent method.
As experimental data, we used statistical data on the price of reinforced concrete products for the period from March to December 2020 of the «metal goods and structures» group, as well as data on inflation in the Samara region for the same period.
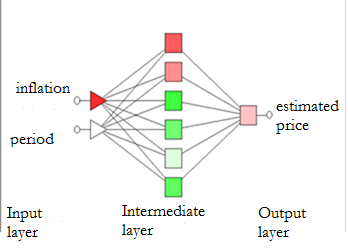
The results of ten of these twelve experiments were taken as training sets. Six more kits were taken as test kits. When each training sample was introduced, an ensemble of models with different experimental and training errors was obtained. In the BPNN module for this study, a three-layer perceptron was developed, consisting of an input, hidden (intermediate) and output layers. Among these layers, there are 2 processing elements of the input layer, including «inflation» and «period». The processing of elements in the output layer has one characteristic, the estimated cost of the building material. A schematic diagram of a three-layer perceptron is shown in Figure 1.
A set of perceptrons constitutes a tutorial neural network that studies through the establishment of connections by input and output parameters based on learners and test sets. The goal of training a network is to build a functional relationship between input and output during training. Thereafter, the weight function and the displacement of the intermediate layer can be obtained. The output value will be close to the target value. The error function criterion is adopted in the network as follows:
(2)
where and , accordingly, represent the given output and predicted parameters of the j -th output neuron in the output layer.
The training steps of the perceptron in the BPNN module should be as follows:
Step 1: enter the input vector X and set the output vector T of the training sequence.
Step 2: calculate the output vector H of the intermediate layer.
(3)
where i is the quantity of input neurons, j is the number of output neurons, к is the number of neurons in the intermediate layer, is the weight function between the input and intermediate layers, and is the displacement function of the intermediate layer.
Step 3. Calculate the output vector Y in the output layer.
(4)
where denotes the weighting function between the intermediate and output layers and denotes the offset of the output layer.
Step 4: calculate the magnitude of the variation steps .
The variation on the output layer is calculated using the following formula:
(5)
The variation on the output layer is calculated using the following formula:
(6)
Step 5: Calculate the weighting function correction and offset correction.
The weighting function correction and the offset value of the output layer are shown as follows:
(7)
The weighting function correction and the offset value of the intermediate layer are shown as follows:
(8)
where denotes the leaning rate, and stands for the momentum factor.
Step 6: Get the new values of the weight function and bias.
The weighting and offset values in the output layer are updated and can be represented as follows:
(9)
The weighting and bias values in the intermediate layer are updated and can be represented as follows:
(10)
Step 7: Repeat steps from 1 to 6 until the error function converges.
To check the training results, you need to load the sets of values for testing into the neural network, thereby completing the training. The purpose of testing is to check if the convergence error is within the acceptable range. The root mean square error (RMSE), taken as a control for this study, can be calculated using the formula:
(11)
where M is the total number of testing sets, N is the number of neurons in the output layer, represents the value of the given output value of the j-th neuron in the p-th set and represents the predicted output value of the j-th neuron in the p-th set.
Findings
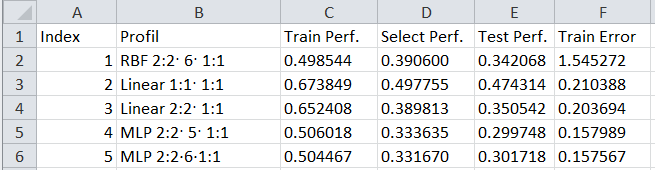
After training the network in the example of the model for forecasting the estimated prices for material resources of the «Metal goods and structures» group, taking into account the period, inflation, we received an ensemble of models with different learning errors. The best turned out to be a network with the "multiperceptron MLP" type with an error of 0.15 in the test case, which is an acceptable error in modeling (Figure 2).
The type of neural network model for predicting the estimated price for building materials of this group is shown in Figure 3.
According to this model, setting the inflation value = 0.83 and the period = September, we obtained the scaled value of the forecast of the estimated price = 0.68 or in terms of the estimated price in September for glass raw materials 172.90 rubles, which corresponds to the statistical price for the specified period.
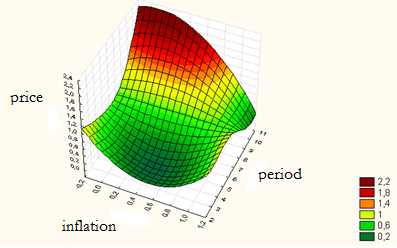
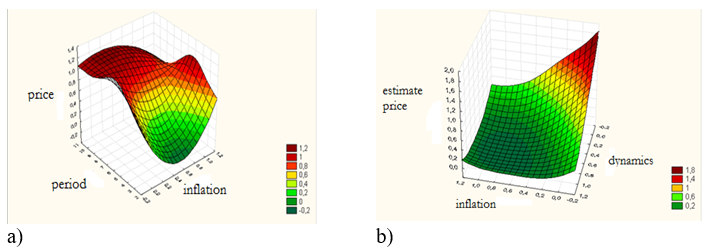
When building a neural network for all selected social and economic factors affecting pricing in the building materials market, it was possible to build a model that takes into account the influence of inflation, the dynamics of the estimated price and the period for the group «Metal goods and structures» (Figure 4).
When forecasting the estimated price in the coordinates “inflation - dynamics - estimated price”, we received a forecast that significantly differs from the real one. Thus, the scaled value should be 0.68 versus 0.22 obtained from the forecast model.
As a result, we conclude that it is better to use the network in the coordinates “estimated price - period – inflation”.
Then the developed method of neural network modeling was tested by the authors for forecasting prices in the groups «Materials and structures for load-bearing elements of buildings and structures» and «Paints and varnishes».
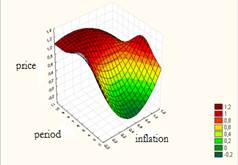
The view of the neural network forecasting model in the coordinates “inflation - period - estimated price” is shown in Figure 5.
The forecast for September in this group coincides with the real data of the estimated price in September. The view of the neural network forecasting model in the group “Paints and varnishes” in the coordinates “inflation - period - estimated price” is shown in Figure 6.
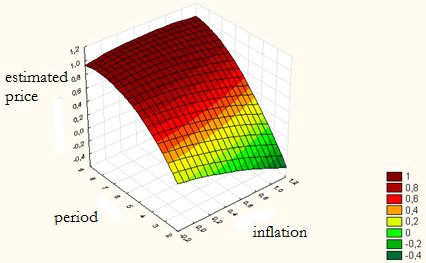
The forecast for September in this group coincides with the real data of the estimated price for September. The difference between the forecast and statistical prices is 5%.
Conclusion
Conclusions and recommendations on the use of neural network models for predicting the cost of material resources in the system of cost engineering in construction:
- the construction pricing market in the Samara region is significantly influenced by such social and economic parameters as “dynamics of the volume of work by type of “construction”, “inflation”, “industrial production index”. The dynamics of the commissioning of residential buildings does not have a significant impact on the building materials market and can be excluded from neural network modeling;
- the developed methodology allows planning prices for building materials, taking into account changes in social and economic factors in the regional building materials market;
- the use of neural network predictive models of the cost of building materials is effective at various stages of the investment and construction process - when planning capital investments, when forming the estimated cost, when determining the price of contracts.
Neural network modeling has the potential to be used in forecasting the development of not only individual segments of the construction market (in particular, building materials), but also in managing the cost of construction in general.
References
Agapovichev, A. V., Sotov, A. V., Kokareva, V. V., Smelov, V. G., & Kyarimov, R. R. (2017). Study of the structure and mechanical characteristics of samples obtained by selective laser melting technology from VT6 alloy metal powder. International Journal of Nanomechanics Science and Technology, 8(4), 323-330.
Bogdanov, A., Degtyarev, A., Korkhov, V., Lwin, T. K., & Shchegoleva, N. (2018). Big Data as the future of information technology. CEUR Workshop Proceedings, 2267, 26-31. http://ceur-ws.org/Vol-2267/26-31-paper-4.pdf
Borovikov, V. (2001). Statistica. The Art of Computer Data Analysis: for professionals. Publishing House: Piter.
Demyanenko, E. G., & Popov, I. P. (2012). Limits of flanging process feasibility to create thin-wall conical shells. Russian Aeronautics, 55(4), 408-412.
Geras'kin, M. I., & Chkhartishvili, A. G. (2017). Analysis of Game-Theoretic Models of an Oligopoly Market under Constrains on the Capacity and Competitiveness of Agents. Automation and Remote Control, 78(11), 2025-2038.
Geraskin, M., & Kuznetsova, O. (2020). Analysis of monopolistic competition in consumer goods markets with credit sales. CEUR Workshop Proceedings, 2667, 80-84. http://ceur-ws.org/Vol-2667/paper19.pdf
Geraskin, M., & Rostova, E. (2020). Model and algorithm of industrial risk control at regional level. CEUR Workshop Proceedings, 2667, 5-10. http://ceur-ws.org/Vol-2667/paper2.pdf
Grechnikov, F. V., & Khaimovich, A. I. (2015). Development of the requirements template for the information support system in the context of developing new materials involving Big Data. CEUR Workshop Proceedings, 1490, 364-375.
Grechnikov, F. V., Erisov, Y. A., & Alexandrov, S. E. (2016). Effect of anisotropic yield criterion on the springback in plane strain pure bending. CEUR Workshop Proceedings, 1638, 569-577.
Grechnikov, F. V., Erisov, Y. A., Surudin, S. V., & Tereshchenko, V. V. (2018). Theoretical and experimental study of plastic anisotropy of Al-1Mn alloy taking into account the crystallographic orientation of the structure. Materials Physics and Mechanics, 40(2), 274-284. https://www.ipme.ru/e-journals/MPM/no_24018/MPM240_16_grechnikov.pdf
Komarevtseva, O. O. (2017). Simulation of data for determining the readiness of municipalities to implement smart city technologies. In Proceedings of the DAMDID/RCDL, 167-177. http://ceur-ws.org/Vol-2022/paper22.pdf
Ramzaev, V. M, Khaimovich, I. N., & Chumak, P. V. (2020). Data modeling for analysis of readness of municipal education in industry 5.0. CEUR Workshop Proceedings, 2667, 1-4. https://elibrary.ru/item.asp?id=45271428
Ramzaev, V. M, Khaimovich, I. N., & Chumak, P.V. (2017). Big data analysis for demand segmentation of small business services by activity in region. CEUR Workshop Proceedings, 1903, 48-53.
Ramzaev, V. M. Khaimovich, I. N., & Chumak P. V. (2016). Use of big data technology in public and municipal management. CEUR Workshop Proceedings, 1638, 864-872.
Samara Center for Pricing in Construction. (2020). The official website of the regional body for pricing: http://ccs.samara.ru/
Smelov, V. G., Sotov, A. V., & Agapovichev, A. V. (2016). Issledovanie struktury i mekhanicheskih svojstv izdelij, poluchennyh metodom selektivnogo lazernogo splavleniya iz poroshka stali 316 l [Investigation of the structure and mechanical properties of products obtained by selective laser fusion from 316 l steel powder]. Ferrous metals, 9, 61-65. https://elibrary.ru/item.asp?id=27340522
Vlasova, M. A., Kononova, E. E., Terekhova, L. A., & Alekhin, E. I. (2020). Innovations and Environmental Engineering In The Energy Sector: Modern Management Experience. In I. V. Kovalev, A. A. Voroshilova, G. Herwig, U. Umbetov, A. S. Budagov, & Y. Y. Bocharova (Eds.), Economic and Social Trends for Sustainability of Modern Society, 90. European Proceedings of Social and Behavioural Sciences, 74-82. European Publisher.
Copyright information

This work is licensed under a Creative Commons Attribution-NonCommercial-NoDerivatives 4.0 International License.
About this article
Publication Date
29 August 2022
Article Doi
eBook ISBN
978-1-80296-126-3
Publisher
European Publisher
Volume
127
Print ISBN (optional)
-
Edition Number
1st Edition
Pages
1-496
Subjects
Economics, social trends, sustainability, modern society, behavioural sciences, education
Cite this article as:
Khaimovich, I. N., & Didkovskaya, O. V. (2022). Forecasting Of The Cost Of Building Materials In A Volatile Market. In I. Kovalev, & A. Voroshilova (Eds.), Economic and Social Trends for Sustainability of Modern Society (ICEST-III 2022), vol 127. European Proceedings of Social and Behavioural Sciences (pp. 258-268). European Publisher. https://doi.org/10.15405/epsbs.2022.08.29