
Building And Analysing A Skills Graph Using Data From Job Portals


Abstract
In this paper, the authors consider the process of building and analyzing a skills graph based on vacancies data from the job search portal. The connection between vacancies and skills is identified and formalized as labor market and employers' requirements to employee's qualification in the intellectual educational ecosystem model. The authors describe the collector program which can fetch vacancies data from job search sites with an example of site HeadHunter. Jupyter Notebook interactive notebooks and different Python-based libraries, such as Pandas and Numpy, are used for data processing. As a result, a skills graph is built and stored in the neo4j graph database platform. With the help of the Gephi application, the next properties of this graph are determined: degree distribution, the eigenvector centrality, closeness centrality, betweenness centrality, PageRank coefficient, and modularity. The graph is drawn using the ForceAtlas2 layout algorithm. The modularity coefficient for the vertices is used to find the main clusters of skills. The number of such skills clusters is almost the same as the count of specialties on the example job search portal. It results in the ability to determine specialty skillsets and interspecialty skills using vacancies data from job search sites.
Keywords: Job sites, machine learning, skills graph, skills, vacancies
Introduction
Every year, universities produce a large number of trained personnel for various professions (Abramov et al., 2021). After graduation, many people have a question about finding a suitable job for their level of skills. There is a difficulty in obtaining knowledge about the current requirements and essentials of the labor market.
A mandatory requirement for high-level educational programs is to orient students to obtain professional functions from the professional standards. Such standards usually refer to the education standard in this domain. Employment centers and online services specializing in job search can also become sources of information about professional skills, requirements, and working functions (Glebova et al., 2021).
Today many information resources can help find a suitable vacancy for any person following his professional skills. Among such information resources available on the Internet, online services are the most popular way to find a job (Glebova et al., 2021). In Russian Federation, the most popular job search sites are "Superjob.ru" ( 2021), "HeadHunter.ru (hh.ru)" ( 2021) and the state portal "TrudVsem" ( 2021), which also aggregates information from employment centers (Glebova et al., 2021).
Problem Statement
Analyzing the vacancies presented on these information portals, we can conclude that vacancies may have the following properties that are relevant to the applicant, in particular:
Skills requirements
Vacancy region
Minimum salary
Maximum salary
Publication date
Employer’s rating etс
The applicants' CVs also contain a description of professional skills, as well as, if specified, the desired salary, word region, and other parameters, according to data from job portal TrudVsem ( 2021).
A skill-based approach is one of the key research area in modern days. Intellectual educational ecosystem uses this approach to build vacancies recommendations for user based on user skills.
Skills are usually logically connected to each other and can be clustered based on their logical connections. Those clusters can be used to find related skills and new skills to learn. Those clusters may have intersections, since many skills are part of many specialities.
While it is possible to define skills and connections between skills in some speciality, in modern world, new skills are inventioned every day. And first place where new skills are becoming required are vacancies. Employers and companies wants to use the latest technologies to increase their revenue, so employee’s with new skills in their skillset are very relevant for them. Building and analysing skills clusters and graph in automated way can help employers and employees to find each other.
Research Questions
This article raises up next research questions:
- Is it possible to automate gathering information about vacancies from job portals?
- How can be this information used to build a skills graph?
- Can we analyze a skills graph to find out clusters of connected skills using graph analysis methods? Are those clusters related to specializations?
Purpose of the Study
This study had four purposes:
- to examine the possible gathering vacancies data from the job search portals,
- to explore ways to build a skills graph using gathered data,
- to analyse a skills graph and its main properties and metrics
- to analyse clusters of connected skills on the graph and examine their relationship with specialities.
Research Methods
The minimum unit for describing the requirements of the labor market, according to Obolenskii and Shevchenko (2020) is a vacancy. Let's specify the set of vacancies as .
Each specialty can have a set of vacancies related to it. Let’s mark this binary relation as a function (1):
(1)
where – specialties set, – vacancies set.
Each vacancy can be assigned to some set of skills. Let’s define this binary relation using multivalue function (2):
(2)
where – skills set, – vacancies set.
It can be noticed that the set of skills for some vacancy may include a variety of skills, including those that do not relate to the chosen specialty .
We can assume that skills in are logically connected. Then it is possible to form a fully connected graph of vacancy skills , where vertices will represent competencies in a given vacancy, and the edges will represent logical connections between those skills.
Then, for a given set of vacancies , it is possible to form a set of skills graphs (3):
(3)
where – vacancies set.
The set of skills graphs can be combined into a single competence graph . This graph can be built based on job vacancy data from job search portals. Let's use the social network model (Kolomeichenko et al., 2019) to analyze such a graph.
The social network model (Kolomeichenko at el., 2019) is a structure with a set of agents and a set of relationships defined on it (a set of connections between agents, for example, dating, friendship, cooperation, communication). Various methods can be used to analyze social network graphs (Aggarwal, 2011; Batura, 2012; Borgatti et al., 2013; Clauset et al., 2004; Palla et al., 2005), which make it possible to identify the structures of the graph of the interaction of subjects, for example, algorithms for identifying communities and clusters. To build such model and skills graph we need to be able to fetch vacancy data from job search portals.
Fetching Vacancy Data from Job Search Sites
To fetch job data from the job search portal, using HeadHunter as an example, we will use the API provided by this site. Figure 1 shows the main page of this job portal.
One can use HeadHunter’s ( 2021) API to get information about job seekers and vacancies. It's also possible to leverage HeadHunter functionality to create applications.
The HeadHunter ( 2021) API has the following features:
All API works via HTTPS protocol
Authorization is performed via OAuth 2 protocol
All data is available only in JSON format
Base URL — https://api.hh.ru /
API supports paginated output
The maximum number of objects per page is 100.
The maximum number of returned objects from all the pages is 2000. To get more information from this resource, one should refine the query, for example, by specifying the region or other search parameters.
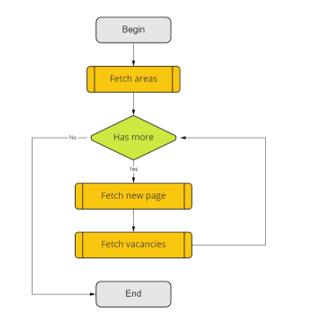
As a mechanism for collecting data, a C# collector program was implemented, which automatically receives information from this Internet resource, processes it, and saves it as a CSV file. The flowchart of the assembler program is shown in Figure 2, 3. The list of APIs used is shown in Table 1.
After the program's execution, it generates a file in a CSV format. This format is suitable for importing into other systems and is often used in data science. An example of the result of the work is shown in Figure 3. The structure of the CSV file is shown in Table 2.


Using a separate CSV file with the structure above allows us to add support for new job search portals in the future without changing other intelligent educational ecosystem software modules.
As a result of the collector program's execution, it created a CSV file containing data on 130964 vacancies. Let's consider how to process these vacancies.
Data Processing
To build a skills graph based on vacancies data, the following steps should be performed:
- Process input data and convert a row with a list of requirements into a set of skills
- Define a list of skills and remove duplicates. Those skills will become vertices of the skills graph K'
- Define connections between skills, create edges for graph K' and remove duplicates
- Persist graph data in a graph database platform
- Export graph into the file in a format suitable for further analysis, for example, GraphML
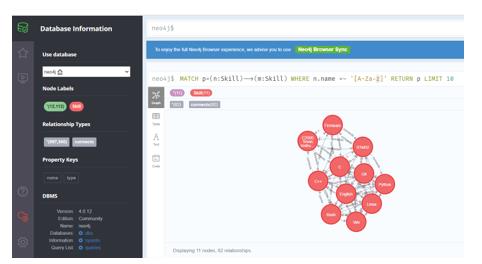
As graph storage, the graph database (Neo4J, 2021) can be used. It is an open-source graph database management system implemented in Java. As of 2021, it is considered the most common graph DBMS (Neo4J, 2021). An example of the interface of this DBMS is shown in Figure 4.
was used to process vacancies data. A lot of popular data science tools and libraries, such as interactive notebooks,,, and, were also used.
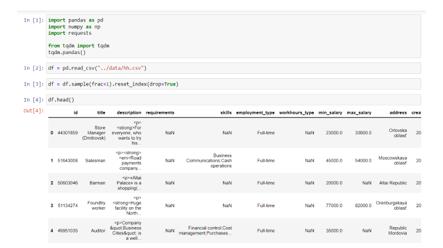
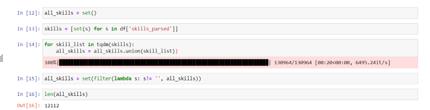
Loading data into an interactive notebook using Pandas dataframes is shown in Figure 5.
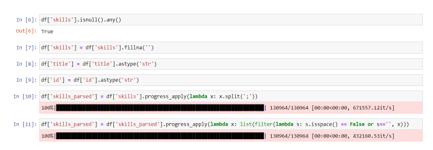
In Figure 6, one can see how string data transforms into a list of skills.
To determine a list of unique skills that will act as the vertices of the graph, for each vacancy, we transform a list of vacancy skills into a set, and then combine the resulting sets (Figure 7):
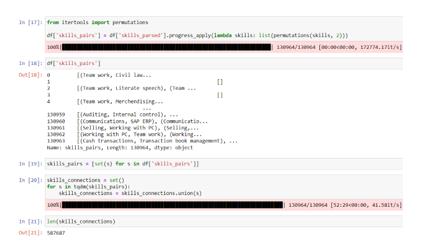
After that, the result set contains 12112 unique skills. Let's get the set of edges of the desired graph K’. For each set of vacancy skills, we can get all permutations by 2, and then combine them into a single set of edges (Figure 8):
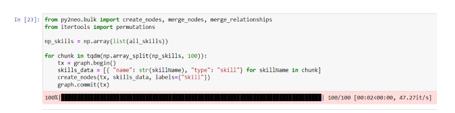
The use Python data structure guarantees that there are no duplicates in the resulting sets. With both sets defined it is possible to persist them as a graph in the neo4j graph DBMS. Let's use the Py2Neo library to interact with the neo4j DBMS, as well as the Numpy library to speed up the saving process. An example of saving vertex data is shown in Figure 9, and an example of saving edge data is shown in Figure 10.

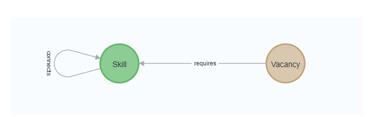
Vacancies vertices and their connections can be persisted in the same way. A graph will be built automatically in neo4j as long as vertices and edges are given. An example of the structure of the resulting graph is shown in Figure 11.
The neo4j DBMS also can export data to various formats, such as CSV, JSON, GraphML. Figure 12 shows an example of a query to the neo4j DBMS in the Cypher language (Neo4J, 2021) which exports the entire graph to the specified file.

GraphML format helps with the subsequent visualization and analysis of the graph in specialized software, for example, Gephi.
Building and Analysis of the Skills Graph
Let's use the Gephi ( 2021) application to visualize the created graph. Visualization of the graph is shown in Figure 13. The main properties of the graph are presented in Table 3.

Findings
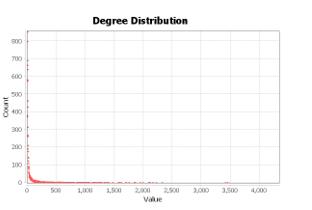
Vertices degree distribution, a metric described by Kleinberg (1999) is shown on Figure 14.
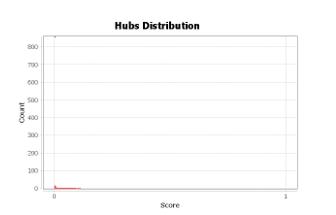
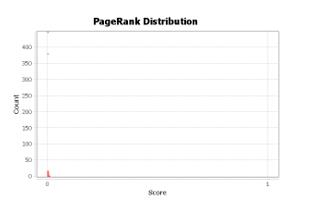
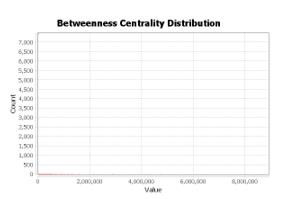
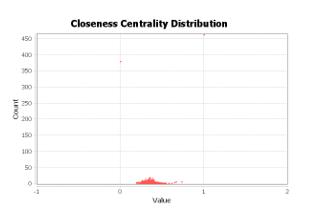
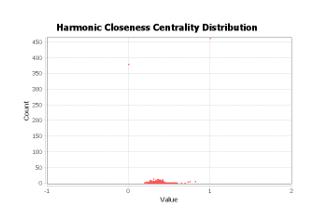
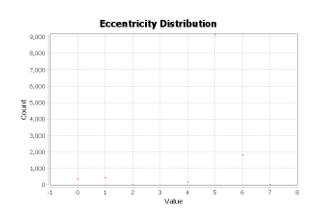
Hubs distribution, another wideused graph metric according to Kleinberg (1999) and Tarjan (1972) is shown in Figure 15. Figure 16 shows PageRank coefficient distribution. PageRank metric was first described by Brin and Page (1998). Figures 17-20 show distributions for Betwennes Centrality, Closeness Centrality, Harmonic Closeness centrality and Eccentricity (Brandes, 2001).
Modularity class distribution is show in Figure 21. Modularity class can be helpful to determine clusters in the graph.
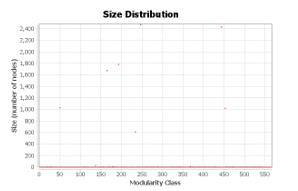
With modularity classes available, it's possible to determine clusters (Abramov et al., 2021; Blondel et el., 2008; Lambiotte et al., 2009) in the skills graph using modularity value. Each cluster combines skills that are often used together. The number of clusters (566) almost coincides with the number of specialties on the HeadHunter job search portal (570 excluding the group of specialties "Career Start, students").
Each cluster was assigned a specific color. Each vertex was assigned a size depending on its PageRank value. The higher the PageRank of the vertex is, the larger size the vertex will have in the visualization. Visualization of the skills graph using layout is shown in Figure 22.

Conclusion
As a result, the connection between vacancies, skills, and specialities was established and formalized using a skill-based approach. Job sites APIs can be used to fetch data about vacancies, skills in automated way. This data can be later processed to build a skills graph.
The application of graph theory has made it possible to combine all the skills required in vacancies into a single graph. The analysis of this graph showed that the number of clusters obtained as a result of the calculation of the modularity class almost coincides with the number of specialties on the job search portal, which makes it possible in the future to determine skills for new specialties, as well as interdisciplinary skills, by analyzing the skills graph for given vacancies.
However, after analysis of graph main metrics, such as degree distribution, centrality and modularity we found, that many skills have semantical duplicates, for example, “Teamwork ability” and “Working in the team” are semantical duplicates for “Teamwork”. While it will go to the same cluster, those aliases, synonyms and semantical duplicates should be revisited in removed in the pre-processing phase.
Further work will continue research in this area. First, we need to analyse skills, find out how to treat aliases in automated way to improve resulting skills graph. Secondly, we will determine the similarity measures between vacancies based on the skill-based approach, which will formalize the principles of work of the recommendation system as the core of the intellectual educational ecosystem.
Also, important tasks that will be solved in the future are finding a way to perform dimensionality reduction of the graph using a minimal spanning tree, as well as the building an acyclic directed skills graph .
References
Abramov, A., Filatov, K., Peregrimov, A., & Boganyuk, Y. (2021). Razrabotka servisa dlya opredeleniya aktual'nyh grupp navykov specialista na osnove tekstov vakansii [Development of a service for determining the actual skill groups of a specialist based on vacancy texts]. Mathematical and information modeling Materials of the All-Russian Conference of Young Scientists. Tyumen, Tyumen: Tyumen State University, 54-64. https://www.elibrary.ru/item.asp?id=47170628
Aggarwal, C. (2011). An Introduction to Social Network Data Analytics. Social Network Data Analytics. Springer. DOI:
Batura, T. V. (2012). Metody analiza komp'yuternyh social'nyh setej [The method of analysis of computer social networks.]. Vestn. NGU, Ser. Informatsionnye tekhnologii, 10(4), 13-28. https://lib.nsu.ru/xmlui/handle/nsu/250
Blondel, V., Guillaume, J., Lambiotte, R., & Lefebvre, E. (2008). Fast unfolding of communities in large networks. Journal of Statistical Mechanics: Theory and Experiment, 2008, 1008. DOI:
Borgatti, P., Everett, G., & Johnson, C. (2013). Analyzing Social Networks. Los Angeles: SAGE Publications Ltd, 384. https://www.researchgate.net/publication/281294181_Analyzing_Social_Networks
Brandes, U. (2001). A Faster Algorithm for Betweenness Centrality. Journal of Mathematical Sociology, 25(2), 163-177. DOI:
Brin, S, & Page, L. (1998). The Anatomy of a Large-Scale Hypertextual Web Search Engine. Computer Networks and ISDN Systems, 30, 107-117. DOI:
Clauset, A., Newman, M. E., & Moore, C. (2004). Finding community structure in very large networks. PHYSICAL REVIEW E, 70(6), 066111. DOI:
Gephi. (2021). The Open Graph Viz Platform. https://gephi.org/
Glebova, E. V., Ivanchenko, P. P., & Anokhin, A. S. (2021). Identifikatsiya trebovanii k professional'nym navykam vypusknikov napravleniya 27.03.01. «Standartizatsiya i metrologiya» na osnove analiza on-lain servisov, spetsializiruyushchikhsya na poiske vakansii. [Identification trebovaniy k professionalnym navykam vypusknikov napravleniya 27.03.01 "standartizatsiya i metrology" na osnove analyza on-line servisov, spetsializiruyushchixsya na poiske vakansiy]. Innovative development of the fishing industry in the context of ensuring food security of the russian federationmaterials of the iv national scientific and technical conference. vladivostok: far eastern state technical fisheries university, 184-188. https://www.elibrary.ru/item.asp?id=44749839
HeadHunter. (2021). Rabota v Moskve, poisk personala i publikatsiya vakansii [Work in Moscow, search for personnel and publication of vacancies]. https://hh.ru/
Kleinberg, J. (1999). Authoritative Sources in a Hyperlinked Environment. Journal of the ACM, 46(5), 604-632. DOI:
Kolomeichenko, M., Polyakov, I., Chepovskii, A. A., & Chepovskii, A. M. (2019). Detection of Communities in a Graph of Interactive Objects. Journal of Mathematical Sciences, 237(3), 426-431. DOI:
Lambiotte, R., Delvenne, J., & Barahona, M. (2009). Laplacian Dynamics and Multiscale Modular Structure in Networks. IEEE Transactions on Network Science and Engineering, 1(2), 76-90. DOI:
Neo4j. (2021). Graph Data Platform. Graph Database Management System. https://neo4j.com/
Obolenskii, D. M., & Shevchenko, V. I. (2020). Kontseptual'naya model' intellektual'noi obrazovatel'noi ekosistemy [Conceptual model intellectual imaging ecosystem] Ekonomika. Informatika, Technologies, 47(2), 390-401. DOI:
Palla, G., Derenyi, I., Farkas, I., & Vicsek, T. (2005). Uncovering the overlapping community structure of complex networks in nature and society. Nature, 435, 814-818. DOI:
SuperJob. (2021). Rabota v Moskve, svezhie vakansii v Moskve, poisk raboty i rezyume na SuperJob [Work in Moscow, fresh vacancies in Moscow, job search and resume on SuperEb]. https://superjob.ru/
Tarjan, R. (1972). Depth-First Search and Linear Graph Algorithms. SIAM Journal on Computing, 1(2), 146-160. DOI:
TrudVsem. (2021). Rabota Rossii Obshcherossiiskaya baza vakansii i rezyume [Jobs of Russia All-Russian database of vacancies and resumes]. https://trudvsem.ru/
Copyright information

This work is licensed under a Creative Commons Attribution-NonCommercial-NoDerivatives 4.0 International License.
About this article
Publication Date
29 August 2022
Article Doi
eBook ISBN
978-1-80296-126-3
Publisher
European Publisher
Volume
127
Print ISBN (optional)
-
Edition Number
1st Edition
Pages
1-496
Subjects
Economics, social trends, sustainability, modern society, behavioural sciences, education
Cite this article as:
Skobtsov, Y. A., Obolensky, D. M., Shevchenko, V. I., & Chengar, O. V. (2022). Building And Analysing A Skills Graph Using Data From Job Portals. In I. Kovalev, & A. Voroshilova (Eds.), Economic and Social Trends for Sustainability of Modern Society (ICEST-III 2022), vol 127. European Proceedings of Social and Behavioural Sciences (pp. 147-162). European Publisher. https://doi.org/10.15405/epsbs.2022.08.17