Comparative Method In Studying Development Trends In The Far-Eastern Cities
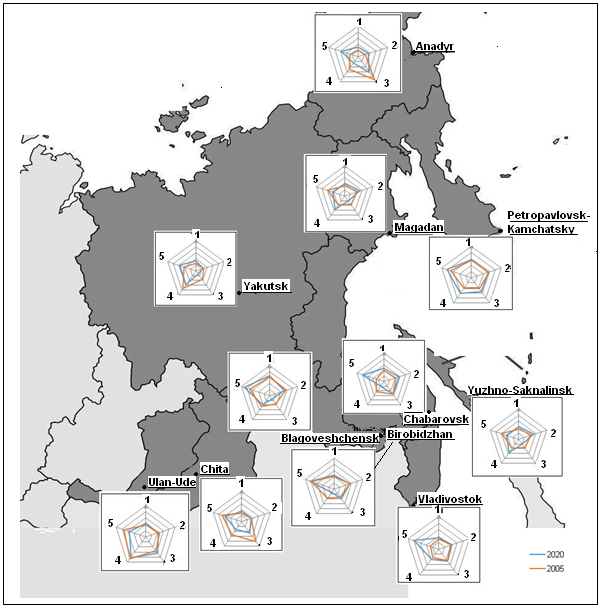
Figure 1: Change in the share of administrative centres of constituent entities of the Russian Federation within the FEFD in the main socio-economic features in 2005-2020, % of the aggregate index for the respective constituent entity (the scale division value is 20%): Figures indicate data on the following indices: 1 - population, 2 - number of people employed in the economy, 3 - capital investment, 4 – the amount of industrial production (manufacturing industry), 5 - retail trade turnover
< Back to article