
Indicators Of The Quality Block Of Innovation-Based Economy


Abstract
The given paper considers the quality block with its interrelations as a consequence of the quantity block which determines the financial component for all types of education, beginning from the secondary-level education to higher and vocational secondary education. On the one hand, there has been the share of the employed population with a particular set of education quality in total employment of the population. On the other hand, there has been the proportion of individuals with this quality of the total population in %. There are the polygons of indicators distribution. Using correlation and regression analysis and statistical data processing, we identified the number of consistent patterns that allowed a deeper analysis of the selected indicators. Based on the found dependences of education expenditures and employment in accordance with the specialty in the proportion of individuals with higher and vocational education, an interesting conclusion has been made. In our opinion, in due course, no one will work in his/her degree field. In the modern innovation-based economy, the explanation for this is that professionals in these specialties will not be in demand in seven years, due to the fact that the specialty field is becoming obsolete because of the production modernization, and therefore the state does not allocate funds for training specialists in this field.
Keywords: Correlation, graduates, information, quality block, regression line, scientific employment of population
Introduction
To achieve the set goal, namely, in order to identify the patterns of interaction between the two blocks, the quantity one, being determined by five indicators (L1 – L5) and the quality one, also being determined by five indicators (L6 – L10), we had to choose out these indicators from the existing statistical ones. For their dimensionlessness, we take their relations rather than the indicators themselves (Camboni & Valbonesi 2020). The employment of the population in the labor force depending on the education received was taken as the basis. All that was done to consider in more detail how the transition of quantity to quality occurs in the information, scientific, educational and production environment. The experience has shown that the amount of contribution to the development of the system will result in the equivalent giveback.
We have built the relationship of the quality block consisting of these indicators (Fig. 01).
Problem Statement
The problem in the modern world, in the system of personnel education for the agro-industrial complex, arises because of the lost time of timely financing (quantitative block) of new directions related to modernization and new discoveries in the field of digital technologies and artificial intelligence. This replaces a person not only when performing routine work, but also when being a part of managerial functions.
Research Questions
The statistical data for the age groups from 25 to 64 years, which were presented in the form of L6 – L10 ratios, serve as the material for constructing the quality block:
L6= ;
L7= ;
L8 =
L9 = ;
L10 = ;
Purpose of the Study
The purpose of the paper was to choose qualitative indicators in such a way that they could be comparable in the change of dynamic patterns, i.e. dimensionless ones. Therefore, taking the ten indicators’ statistics as a basis, we will study their relations and obtain five indicators in the form of relations.
Research Methods
The study made use of graphical, statistical, and correlation-regression methods of research.
Findings
The quality block indicators with their integrated values of the guaranteed minimum and possible maximum are given in Table 1 and are represented by distribution polygons in the graphs (Figure 02- Figure 07).
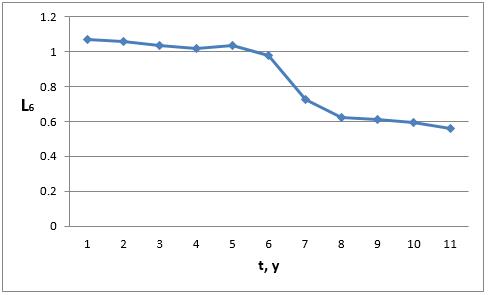
The graph in Fig. 02 shows that from 2013 to 2015, there was a visible decline in employment of the population with higher education (Chelley-Steeley et al., 2019).
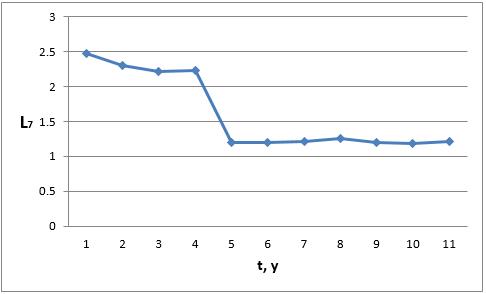
In Figure 03, we can see that from 2011 to 2012, there was a sharp decrease in employment of the population with higher and secondary vocational education.
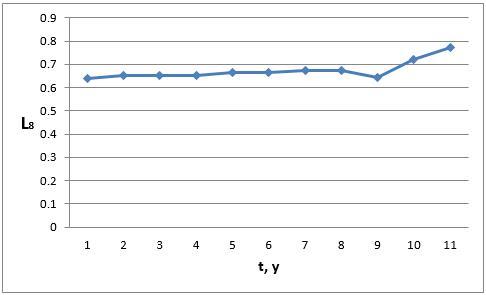
In Figure 04, the graph shows an increase in the employment of graduates with higher and secondary vocational education working in the specialty since 2016 (Drenovak et al., 2014).
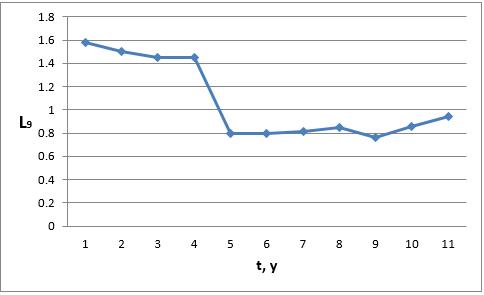
Figure 5 presents a similar dynamics of L9 and L7 indicators, namely, a decrease in the indicators values from 2011 to 2012 with their further stabilization.
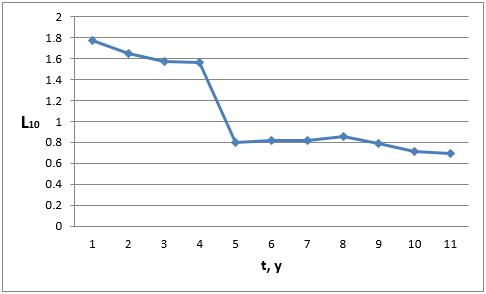
Figure 06 demonstrates a similar situation as shown in Figures 3 and 5, namely, a decrease in the proportion of staff engaged in research from 2011 to 2012, and with a decreasing trend since 2016. In contrast, Figure 3 demonstrates a stabilizing trend for the indicator, and Figure 5 shows a positive trend since 2016.
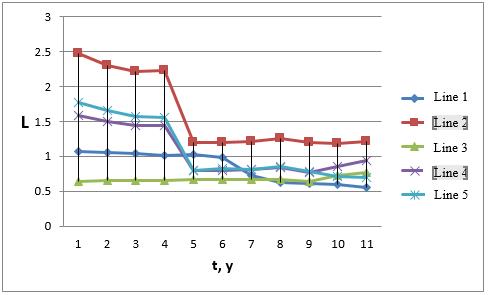
Using the indicators distribution polygons (Fig.07), we examine L7, L9, and L10 for the correlability with each other. The results are presented in Table 02 (Dvouletý et al., 2019; Fan et al., 2020).
The relationship between the considered indicators happened to be very close and functional, which makes it possible to take one of the three indicators as the most interesting one for the research purpose to characterize the process under study (Jandik & Rennie, 2008; Kim, 2020; Miao, 2020).
Let us now return to indicator L6 and construct its regression line arranged by the years. The data in Table 01 and in Figure 02 indicate a decrease in the employed population with higher education per the proportion of individuals having the corresponding type of education (Table 03), assuming that 2008 – 1, 2009 – 2, 2010 -3,...2018 – 11 a value for indicator L6 in Table 01.
rгL6= =
bL6/г=
L6 – 0.845 = - 0.0603 · (Y – 6)
L6 = - 0. 0603 · Y + 1. 2066
L6 = - 0.06 · Y + 1.21; L6=0;
-0.06Y=-1.21; Y= ≈20
Every year, the employment of individuals with higher education decreases by 0.06 and will reduce to nothing in 20 years, namely by 2038.
Conclusion
1. After analyzing the employment indicators selected for the quality block, we have made the conclusion that they can be narrowed, namely, taking into account the correlation between them (Table 2), we have taken not three ones L7, L9, L10, but only one of them that most accurately characterizes the process under consideration.
2. According to the revealed patterns, a sharp increase of L7, L9, L10 indicators in 2012 is related to the financing of secondary vocational education. The uneven development of the financing process has led to qualitative changes in the indicators connected with the innovative activity of companies in the direction of their reduction (Nikolova & Popova, 2020; Pi et al., 2017).
3. The gradual downward change in higher education funding per one person over the period under review from 2008 to 2018 also has had a negative impact on the three quality indicators.
4. As for the employment of people with higher education, their number will have reduced to nothing by 2038, if the situation does not change (Sivak & Volkova, 2020).
5. For a more detailed discussion of the ongoing processes, one should select the indicators for the process block and then consider them in a single integrated scheme of interaction and interrelationship of processes occurring in the information, scientific, educational and manufacturing environment that greatly change the chosen indicators (Shleenko et al., 2020; Wang et al., 2017). Based on the productivity of the constructed model, it is necessary to choose a scenario with the least negative consequences in the considered environment.
References
Camboni, R., & Valbonesi, P. (2020). Incumbent and entrant bidding in scoring rule auctions: a study on Italian canteen services The B.E. Journal of Economic Analysis & Policy, 21(1), 8817068.
Chelley-Steeley, P., Lambertides, N., & Savva, C. S. (2019).Sentiment, order imbalance, and co-movement: an examination of shocks to retail and institutional trading activity. European Financial Management, 25(1), 116-159.
Drenovak, M., Urošević, B., & Jelic, R. (2014). European bond etfs: tracking errors and the sovereign debt crisis. European Financial Management, 20(5), 958-994.
Dvouletý, O., Čadil, J., & Mirošník, K. (2019). Do firms supported by credit guarantee schemes report better financial results 2 years after the end of intervention? The B.E. Journal of Economic Analysis & Policy, 20180057.
Fan, R., Tran, V., & Talavera, O. (2020). Social media bots and stock markets. European Financial Management, 19(1), 753-777.
Jandik, T., & Rennie, C. G. (2008). The evolution of corporate governance and firm performance in transition economies: the case of seller and ballot in the Czech Republic. European Financial Management, 14(4), 747-791.
Kim, I. K. (2020). Movie variety and the city. The B.E. Journal of Economic Analysis & Policy, 20(3), 20190398.
Miao, C. H. (2020). Search and bidding costs. The B.E. Journal of Economic Analysis & Policy, 20(6,7), 20190143.
Nikolova, M., & Popova, O. (2020). Sometimes your best just ain't good enough: the worldwide evidence on subjective well-being efficiency. The B.E. Journal of Economic Analysis & Policy, 1, 20190396.
Pi, J., Ge, Y., & Yin, J. (2017). The impacts of rural property rights on urban unemployment, wage inequality, and welfare in developing countries. The B.E. Journal of Economic Analysis & Policy, 17(1), 2015-0225.
Shleenko, A. V., Volkova, S. N., & Sivak, E. E. (2020). Formation of comfortable urban environment in Russia based on international experience IOP Conference Series: Materials Science and Engineering, 927, 032088
Sivak, E., & Volkova, S. (2020). Transformation of land resources as a result of anthropogenic impact E3S Web of Conferences, 172, 06002.
Wang, J. -Y., Wu, W. -L., Wu, Y. -C., & Yang, M. J. (2017). How to manage long-term financial self-sufficiency of a national catastrophe insurance fund? The feasibility of three bailout programmes. European Financial Management, 23(5), 951-974.
Copyright information

This work is licensed under a Creative Commons Attribution-NonCommercial-NoDerivatives 4.0 International License.
About this article
Publication Date
01 February 2022
Article Doi
eBook ISBN
978-1-80296-123-2
Publisher
European Publisher
Volume
124
Print ISBN (optional)
-
Edition Number
1st Edition
Pages
1-886
Subjects
Land economy, land planning, rural development, resource management, real estates, agricultural policies
Cite this article as:
Volkova, S. N., Sivak, E., Pankratyeva, O., & Shleenko, A. (2022). Indicators Of The Quality Block Of Innovation-Based Economy. In D. S. Nardin, O. V. Stepanova, & E. V. Demchuk (Eds.), Land Economy and Rural Studies Essentials, vol 124. European Proceedings of Social and Behavioural Sciences (pp. 175-183). European Publisher. https://doi.org/10.15405/epsbs.2022.02.22