
Indicators Of The Process Block Of An Innovative Economy


Abstract
To study the effectiveness of the education system, the following indicators were determined. The first is the level of population participation in lifelong education per student who graduated from secondary school. The second is the share of costs per person for all types of retraining, advanced training, vocational training, the share of wages in GDP per person who graduated from secondary school. The third is the ratio of the average gross wages of workers with higher education to the labor productivity index, the number of studies under the age of 39 per person with higher education. A number of indicators of the process block are weakly correlated with each other and therefore all of them should be left for consideration. Although there is a relation of average density among some of indicators, it is most likely nonlinear, and therefore it can change dramatically over time. For a deeper interaction between blocks, one should consider the correlation between block processes, for example, the impact of funding for higher education and employment of the population who received this education, or job in the degree of graduates received secondary vocational education and higher education. In addition, this is the way the process block, namely its indicators, correlates with the rest of the indicators. In the future, it is necessary to calculate the final indicator of the impact of the current education system on the productivity in order to answer the question: under what indicators the system is productive.
Keywords: Correlation and regression analysis, graphs, information-scientific-educational-production environment, innovative economy, process, wages
Introduction
For comparability of values belonging to one measurement scale, it is convenient to introduce them into a dimensionless format, namely, to take not the values themselves from statistical data, but their ratios. Therefore, the work on the process block bases on ten indicators. On the one hand, these are indicators listed in the object of research. And on the other hand, this is their relation to the proportion of people among the population who graduated from secondary school, as well as those received higher education from the entire population. This made it possible to obtain five dimensionless indicators. Further analysis of these indicators revealed in the period from 2008 - after the financial crisis to 2018, interesting features is associated with the domestic innovation economy. Namely, this is the stability of three indicators, which, in our opinion, are the main regulators in achieving high labor productivity, corresponding wages and the prestige of youth engaged in new developments. Moreover, the remaining two indicators did not change much, grouping together around their average values. Therefore, such a leap to a breakthrough did not take place in the economy, although national projects were clearly formulated and priorities were set. The work shows the development of processes that somehow lead to the question: "Let the population live or will we teach?"
Problem Statement
We have previously considered a quantitative block of financing, consisting of five dimensionless indicators L1 - L5, a qualitative block consisting also of five indicators L6 - L10, and without changing tradition. Now we will consider the process block, choosing a ratio from ten statistical indicators, five dimensionless L11 - L15, which determine the processes of remuneration of labor depending on the productivity and qualifications of the employee. This includes also indicators that determine the costs of retraining associated with lifelong learning throughout the entire labor activity of a person between the ages of 25 and 64.
Research Questions
Five indicators were selected as a basis in the form of the ratio:
L11=
L12= ;
L13= ;
L14= ;
L15= ;
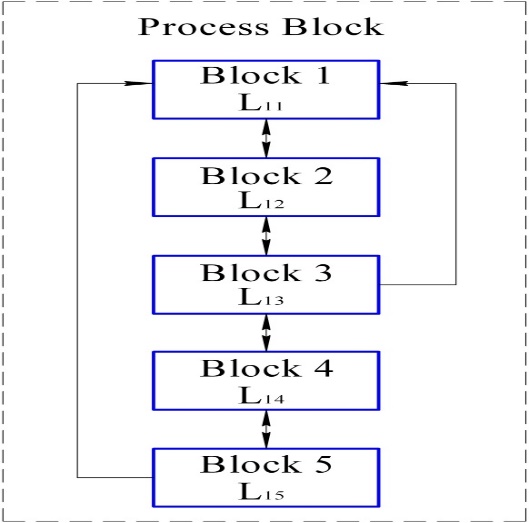
The selected indicators in the form of ratios made up the process block (Fig. 1), and their numerical values with interval estimates are presented in Table 1. In the work, using graphical, statistical and correlation-regression analysis, research results were obtained for their discussion and conclusions.
Purpose of the Study
The object of our research in the process block is projects related to the participation of the population in lifelong learning, and in connection with these processes for various categories of the population, the share of costs for retraining, advanced training, and vocational training for people who have graduated from high school. And as a consequence, and as a reason for this training, there is the share of wages in GDP, as well as the ratio of wages to the labor productivity index. Moreover, in connection with the above, the processes are associated with research activities among young people under 39 years old who received higher education.
Research Methods
The information block for this work was the statistical data of ten indicators, in our opinion, which most fully reflect the regularities of the process block designed to transform quantity into quality and are regulators in achieving the set goals in national projects of the scientific and educational environment.
Findings
For the best understanding of the information represented in the study, we introduced the following concepts. The first is information-scientific-educational-production environment with a further reduction ISEPE. Then there are indicators of the process block (IPB), indicators of the information quantitative block (IIQB) and indicators of the information quality block (IIQuB) (Camboni & Valbonesi, 2020; Chelley-Steeley et al., 2019).
Indicator L11 denotes the level of participation of the population in lifelong learning per student who graduated from secondary school (block 1 in Figure 01, and the graph in Figure 02);
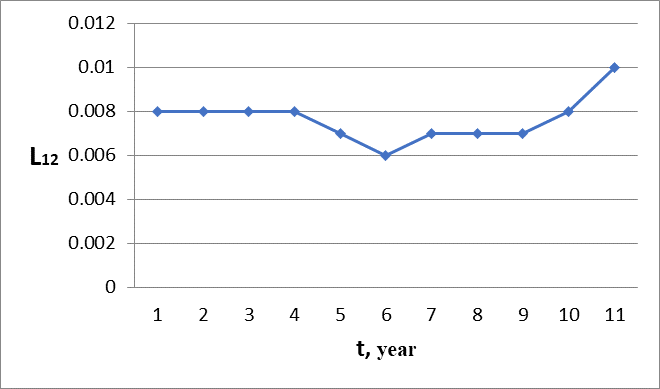
L12 is the share of costs per person for all types of retraining, advanced training, vocational training (block 2 in Figure 01, and the graph in Figure 03);
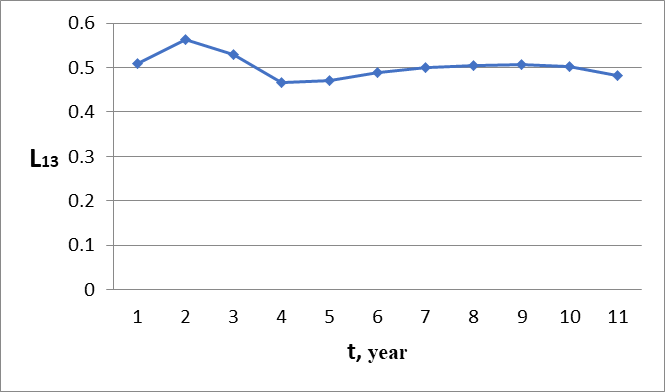
L13 is the share of wages in GDP per person who graduated from secondary school (block 3 in Figure 01, and the graph in Figure 04);
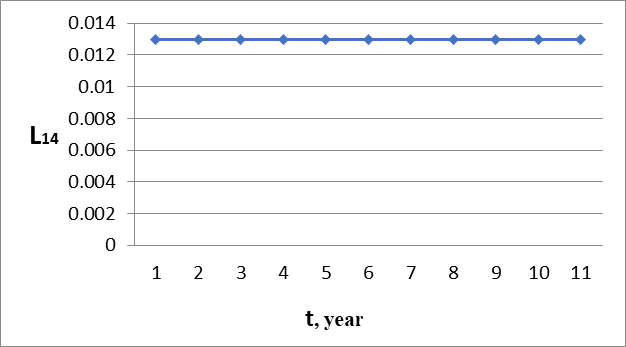
L14 is the ratio of the average accrued wages of workers who received higher education to the labor productivity index (block 4 in Figure 01, and the graph in Figure 05);
L15 is the number of studies under the age of 39 per person who received higher education (block 5 in Figure 01, and the graph in Figure 06).

According to this indicator, a surge was observed in 2013, although the share of expenses per person for retraining decreased in the same year (Figure 03). And after 2015 there was a positive trend in these indicators, and the share of expenses for retraining became larger than that in the post-crisis years.
A completely different dynamics is observed in the share of wages in GDP per person (Figure 04), the surge occurred in 2009, and then, starting from 2011, it gradually decreased in 2013 to a stable level corresponding to the indicator corridor from 0.475 to 0.529 (Table 01).
As for the indicator of wage accrual per unit of the labor productivity index, it is completely constant (Figure 05).
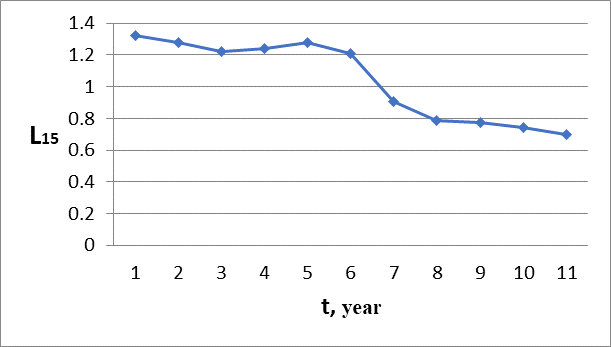
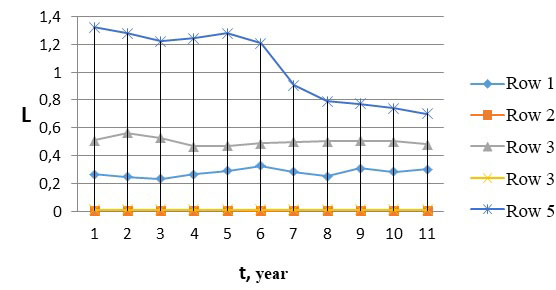
The L15 indicator, which characterizes the number of young researchers per person who received higher education, has a distinctive dynamics from all the considered indicators in Figure 02 - Figure 06 (Figure 06). There was a jump in their decrease by 2014 with a further decrease. There was a jump in their decrease by 2014 with a further wane. And despite the fact that the share of spending on vocational training (Figure 03) is growing, the share of young researchers is decreasing, i.e. L12 and L15 have been forming scissors since 2014. Obviously, the whole point is in the share of wages per person (Figure 04) and its ratio with the labor productivity index (Figure 05), instead of influencing the interest of young people in the research sector (Figure 06). It does not change, i.e. the mechanism of remuneration does not work as a motivational one in the field of research development (Drenovak et al., 2014; Dvouletý et al., 2019). The set of dynamics of the IPB is shown in Figure 07.
Interval estimates are determined by the formulas:
; (1)
– average elective of the indicator is found by the formula:
= ; (2)
corrected standard deviation:
; (3)
tabular value, depends on reliability p=0,99; and sample size n=11, tρ (0.99.11)=3.17;
n – sample size;
– guaranteed minimum (min, Table 1);
– possible maximum (max, Table 1, bottom line).
rL11L15 = ;
bL13/L11 = ;
L13 – 0.502 = -0.509 · (L11 – 0.279);
L13 = -0.509 · L11 + 0.644.
With an increase in the share of participation of the population in lifelong learning per person, the share of wages in GDP decreases by 0.509 units:
rL11L15 = .
The average density ratio between the share of researchers under the age of 39 and the share of participation in lifelong learning is likely to be nonlinear.
Based on the results of the study on the correlation-regression analysis, we see that among the selected coefficients there is a ratio of average or weak density, which characterizes its nonlinear nature. Therefore, it makes sense to leave all five indicators for the description of the process block. Their distribution dynamics without sharp jumps can be explained by the well-established technological development of production, as well as other indicators related to production in such matters as lifelong learning of the population; the cost of retraining, in connection with the modernization of production, the share of wages from GDP per person. And such an indicator as L14 does not change at all, it is equal to a constant value of 0.013. Therefore, the period from 2008 to 2018 in our country in terms of IPB nothing changed, although the process block regulates the transition from quantity to quality and is a litmus test of indicators of the innovative development of the economy in society. For a more thorough analysis, it is required to consider in unity the interaction of information indicators: quantitative IIQB, qualitative IIQuB, which characterize certain processes of financing and employment of labor resources in the country, in a single scheme with the process IPB.
Conclusion
1. The selected indicators of the process block are weakly correlated with each other and therefore all five of them should be left for consideration. Although there is a relationship of the average density among L11 and L12, L11 and L15, it is rather non-linear, and therefore can change greatly over time. For a simplified version, we can leave L11, L12, L14 (Fan et al., 2020; Jandik & Rennie, 2008; Kim, 2020).
2. For a deeper interaction between blocks, it is necessary to consider the correlation between block processes. For example, this is the influence of funding for higher education and employment of the population who received this education, or work in the specialty of graduates having secondary vocational education and higher education (Miao, 2020; Nikolova & Popova, 2020; Pi et al., 2017; Sivak & Volkova, 2020). And it is necessary to know how the process block, namely its indicators, correlates with the rest of the indicators.
3. It is necessary to calculate the final indicator for the productivity of the current ISEPE system in order to answer the question under what indicators the system is productive (Shleenko et al., 2020; Wang et al., 2017). To do this, let us introduce an evaluation block with all interrelations and classify the current situation in the country in terms of progress, stagnation, regression or choice of a development path.
References
Camboni, R., & Valbonesi, P. (2020). Incumbent and entrant bidding in scoring rule auctions: a study on Italian canteen services The B.E. Journal of Economic Analysis & Policy, 21(1), 8817068.
Chelley-Steeley, P., Lambertides, N., & Savva, C. S. (2019). Sentiment, order imbalance, and co-movement: an examination of shocks to retail and institutional trading activity. European Financial Management, 25(1), 116-159.
Drenovak, M., Urošević, B., & Jelic, R. (2014). European bond etfs: tracking errors and the sovereign debt crisis. European Financial Management, 20(5), 958-994.
Dvouletý, O., Čadil, J., & Mirošník, K. (2019). Do firms supported by credit guarantee schemes report better financial results 2 years after the end of intervention? The B.E. Journal of Economic Analysis & Policy, 19(1), 20180057.
Fan, R., Tran, V., & Talavera, O. (2020). Social media bots and stock markets. European Financial Management, 26(2), 753-777.
Jandik, T., & Rennie, C. G. (2008). The evolution of corporate governance and firm performance in transition economies: the case of sellier and bellot in the Czech Republic. European Financial Management, 14(4), 747-791.
Kim, I. K. (2020). Movie variety and the city. The B.E. Journal of Economic Analysis & Policy, 20(3), 20190398.
Miao, C. H. (2020). Search and bidding costs. The B.E. Journal of Economic Analysis & Policy, 20(6,7), 20190143.
Nikolova, M., & Popova, O. (2020). Sometimes your best just ain't good enough: the worldwide evidence on subjective well-being efficiency. The B.E. Journal of Economic Analysis & Policy, 1, 20190396.
Pi J., Ge, Y., & Yin, J. (2017). The impacts of rural property rights on urban unemployment, wage inequality, and welfare in developing countries. The B.E. Journal of Economic Analysis & Policy, 17(1), 2015-0225.
Shleenko, A. V., Volkova, S. N., & Sivak, E. E. (2020). Formation of comfortable urban environment in Russia based on international experience IOP Conference Series: Materials Science and Engineering, 972, 032088.
Sivak, E., & Volkova, S. (2020). Transformation of land resources as a result of anthropogenic impact E3S Web of Conferences, 172, 06002.
Wang, J.-Y., Wu, W.-L., Wu, Y.-C., & Yang, M. J. (2017). How to manage long-term financial self-sufficiency of a national catastrophe insurance fund? The feasibility of three bailout programmes. European Financial Management, 23(5), 951-974.
Copyright information

This work is licensed under a Creative Commons Attribution-NonCommercial-NoDerivatives 4.0 International License.
About this article
Publication Date
01 February 2022
Article Doi
eBook ISBN
978-1-80296-123-2
Publisher
European Publisher
Volume
124
Print ISBN (optional)
-
Edition Number
1st Edition
Pages
1-886
Subjects
Land economy, land planning, rural development, resource management, real estates, agricultural policies
Cite this article as:
Volkova, S. N., Pankratyeva, O., Kobchenko, S., & Shleenko, A. (2022). Indicators Of The Process Block Of An Innovative Economy. In D. S. Nardin, O. V. Stepanova, & E. V. Demchuk (Eds.), Land Economy and Rural Studies Essentials, vol 124. European Proceedings of Social and Behavioural Sciences (pp. 81-89). European Publisher. https://doi.org/10.15405/epsbs.2022.02.11