
Comparing Of Logistic Performance In Turkey And Poland. Explaining Divergence In Development


Abstract
The development of the logistics performance of a country is an essential goal in the process of increasing trade and international cooperation. Although most of the business units allocated in a specific region or a country may benefit from it, it is often a challenge to improve it. Available data shows that Turkey and Poland have improved their performance since 2007. LPI (Logistics Performance Index) is a measurement designed by The World Bank, helping to assess logistic performance since 2007. Previously found similarity was probably caused by the geographical location of both countries. In recent research, the proven similarity ends. That fact implies questions and encourages to look for a cause of divergence in the development. A particular country is often a subject of an international economic climate, and internal and external factors influencing promoted progress. Therefore, for some regions, it is a task where a positive influence and additional time are needed. Turbulent factors force to adjust the local development strategies of a state as well as local supply chain partners reaching global cooperation. The goal of this paper is to present and analyse changes in the LPI index of both countries, happened in the recent research period.
Keywords: International logistics, infrastructure, logistic performance, transport, trade
Introduction
Comparison of Turkey and Poland in logistics terms may serve to examine how external factors influence the development of logistic performance. Both countries as two, quickly developing countries, facing similar challenges but exist in a different environment. The business environment improves in both countries significantly because improved ability to execute logistic operations. The World Bank observes the logistic performance of 160 countries in the world since 2007. Its assessment serves as a benchmark for international logistics operators and businesses aiming to create supply chains with a global reach. Bearing in mind a necessity of excellence in logistic services, delivered on often remote location, global ranking helps to promote foreign direct investment (FDI) in a developing country. Improved logistic performance influences strategic management, which may be critical, especially for multi-national business corporations. Poor logistics performance significantly increase the risk of operation and question investing in a chosen country. In general, it is proven that poor logistics performance increases logistics costs (Blaik, 2016, p. 59). That is why any decline in logistics performance may be a warning sign for supply chain partners.
Checking the global ranking of the LPI index in the year 2016 brings up an interesting observation. Turkey is located in 34th place, and Poland one step higher in 33rd place. When going back and check a previous assessment, usually made in two-year period, starting from the year 2007, it is clear that the two countries improved their location at a very similar pace. However, in the assessment made in the year 2018, the similarity ended. Turkey declines its position from 34th to 47th location, and Poland at the same time improves from 33rd to 28th place (The World Bank, 2018). This paper aims to find an answer to the question: what influences both countries and distract the previous similarity in the development? When one takes a geographic perspective and assess the location of both countries, it is clear that they may serve as international logistics hubs. The location of Turkey provides access to North Africa, the Middle East, Russia, Central Asia, and, foremost, Europe. Comparatively, Poland is an excellent location for a logistics hub for accessing Western European Countries and Eastern European Countries. Both countries are hosts of the OBOR Initiative. In the case of Poland, it is the northern corridor. In the case of Turkey, it is the middle corridor. Participating in developing Euro-Asian trade cooperation may influence further development of logistics infrastructure. The development of marine logistics in Turkey and land transport in Poland are caused by geographical location (Acar et al., 2020).
Literature Review and Theoretical Framework
Logistic Performance Index (LPI) is a measurement describing logistics competencies and infrastructural abilities of a region or a country, compiled every two years by The World Bank. LPI index for a country comes from the weighted average of assessment in the following six areas:
1. Infrastructure
2. Customs operations
3. Logistic competences
4. Tracking & Tracing
5. Timeliness
6. International shipments
The chosen components of the final index allow summarising logistics conditions in a particular country. Such composition emerged thanks not only to recent theoretical and empirical research but also on the practical experience of logistics professionals and scientists involved in international freight forwarding (Arvis et al., 2014).
Customs operations are often critical for international supply chain operations. Adequate merchandise flow across borders ease allocations of manufacturing operations in the best-suited places without the threat of custom delays or administrative hindrances. To assess this criterion, it is advised to consider the speed of customs service, the predictability of formal activities, and the intelligibility of the customs law system. For example, in emerging countries, poorly designed customs operations are not sufficiently developed, causing an increase in trading costs and hindering the efficient movement of goods and cooperation in the supply chain across borders. Often that happens due to complicated customs procedures and unnecessary excessive bureaucracy between government agencies (Martí Selva et al., 2014).
Another part of the LPI index is logistics infrastructure. The World Economic Forum's annual Global Competitiveness Report has studied and benchmarked the many factors underpinning national competitiveness. The Global Competitiveness Report is a comprehensive tool that measures national competitiveness's microeconomic and macroeconomic foundations. They define competitiveness as the set of institutions, policies, and factors that determine the level of productivity of a country. In this concept, infrastructure is mentioned among 12 pillars of competitiveness: institutions, infrastructure, macroeconomic environment, health and primary education, higher education and training, labor market efficiency, goods market efficiency, financial market development, technological readiness, market size and innovation (d'Aleo, 2015).
Consequently, available transport networks, many modes of transportation and facilities like marine ports and airports improve planned transport operations. Additionally, it is worth noting that to improve this category of logistic performance, both time and money are needed. Therefore realisation of investment plans lasts. In an economy where the speed of logistic operations is of value, regions with already developed infrastructure seem better suited for investing.
International shipments are another category influencing the LPI index. The availability of logistics operators creates a competitive environment helping to promote better technological solutions and decreasing the cost of logistics operations in the long term. It is worth mentioning that government policies play an essential role in promoting economic efficiency in the freight transportation sector in terms of jurisdiction and funding mechanisms (Ojala & Celebi, 2015). Delays and disruptions of many kinds in the transportation operations may decrease the availability of the products. That is why help or a professional service partner in this category of logistics services may be essential (Witkowski, 2010).
One criterion, namely logistic competence, consists of the readiness of professionals in logistics to carry on logistics operations of many kinds. Even with significant infrastructural development, it is a challenge to provide a wide variety of skilful professionals to deliver the expected level of services. Wong and Karia (2009) analysed profiles of fifteen businesses working in the supply chain and, through content analysis concluded that it is not the number of employees that make the difference, but it is the competence and knowledge of human assets delivering outstanding logistics service and adequate customer satisfaction.
Another criterion of tracking & tracing serves to deliver greater control over moving inventory. It provides with the help of ITC technology location data for other virtualisation of logistics operations. It is helpful to modelling and assess various operations and provide support in making the right decisions. Therefore, tracking & tracing is one of the enablers to improve logistics performance and help organisations achieve a competitive edge (Jhawar et al., 2014).
The timely delivery of shipments is a factor influencing the performance of logistics. Nowadays, market requirements increase pressure on decreased lead time of the perfect execution of logistics operations. For many businesses, it is a matter of competitiveness, and that is why it is measured. With the current high level of competition, failure to comply with delivery schedules is unacceptable (Martí Selva et al, 2014). The logistics distance may create challenges in this criterion as it is more problematic to keep operations timely as the distance increases.
Research Method
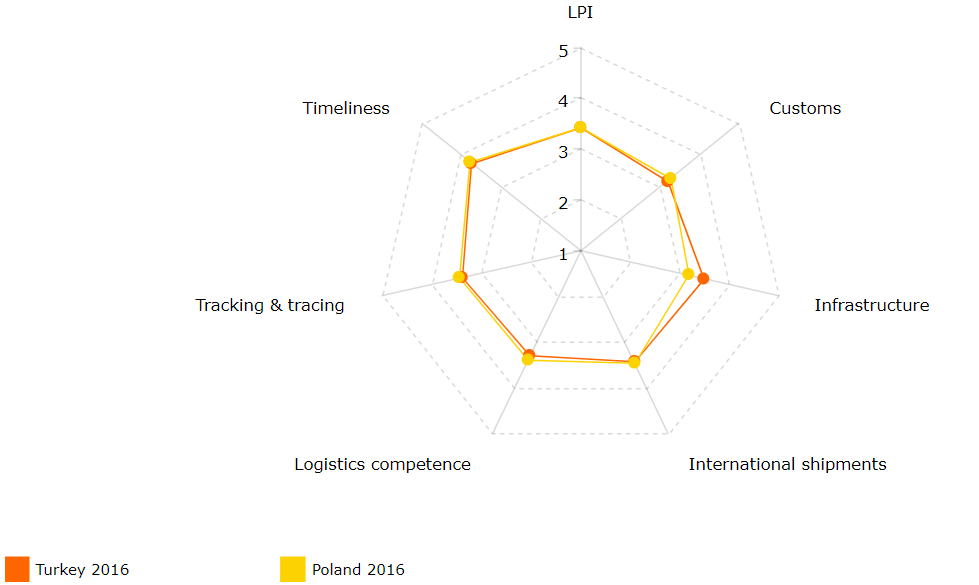
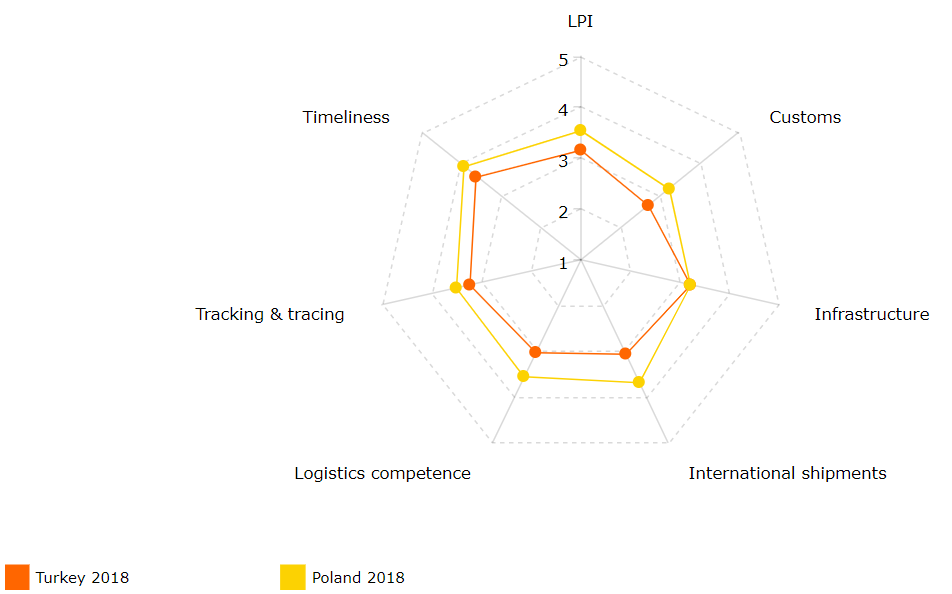
Thanks to the data published by The World Bank, it is possible to examine the development of six particular subfactors hidden behind the overall LPI index. The data will be analysed statistically using the Pearson correlation coefficient in two subsequent periods. All discovered changes will be presented in graphs allowing to provide a qualitative analysis. Table 01 delivers a comparison between two country development of logistic performance in six categories: custom, infrastructure, international shipments, logistic competence, tracking & tracing, timeliness. Turkey and Poland are represented in two data sets from the year 2016 and 2018 Table 01.
Findings
Thanks to the visualisation of the data presenting changed in Poland's and Turkey's LPI (Figure 1, Figure 2), it is clear that in the two years, Poland made a little progress ahead while Turkey declined significantly. This development brought a distance between countries in almost all sub-factors of LPI. Only in the category of Infrastructure, measurements maintain equal in both countries. Such divergence calls for more detail analysis of the most critical factors and explanation, discovering the cause of this outcome.
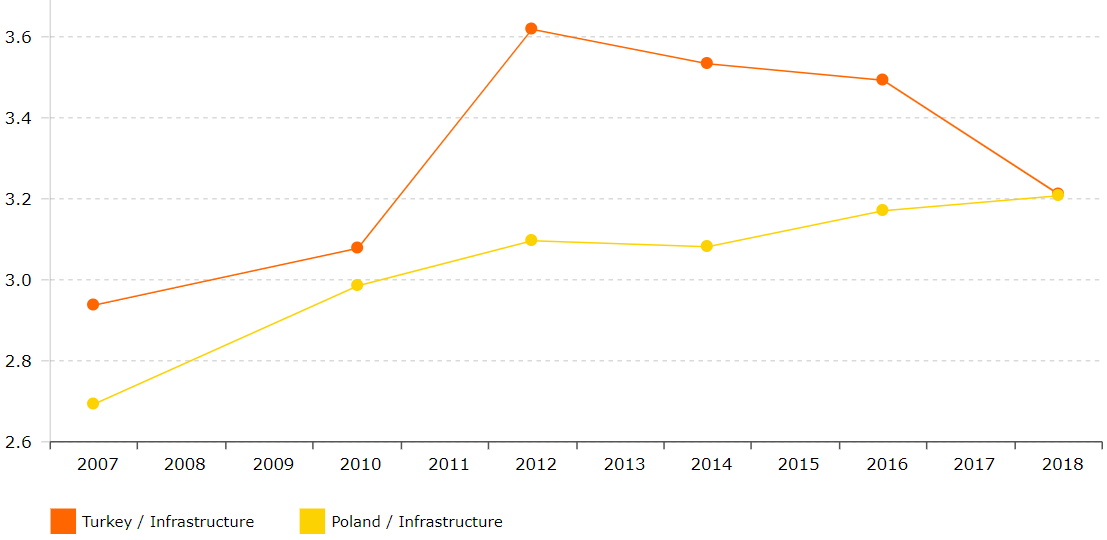
The development of logistic infrastructure in Turkey became an essential prerogative of a government, realising potential opportunities it forms for the country's economy. It was designed to achieve: domestic and international manufacturing centres and better integration of transport modes. It was explained in "From transport to logistics action plan," and realised between 2014-18 (Acar & Gürol, 2016). Governmental plan delivered new infrastructural achievements like airports, high speed train network, seaports. It was expected at that times that infrastructure indicator may improve thanks to further development plans (OECD, 2015). This forward approach is illustrated by the Minister of Transport and Infrastructure Cahit Turhan (Daily Sabah, 2020) claiming that since the early 2000s, the Turkish government has invested around TL 767.5 billion in multiple projects. Impressive projects like the new Istanbul Airport, finished Yavuz Sultan Selim Bridge over the Bosporus, or Turkey's first transshipment container terminal opened at Asyaport helped to maintain still impressive growth of infrastructure subfactor of LPI.
Unfortunately, economic factors work against plans to modernise and further progress in this area. Since January 2018, the Turkish lira has lost 40 percent of its value against the dollar. Additionally, in early August, happened another distress to the economy in form the doubling of tariffs on Turkish steel and aluminum by the U.S. administration. Consequently, the credit rating agencies Moody's and S&P Global Ratings downgraded Turkey in September 2018. All the mentioned factors resulted in the growth of the rate of inflation, reaching around 25% (Greenway, 2018). In such conditions, it is difficult to carry on and start a large scale infrastructural projects. Some point out areas for improvement, like legislation dedicated to logistics infrastructure and liberation of railway transport and infrastructural links between dry ports, which are not run at full capacity (Tabak & Yildiz, 2018). All listed factors influenced the trend visible in Figure 3. Noticeably slowdown of the Turkish infrastructural subfactor met in 2018 polish one, remaining on stable growth from the year 2007.
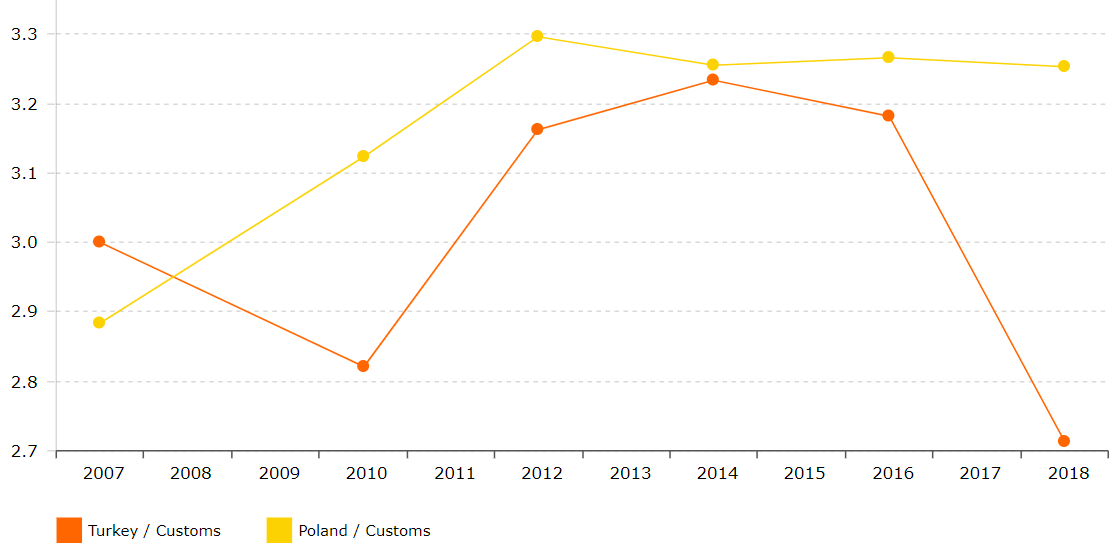
In the customs area of logistic performance, a few factors are influencing visible on Figure 4 outcome. Firstly, after some problems impacting customs procedures, Turkey joined the Convention on Common Transition in 2012. Improve in customs factor of the LPI index proves that adjusting to electronic processes as it is among other European countries was successful (OECD, 2015). Between 2014 and 2016, delays in adapting the customs to EU regulation affected logistic performance, as seen in Figure 4. It is essential to understand that Turkey is one of few countries that have a Customs Union with the EU whilst not being a member state, which may affect such proceedings (Goral & Dartan, 2016). However, it is worth mentioning that probably Turkey would have experienced a lower level of exports and GDP per capita in the eventual absence of the EU–Turkey CU. Published results of the research indicate that Turkey's exports to the EU and Turkish GDP per capita could have been 38 % and 13 % less, respectively (Ekici et al., 2016). At the same time, the Ethics and Reputation Association of Turkey (TEİD) published the report: The Ethics Management and Corruption Perception in the Private Sector. The study includes the outcome of a survey where senior managers and employees from some 356 companies in the country's top 500 list, took part. In conclusion, 57 percent of respondents named the logistics and customs sectors as the most corrupt in the country (Ergu, 2016). The strength of custom service is often tested in the south region of a country on borders with Syria and Iraq. According to Turkey's Customs and Trade Ministry, the amount of seized goods in 2014 was valued at over 600 ml. $, which is a nearly 50% increase over 2013 figures. It is noted that activities of organised crime, including smuggling of narcotics, gasoline, and tobacco increase in the last few years due to the migration waves that facilitate the illegal transfer of materials, goods, and persons via state borders (Rodeheffer, 2015). In Poland registered a constant level of logistic performance in this period. Membership in UE structures ease the border restrictions and helps to stabilise any of sudden development like the migration crisis in 2015.
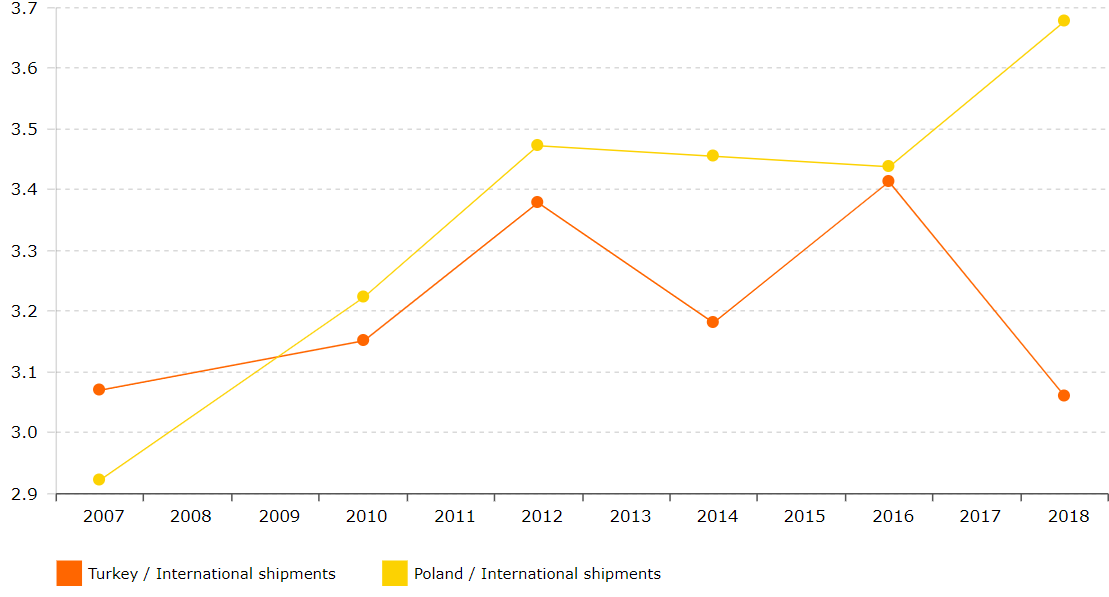
International shipments are particularly important for building the participation of Turkish companies in global supply chains. Unfortunately, observed formal hindrances influencing cross border operations, cause delays and potential barriers inside European and global supply chain. According to a study, the total value of trade lost because of the delays, cost, and hassle is estimated to be about 3bn €. A good example is the Kapıkule border crossing on Turkey's northern border with Bulgaria, where line of truck awaiting procedures may reach record 17 km. As pointed out by Erman Ereke, a member of the executive committee of the Turkish International Transporters' Association, the customs union means free movement of goods but not trucks. This crucial detail cripples the speed and economy of transport. For each country through which a Turkish vehicle needs to pass, the driver must hold a permit from that country's ministry of transport or an equivalent body. Every year Turkish logistics operators apply for 60.000 transport permits to the EU (Srivastava & Barker, 2017). On the southern border, due to military operation in Syria an official export decline significantly as observed by Hikmet Çinçin, President of the Antakya Chamber of Trade and Industry (ATSO). Another military barrier for the supply chains restricts access to the transit route through Syria to the Gulf countries. Instead, a more expensive but safer way is chosen. Participants of a global supply chain from Turkey rather choose ferries from the port of İskenderun to Egypt or further via the Suez Canal to Saudi Arabia (Global Risk Insights, 2017). The last factor impeding international shipments is connected with the coronavirus epidemic. Turkey, on 23.02.2020, closed its border with Iran as a precautionary measure to halt the potential spread of coronavirus after the neighboring country reported 43 cases of the disease. All highways and railways will be closed as of 5 p.m. local time on Sunday and flights from Iran suspended (Koca F., Turkish Health Minister, Lovelace, 2020). In contrary Polish international shipment subfactor in the recent period increases. Mostly thanks to increased competition amongst international logistic operators and growing participation of Polish business in European supply chains (Figure 5).
Conclusion and Discussions
To conclude the findings, it is best to assess the similarity of development od logistic performance in bout countries. Comparing changes in correlation between Polish and Turkish overall LPI across respectively 2007-2016 and 2007-2018, it is observed that the strength of correlation weakens. Until 2016 (Figure 6). Pearson correlation coefficient equals 0,73, which indicates a high correlation.
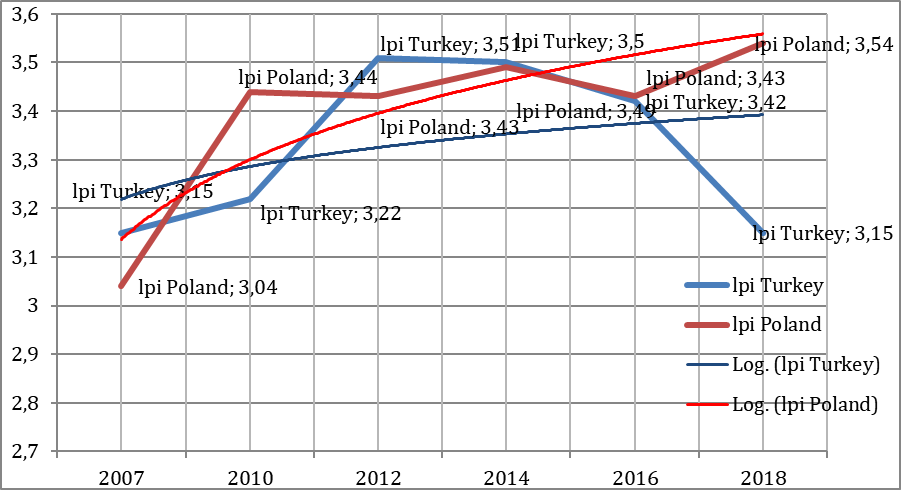
By extending the researched period to 2018 (Figure 6), it is clear that the Pearson correlation coefficient decline to 0,38 what is described as an average correlation. Thanks to the separation of the particular subfactors influencing the overall index, it was possible to allocate factors responsible for the observed decline in the Turkish LPI. International shipments, customs, and logistic competence exerted a significant negative influence. Although improved logistics infrastructure becomes an inherent advantage, many external factors start to play a role in perceived logistic performance. Military operations behind the southern border increase the risk of the transport operation. The migration of Syrian citizens increases difficulties on the border crossing. Inherited problems in transportation to the EU countries additionally decrease logistics potential in Turkey. Compared country, Poland stays on the growth path of the LPI index. Clearly, participation in European supply chains becomes critical for the increase of many subfactors building overall LPI. As pointed out, difficulties concerning Turkey's logistics may be temporary, and it would be constructive to examine the described similarity in the next periods. That could lead to a conclusion about the long-term effect of identified factors on the logistics performance of a country.
References
Acar, A. Z., & Gürol, P. (2016). 'An innovative solution for transportation among Caspian region'. Procedia -Social and Behavioral Sciences, 229, 78-87.
Acar, A. Z., Bentyn, Z., & Kocaoğlu, B. (2020). Comparing the development of Turkey and Poland as potential logistics hubs in the context of international logistics. International Journal of Logistics Systems and Management, 35(3), 410-424.
Arvis, J. F., Saslavsky, D., Ojala, L., Shepherd, B., Busch, C., & Raj, A. (2014). Connecting to Compete 2014: Trade Logistics in the Global Economy: The Logistics Performance Index and Its Indicators, The World Bank.
Blaik, P. (2016). Identyfikacja poziomu kosztów logistyki w skali światowej a ranking logistics performance index (LPI) [Identification of the level of logistics costs on a global scale and the logistics performance index (LPI) ranking]. In Z. Bentyn, & M. Szymczak, M. (Ed.), Logistyka i zarządzanie łańcuchem dostaw wobec wyzwań gospodarki światowej, Poznań, Wydawnictwo UEP.
Daily Sabah. (2020, January 9). Turkey invests TL 767.5B in transport infrastructure in 17 years. Daily Sabah, https://www.dailysabah.com/business/2020/01/09/turkey-invests-tl-7675b-in-transport-infrastructure-in-17-years
d'Aleo, V. (2015). The mediator role of logistic performance index: a comparative study. Journal of International Trade, Logistics and Law, 1(1), 1-7.
Ekici, Ş. Ö., Kabak, Ö., & Ülengin, F. (2016). Linking to compete: Logistics and global competitiveness interaction. Transport Policy, 48, 117-128.
Ergu, E. (2016). Customs, logistics' most corrupt' sectors in Turkey: Survey. Hurriyet. https://www.hurriyetdailynews.com/customs-logistics-most-corrupt-sectors-in-turkey-survey---100134
Global Risk Insights. (2017, April 9). Is Hatay Immune from Syria's Conflict? http://globalriskinsights.com/2017/04/hatay-immune-syrias-conflict-gri/
Goral, E., & Dartan, M. (2016). The customs union in the context of EU-Turkey relations: An evoluation of current debates. Marmara Journal of European Studies, 24(2).
Greenway, T. (2018). Ambitious plans: How Turkey aims to overcome economic woes, Delivered. The Global Logistics Magazine, https://www.logistics.dhl/global-en/home/about-us/delivered-magazine/articles/2018/issue-5-2018/turkey-charting-a-new-course.html
Jhawar, A., Garg, S. K., & Khera, S. N. (2014). Analysis of the skilled work force effect on the logistics performance index—case study from India. Logistics Research, 7(1), 117.
Lovelace, B. Jr. (2020, February 23). Coronavirus updates: Austria halts train traffic with Italy, Turkey closes Iran border. CNBC. https://www.cnbc.com/2020/02/23/coronavirus-latest-updates.html
Martí Selva, M. L., Puertas Medina, R. M., & Garcia, L. (2014). Importance of the logistics performance index in international trade. Applied Economics, 1-11.
OECD. (2015). International Transport Forum, Drivers of Logistics Performance - Case Study of Turkey, www.internationaltransportforum.org
Ojala, L., & Celebi, D. (2015). The World Bank's Logistics Performance Index (LPI) and drivers of logistics performance. Proceeding of MAC-EMM, OECD.
Rodeheffer, L. (2015, July 22). Syrian Smuggling: A Rising Risk for Turkey. http://globalriskinsights.com/2016/07/syrian-smuggling-a-rising-risk-for-turkey/
Srivastava, M., & Barker, A. (2017). Turkey border gridlock hints at pain to come for Brexit Britain. Financial Times. https://www.ft.com/content/b4458652-f42d-11e6-8758-6876151821a6
Tabak, Ç., & Yildiz, K. (2018). Turkey's logistics impact compared to the Netherlands, Germany and Belgium. International Journal of Logistics Systems and Management, 31(1), 1-19.
The World Bank. (2018). Global Rankings 2007-2018. https://lpi.worldbank.org/international/global/2018
Witkowski, J. (2010). Zarządzanie łańcuchem dostaw [Supply chain management]. Wydawnictwo PWE.
Wong C., & Karia, N. (2009). Explain the competitive advantage of logistics service providers. Int Prod Econ, 28, 51–67.
Copyright information

This work is licensed under a Creative Commons Attribution-NonCommercial-NoDerivatives 4.0 International License.
About this article
Publication Date
31 December 2021
Article Doi
eBook ISBN
978-1-80296-120-1
Publisher
European Publisher
Volume
121
Print ISBN (optional)
-
Edition Number
1st Ed.
Pages
1-286
Subjects
Strategic management, Leadership, Technology, Sustainability, Society 5.0, New strategic challenges
Cite this article as:
Bentyn, Z. (2021). Comparing Of Logistic Performance In Turkey And Poland. Explaining Divergence In Development. In M. Ozsahin (Ed.), New Strategic, Social and Economic Challenges in the Age of Society 5.0 Implications for Sustainability, vol 121. European Proceedings of Social and Behavioural Sciences (pp. 225-235). European Publisher. https://doi.org/10.15405/epsbs.2021.12.04.23