
Trust & Expectation Measured With Proejctive Iconics


Abstract
This research introduces an evolutionary step in the development of Mind Genomics, called ‘Projective Iconics.’ The organizing principle is that people can reveal their mindsets by being exposed to a problem and then responding to vignettes comprising combinations of people, organizations, or institutions that may solve the problem. The experiment introduced the issue of climate. As prospective ‘solvers’ of this problem, four types of icons (people, institutions) and four specific examples (viz., people, etc.) for each icon are selected. The respondent reads vignettes comprising systematically varied combinations of icons, containing 2-4 specific examples in each vignette. The respondent then rates the likely outcome in terms of two dimensions; the ability to debate the topic in a trustworthy way, and the ability to arrive at the truth through the debate. Results from the total panel suggested no clear patterns. Clustering respondents based on the patterns of estimated trust in the group to debate honestly and separate clustering based on the patterns of estimated ability to arrive at the truth revealed consistent patterns new to the world ‘mindsets’. ‘Projective Iconics’ suggests a new way to think about the way people approach social problems. This approach could be used successfully to collect employee’s opinion regarding company’s management.
Keywords: Clustering, mind genomics, mindset, projective iconics, vignettes
Introduction-Today’s Environment of Problems and The Armory of Research
Our society faces these many problems and a fractured social body, with differences of opinions about what should be done, who should do it, or more typically, what doesn’t work, and who is responsible for it. Social scientists conduct polls, watch elections, and do text analyses of comments on the Internet to understand the social problems and provide the solution. Collecting valuable information from people participating in polls obliges researchers to look for new ways of conducting polls, interviews, etc.
The origins of this study come from conceptual analyses that suggest that one might learn more about the possible solutions to a problem by using metaphors. The metaphors themselves would not necessarily have to be technical solutions to the issues but rather point to the type of person who might solve the problem.
Researchers have tried to use metaphors in the teaching of different topics (Black, 1993) was one of the first researchers trying to understand how symbolic statements work and the relations of a metaphor to its grounding resemblances and analogies (Lynch & Fisher-Ari, 2018) present the experience of using metaphors in the teaching process by educators in early childhood education and share insights from their own experiences in considering novice teachers' metaphors in their preparatory experiences (Dong, 2004) applied the same technique to teach English to young international students and presents the challenges in using metaphors to provide students with opportunities and resources. The same approach is used even in the higher education system, focusing on the importance of analogical reasoning and the specific use of metaphors as vehicles for knowledge transfer (Mouraz et al., 2013) Metaphors, analogies, and similes are used to teach pathology courses to medical students (Kanthan & Mills, 2006). They find this paradigm an effective teaching strategy to augment communication skills to understand complex medical concepts better (Gibbs, 2008) provides a holistic presentation of the relation between metaphor and thought.
All the studies mentioned above have in common the fact they are observations, practical pedagogical experiments. Our study is different as we make a quantitative evaluation to understand and justify the obtained conclusions. This study uses Mind Genomics (Moskowitz et al., 2006; Moskowitz et al., 2020; Moskowitz, 2012) to collect the data and perform the necessary analyses. As discussed below in detail, Mind Genomics uses combinations of ideas, presenting these combinations for evaluation, getting responses to the combinations, and then deconstructing the rating to the combination into the contribution or so-called ‘part-worth' of each element in the combination (Gere et al., 2018; Gofman, 2012; Ilollari et al., 2019; Saulo et al., 2019).
Could the same process work when the elements, viz. components of the combinations, are metaphors rather than specific phrases offering concrete solutions? The other idea is to allow two types of answers embedded in the same response; specifically, could the people described work together in a debate format, and would the outcome of the debate be trustworthy on the one hand and effective on the other?
Thus, it was born the idea of using metaphors, in combination, to provide an idea of just ‘who’ or really the ‘type of person’ who could debate a problem, be believed, and provide a reasonable, accurate solution.
As presented below, that idea was then fitted to the Mind Genomics paradigm, with somewhat surprising results.
Before launching into the approach, it is instructive to look at the different types of research which, in one or another way, have driven the authors to consider this novel approach of Projective Iconics. The common factor is that the researcher does not require a detailed explanation of what the respondent (or student or employee) is thinking. It is enough to link the respondent’s feelings and judgments to external stimuli, which themselves are complex and have meaning. Our research was inspired by the image of icons or metaphors and the nature of what could be gleaned by the researcher when the respondent uses only metaphors (Doherty & Nelson, 2010; Kelley & Michela, 1980; Ogden, 1979). Topics such as attribution theory in research and education fall into this effort to use symbols and metaphors instead of cognitively direct phrases (Harvey & Weary, 1984; Mesías & Escribano, 2018).
Finally, the focus of this introductory study on Projective Iconics is not accidental. The research began during March 2021, when climate issues were becoming even more public than before. During the past decade, there has been increasing awareness of our ‘run-away’ climate. This study analyses the topic of climate without, however, specifying the problem. The objective was to get a sense of how the people in the United States would perceive the different icons as able to discuss the issue and come up with facts that could be used (DeBono et al., 2012; Kyselá et al., 2019; Moser, 2016).
Steps in the Mind Genomics Process to Uncover Relations Between Variables
The Mind Genomics process follows a defined series of steps, beginning with the definition of the problem, the choice of raw material to test, the creation of test stimuli, and then followed by the transformation of the ratings to a form usable in analysis. The process in its current state dates from the early years of this century but was in use in other formats before its formalization as an Internet-based tool (Gofman & Moskowitz, 2010; Moskowitz et al., 2001).
Step 1: Define the problem, select four questions that ‘tell a story’
The four questions should represent the backbone of the study. Next, select four answers to each question. The answers should illustrate all points of view regarding the questions (Todri et al., 2020). The study deals with the issue of WHO CAN ONE TRUST in 2021, a topic of interest in terms of the problem, the individuals, and the specific actions.
Projective Iconics introduces the notion of using the WHO to provide the implicit, unspoken solution. That is, the WHO provides both a specific agent, with that agent, in turn, providing the solution. The solution itself is never mentioned. Rather, it is the specific agent, the WHO, which gives a rough sense, perhaps not even a verbalizable sense, of what the agent will provide. The WHO is thus a metaphor as well.
- The topic is the issues with the environment.
- The four questions are not questions but rather the nature of WHO is participating in this debate about the topic.
- The four answers are four specific agents in each group. The individuals are chosen to represent metaphors of people. These can be considered as icons and need not be people, but can be well-known symbols, such as The Bible.
- Table 1 shows the four questions/answers (in the language of Mind Genomics), or more correctly, icons and metaphors.
Step 2 – Create test combinations of elements (vignettes)
This step begins with what is NOT the case, namely the typical ‘one at a time’ research strategy. One at a time makes the respondent evaluate each of the 16 answers (A1-D4), usually in a randomized order, different for each person. The randomized order ensures no systematic ‘order bias’, with the respondent’s criterion changing during the evaluation and thus introducing a biased rating. Good research practice would assume but not demonstrate that the respondent uses the same criterion for rating each of the 16 alternatives, viz., elements A1-D4, respectively shown in Table 1. Our positions are that it does not make sense that a respondent would or even could use the same criterion for each. Often the elements are incommensurate with each other, such as the name of the person, type of item, such as social media. That is the case in the current study, where all 16 answers are icons or metaphors, some proper names, others simply the position of a person or the type of object or general service.
We can ensure more valid data by presenting respondents with short stories or vignettes, comprising 2-4 elements, put together, one element above the other, perhaps centred, without putting in connecting elements. That is, by giving the stimulus a set of different parts, the stimuli become more accurate, and in the end, the respondent is forced to use the same scale to judge the now compound stimulus, viz., the mixture. One can be more confident, although never entirely sure, that the respondent uses the same criterion to judge each vignette. The researcher only later deconstructs the ratings assigned to the vignettes and estimates the ‘amount’ of the rating attributable to each of the 16 individual elements (Gere, Papajorgji et al., 2019).
Each respondent evaluated a separate, unique set of 24 vignettes, combinations of elements. A single respondent evaluated each of the 16 elements 5x, embedded in the 24 vignettes, with the property that the elements were statistically independent of each other. Each vignette comprised at most one element or answer from a question, but often no elements or answers from a question (Moskowitz et al., 2020).
The design of the 24 vignettes, so-called ensures that each respondent evaluates just the right set of combinations allowing for an equation or model to be created for the data of that one respondent (Gofman & Moskowitz, 2010). The systematic permutation of the designs into hundreds of isomorphic designs ensures that all the designs for the respondents have the same mathematical properties, and that across the designs the combinations cover a great deal of the ‘design space,’ viz., the possible combinations. It is this permutation which creates the metaphorical similarity to the MRI used in medicine to take different ‘snapshots’ of the same tissue, albeit from different angles, and then combine these snapshots by computer to generate a 3-dimensional view (Gofman & Moskowitz, 2010).
Step 3: Launch the study
Step 3 is the actual execution of the Mind Genomics experiment. The respondent, member of a panel of 200 + students and adults in the United States (more individuals in other countries), agrees to participate, and does so in order receive ‘points’ that be used for prizes. The panel provider (https://luc.id) makes it straightforward to tailor the panel composition, within general limits of age, gender, children, income, education and so forth.
The respondent self-defines by gender, by age, and answered a third question. Thus, Mind Genomics provides all together up to 7 different variables to distribute the obtained results (Gere et al., 2019). For this study, this third question of the preliminary questions was:
How do you think about yourself when listening to debates?
1=Interested and involved, including mentally weighing their points
2=Interested in general, but not in the specific points
3=Tolerate it when listening, but not really caring
4=I don't believe most of what I hear
The respondent evaluates the unique set of 24 vignettes, one vignette at a time. The vignette automatically advanced after the respondent assigned the rating. The respondent used a 5-point rating scale, with an anchor on each scale point:
Imagine a debate among four separate groups on the topic of. Give your first impression of what you would take away from this debate among these four groups.
1=Don't trust debaters AND No truth emerges
2=Don't trust debaters BUT truth emerges
3=Undecided
4=Trust debaters BUT No truth emerges
5=Trust debaters AND truth emerges
Step 4: Create the data matrix
Prior to the analysis, the five scale points were used to create four new variables, which will be used in the analyses. The binary variables allow us to focus on truth and trust, respectively.
These five scale points generate four binary new scales
- Truth EmergesRating 2 or 5- 100, otherwise 0
- No Truth Emerges: Rating 1 or 4 100, otherwise 0
- Trust Debaters:Rating 4 or 5 100, otherwise 0
- Do Not Trust Debaters:Rating 1 or 2 100, otherwise 0
To the binary transformed variables, either 0 or 100, was added a small random number around 10-3 so that the data would be compatible with OLS (ordinary least-squares) regression at the level of the individual respondent. OLS regression (Zdaniuk, 2014) must have some small degree of variation in the response variable. For example, consider the case that the respondent always rates a vignette as either 2 or 5. Newly created binary scale #1, ‘Truth Emerges’, will show all vignettes for that respondent converted to 100. The regression modelling will crash when it reaches that respondent. Our introduction of a small random number added to the ratings prevents the crash, but does not materially affect the results
The Mind Genomics system collects the data, which includes both the rating on the anchored, 1-5 scale, as well as the response time. The response time is operationally defined as the number of seconds, to the nearest tenth of a second, between the presentation of the vignette, and the response.
- The starting data base comprises the unique code for the respondent, the age, gender, and answer to the preliminary question, all repeated 24 times for a respondent.
- For each of the 24 vignettes evaluated by the respondent, generating 24 lines of data, the database comprised the order of testing (1-24), the structure of the vignette as a set of 16 numbers, one for each element, with a 1 present when the element was present in the vignette, and a 0 when the element was absent from the vignette.
- Finally, based upon the response, the dataset comprised the rating and the response time.
- The data matrix comprises other variables used for a variety of analyses, including order of testing (01-24), order of testing in sets of three (01-08), the specific structure of the vignette in terms of which types of answers were present in the vignette.
Results
What elements drive the transformed variables?
The analysis begins by creating equations or models relating the presence/absence of the elements to the transformed ratings. The first analysis focuses on the Total Panel of 4848 observations (all 202 respondents, all 24 vignettes). All vignettes are included, no matter how the vignette was rated by the respondent. In subsequent analyses, the focus will be only on those vignettes not rated ‘3’. Recall that ‘3’ corresponded to ‘cannot decide.’ Recall also that the form of the equation is the same for all dependent variables; the equation is absent the additive constant. The absence of the additive constant means ‘forcing the regression model through the origin.’ This way, the system generates coefficients that correlate with the coefficients calculated when the regression is estimated with an additive constant, as Figure 1 shows for the four newly created variables. The abscissa corresponds to the coefficient estimated with an additive constant. The ordinate corresponds to the coefficient calculated without an additive constant (viz., forced through the origin).
Figure 1 presents the scatterplots showing high covariation of coefficients for the same data, estimated with equations have an additive constant (abscissa) versus forced through the origin with no additive constant (ordinate). The correlations are 0.90+.
Dependent Variable = k1(A1) + k2(A2) +… + k16(D4) Equation 1.
To allow patterns to emerge, only coefficients of 11 or higher are shown, corresponding to coefficients of 0 or higher for the models estimated with coefficients. The very strong performing elements are those which show a value of 21 or higher, corresponding to a coefficient of +8 or higher in models estimated with an additive constant. In other Mind Genomics studies, coefficients of 8 or higher signal an element which is both statistically significant (T> 1.5) and correspond to something ‘meaningful’ which covaries, such as an increase in sales, and so forth.
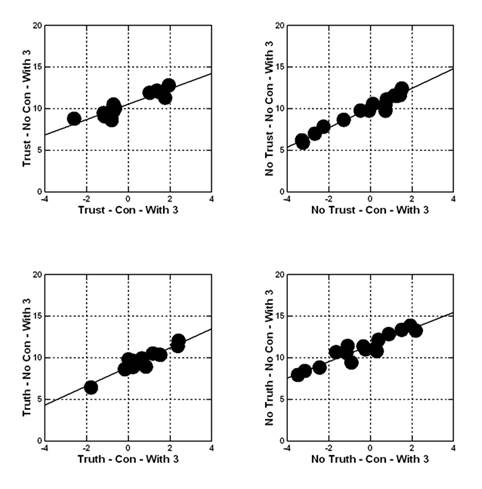
Table 2 shows the models for the total panel, for response time, for ability to decide (viz., rating <> 3), ratings of trust, truth, and then the ratings that we would consider ‘negative’, viz., inability to decide, no trust, no truth. The next step incorporates the data for ALL vignettes in the models. Results suggest little in the way of information about the mind of the respondent. There emerge interesting ‘factoids’ such as the fact that The BIBLE and the newspaper are most trusted, that the military leader would be able to establish the truth for the positive elements, and a variety of equal interesting but not strong performing elements. For example, politicians are thought not to be trustworthy, and government is believed to be the least truthful.
One can summarize that the total data across all the respondents and all the vignettes is simply confusing. It could be that the lack of strong performing elements comes from the inclusion of all the vignettes, those assigned ‘3’ (cannot decide), and those not assigned 3 (viz., can decide). Results shows the coefficients for the models relating the presence/absence of the 16 elements to response time and to newly created binary variables. The models are estimated without the additive constant, and are estimated using ALL vignettes, 4848 observations.
What drives perceived trust, lack of trust, competence, perceived lack of competence in the absence of ratings ‘cannot decide’?
The second analysis moves to the five critical dependent variables (response time, trust, truth, no trust, no truth). However, this time For the comments reported hereafter in this paper, the database will not include the vignettes assigned the value ‘3’ (cannot decide) because they can be considered as a disturbing second factor, better considered as noise.
There are relevant patterns and some surprises.
- The coefficients are higher, but none move into the region of 20+. Removing the vignettes, which are presumed to defy judgment for the individual, ‘sharpens’ the data but does not produce dramatic patterns in the way that we will see below when we create mindsets.
- Trust – the newspaper and the Bible are the most trusted, yet the religious leader and the politician are least trusted.
- Truth – Truth is to be gotten from God, the military leader, and social media.
- Lack of Trust – is to be gotten from the military leader, the politician, President Biden.
- Lack of Truth – is to be gotten from almost everyone.
The data from the Total Panel show that there are stronger opinions, but that there are also many apparent contradictions. We will look further at gender and age to see whether we can find stronger patterns emerging, patterns which do not carry within them these disturbing mutual contradictions.
Discussion
It is in the mindsets where dramatic differences emerge across elements and where they can be labelled because they tell a straightforward story. There were five dependent variables, Trust, No Trust, Truth, No Truth, and Response Time. The complete set of respondents were clustered separately for each dependent variable, with the clustering using all 24 vignettes evaluated by the respondent. Recall that the 24 vignettes constituted a valid experimental design, allowing for creating an individual-level equation or for each dependent variable 202 individual equations.
The clustering program, k-means, generated three groups of respondents based upon making the distance large among the three clusters' centroids and the distances small between pairs of respondents within a cluster (Mucherino et al., 2009a; Mucherino et al., 2009b). The distance measure is (1 – Pearson R), with the Pearson R measured across the 16 corresponding pairs of coefficients. After the clustering is complete, each respondent was assigned to the appropriate cluster or mindset for each of the five dependent variables. A preliminary cross-tabulation of membership did not suggest any clear pattern of memberships, including a lack of a clear pattern between segments defined by opposites (e.g., Trust versus No Trust; Truth versus No Truth).
The model or equation for each cluster will now run using the data from the respondents from the cluster or mindset, and only with vignettes a rating other than ‘3’ (3= cannot answer.) Tables are created to show these results, only for the strong performing elements for each mindset (cluster). The mindsets make a great deal more sense. It is essential to add, however, that sometimes there will be a surprise. The surprise, however, comes from our lack of understanding the deeper pattern rather than from an error. The reason for this statement is the overarching clarity of the mindsets, results that could never have been done at a conscious level within the scope of the experiment.
It is crucial to keep in mind that each of the five sets of three segments was made separately, following the approach specified in the preceding paragraphs. Three mindsets were identified for each clustering solution to determine the nature of the mindsets that would emerge with other criteria held reasonably constant. The obtained results suggest that when we force three mindsets to emerge, the one who does so relatively in an unmixed format is the mindset based upon People (Teachers, Friends, Family, God). Occasionally one or another icon or metaphor enters the cluster. Furthermore, not all People enter every clustering.
When clustering is based on response time, looking at typical patterns, a different pattern appears. Perhaps because response time is not a function of judging criteria, but instead a function of familiarity versus novels (expected to be in the vignette versus non-expected to be in the vignette, with a next moment of additional thought).
No matter the reason underlying the mindsets, it remains important to recognize that the mindsets were created by looking at the pairwise correlations between the patterns of 16 coefficients for each pair of respondents to develop a measure of distance (D = 1-Pearson R). As such, no attention was paid to the actual magnitudes of the coefficients but rather the pattern. The consequence, however, is the emergence of coefficients far more significant in many cases than the corresponding coefficient from the total panel. The total panel never had coefficients over 20. The groups defined by who they are or what they think showed coefficients between 21 and 30, whereas the groups defined by how they answer (think) often show coefficients near 30 and above 30.
Result tables with the three mindsets created for each of the five variables are created. Following will show only two examples; one on Clustering on Do Not Trust the Debaters shown in Table 3 and the other one on Clustering on Truth will not emerge from the debate shown in Table 4.
Table 3 shows the three mindsets for the dependent variable of NO Trust. The model is absent the additive constant. No vignettes were included when the rating for the vignette was ‘3’ (cannot decide.)
Table 4 shows the three mindsets for the dependent variable of Truth will not emerge from the debate. The model is absent the additive constant. No vignettes were included when the rating for the vignette was ‘3’ (cannot decide.)
Conclusions – Studying Attitude at the Level of an Impressionist Canvas
This paper has set some stages for a new part of the Mind Genomics effort, called Projective Iconics. The objective is to create a veritable impressionistic canvas of a situation for a particular problem (climate change) and the types of forces that might be involved in the solution of the problem. This effort aims to introduce the approach, using a large-scale study (202 respondents), on a well-known topic (climate). The emerging data allows us to create tables that give a sense of what people think ‘will work’ and what will not.
One might limit the discussion and application of this experiment to the topic of climate and the specifics of the people presented here. It would be far better, more productive to consider Projective Iconics as a way to paint the emotional feelings of people towards what can really help them solve a problem. Projective Iconics does away with the rational thinking of ‘who, specifically, can be ‘X’ to solve problem ‘Y’, a problem specified at a rational level. Rather, with Projective Iconics it becomes clear what type of solutions will work with Problem Y, with these solutions either being name/icons/metaphors, like the present study, or other approaches, other types of action, such as popular action by the people, government actions, calls from the clergy, and so forth. This approach could be used successfully to collect employee’s opinion regarding company’s management.
References
Black, M. (1993). More about metaphor. In Metaphor and Thought (pp. 19–41). Cambridge University Press.
DeBono, R., Vincenti, K., & Calleja, N. (2012). Risk communication: climate change as a human-health threat, a survey of public perceptions in Malta. The European Journal of Public Health, 22(1), 144–149.
Doherty, S., & Nelson, R. (2010). Using projective techniques to tap into consumers’ feelings, perceptions and attitudes . . . getting an honest opinion. International Journal of Consumer Studies, 34(4), 400–404.
Dong, Y. R. (2004). Don’t Keep Them in the Dark! Teaching Metaphors to English Language Learners. The English Journal, 93(4), 29.
Gere, A., Zemel, R., Papajorgji, P., & Moskowitz, H. (2019). “Candy Is Dandy”: The Mind of Sexuality as Suggested by a Mind Genomics Experiment. In ACS Symposium Series (Vol. 1321).
Gere, A, Papajorgji, P., Moskowitz, H., & Milutinovic, V. (2019). Using a Rule Developing Experimentation Approach to Study Social Problems: The Case of Corruption in Education. International Journal of Political Activism and Engagement, 6(3), 23–48.
Gere, A., Zemel, R., Papajorgji, P., & Moskowitz, H. (2018). Weak Signals and Mind-Sets of Consumers: The Case of Milk. Journal of Food Science and Engineering, 8, 125–136.
Gibbs, R. W. J. (Ed.). (2008). The Cambridge Handbook of Metaphor and Thought. In The Cambridge Handbook of Metaphor and Thought (pp. xiii–xiv). Cambridge University Press.
Gofman, A. (2012). Origins of RDE and the Role of Experimentation in Consumer- Driven Innovation. In H. R. Gofman, A., & Moskowitz (Ed.), Rule Developing Experimentation: A Systematic Approach to Understand & Engineer the Consumer Mind (pp. 3–33). Bentham ebooks.
Gofman, A., & Moskowitz, H. R. (2010). Isomorphic Permuted Experimental Designs And Their Application In Conjoint Analysis. Journal of Sensory Studies, 25(1), 127–145.
Harvey, J. H., & Weary, G. (1984). Current Issues in Attribution Theory and Research. Annual Review of Psychology, 35(1), 427–459.
Ilollari, O., Papajorgji, P., Gere, A., Zemel, R., & Moscowitz, H. R. (2019). Using Mind Genomics to Understand the Specifics of a Customers Mind.
Kanthan, R., & Mills, S. (2006). Using Metaphors, Analogies and Similes as Aids in Teaching Pathology to Medical Students. International Association of Medical Science Educators, 16(1).
Kelley, H. H., & Michela, J. L. (1980). Attribution Theory and Research. Annual Review of Psychology, 31(1), 457–501.
Kyselá, E., Ščasný, M., & Zvěřinová, I. (2019). Attitudes toward climate change mitigation policies: a review of measures and a construct of policy attitudes. Climate Policy, 19(7), 878–892.
Lynch, H. L., & Fisher-Ari, T. R. (2018). What We Learned about Using Metaphors in College Teaching: Methods and Meanings. College Teaching, 66(2), 60–62.
Mesías, F. J., & Escribano, M. (2018). Projective techniques. In Methods in Consumer Research (pp. 79–102). Woodhead Publishing.
Moser, S. C. (2016). Reflections on climate change communication research and practice in the second decade of the 21st century: what more is there to say? WIREs Climate Change, 7(3), 345–369.
Moskowitz, H. (2012). “Mind genomics”: The experimental, inductive science of the ordinary, and its application to aspects of food and feeding. Physiology and Behavior, 107(4), 606–613.
Moskowitz, H., Beckley, J., & Ashman, H. (2006). Founding A New Science: Mind Genomics. Journal of Sensory Studies.
Moskowitz, H. R., Gofman, A., Itty, B., Katz, R., Manchaiah, M., & Ma, Z. (2001). Rapid, inexpensive, actionable concept generation and optimization: the use and promise of self‐authoring conjoint analysis for the food service industry. Food Service Technology, 1(3), 149-167.
Moskowitz, H. R., Wren, J., & Papajorgji, P. (2020). Mind Genomics and the Law. Lambert.
Mouraz, A., Pereira, A. V., & Monteiro, R. (2013). The Use of Metaphors in the Processes of Teaching and Learning in Higher Education. International Online Journal of Educational Sciences, 5(1), 99–110.
Mucherino, A., Papajorgji, P., & Pardalos, P. (2009a). Clustering by k-means. In Data Mining in Agriculture (pp. 47–82).
Mucherino, A., Papajorgji, P., & Pardalos, P. (2009b). Introduction to Data Mining. In Data Mining in Agriculture (pp. 1–20).
Ogden, T. (1979). On projective identification. The International Journal of Psychoanalysis, 60(3), 357–373.
Saulo, A., Moskowitz, V., Gere, A., Papajorgji, P., Ettinger Lieberman, L., & Feuerwerker, D. (2019). Linking Food Endorsement Labels & Messaging to Perceived Price and Emotions. A Mind Genomics ® Exploration. Advances in Nutrition and Food Science, 5.
Todri, A., Papajorgji, P., Moskowitz, H. R., & Scalera, F. (2020). Perceptions regarding Distance Learning in Higher Education, Smoothing the Transition. Contemporary Educational Technology, 12(1).
Zdaniuk, B. (2014). Ordinary Least-Squares (OLS) Model. In Encyclopedia of Quality of Life and Well-Being Research (2014. Edit). https://doi.org/https://doi.org/10.1007/978-94- 007-0753-5_2008
Copyright information

This work is licensed under a Creative Commons Attribution-NonCommercial-NoDerivatives 4.0 International License.
About this article
Publication Date
31 December 2021
Article Doi
eBook ISBN
978-1-80296-120-1
Publisher
European Publisher
Volume
121
Print ISBN (optional)
-
Edition Number
1st Ed.
Pages
1-286
Subjects
Strategic management, Leadership, Technology, Sustainability, Society 5.0, New strategic challenges
Cite this article as:
Petraq, P., Moskowitz, H., & Rodriguez Bejarano, L. E. (2021). Trust & Expectation Measured With Proejctive Iconics. In M. Ozsahin (Ed.), New Strategic, Social and Economic Challenges in the Age of Society 5.0 Implications for Sustainability, vol 121. European Proceedings of Social and Behavioural Sciences (pp. 201-213). European Publisher. https://doi.org/10.15405/epsbs.2021.12.04.21