
Poverty In Post-Soviet Russia: Development Dynamics By Household Income Source


Abstract
The fundamental scientific challenge the ways to the solution of which are presented in this article, is to clarify the mechanisms of poverty alleviation among the population of Russia. One of the important aspects of measuring poverty in post-Soviet Russia is the presence of a persistent bias, which is expressed in the structure of incomes of Russian households where there is a large share of hidden incomes, which are estimated by official statistics at the macro level, but their sources and distribution among households remain poorly understood. Assessing the impact of hidden incomes on poverty alleviation seems to be an urgent problem. The purpose of this work is to explain the changes in the structure of relative poverty of Russian households caused by various components of their disposable resources, including the latent income component. The initial data are presented by the information from the project “The Russia Longitudinal Monitoring Survey – Higher School of Economics” for 2000–2018. Household disposable resources became indicators of well-being. Poor households are those whose per capita disposable resources were less than 50 % of the median. The research methodology is based on approaches to measuring relative poverty, which makes it possible to decompose it through a comprehensive analysis of its level and structure. Poverty decomposition was carried out for the components of household incomes, which make up their total disposable resources, by determining the marginal contribution of each component to the reduction of total poverty.
Keywords: Disposable resources, household, hidden income, poverty, poverty decomposition, welfare
Introduction
Poverty reduction is one of the priority goals of the development of Russian society. The development of effective strategies to overcome poverty is in the focus of attention of state executive and legislative bodies, international organizations and the scientific community of Russia. To objectively assess the effectiveness of the poverty alleviation policy, it is necessary to perform the analysis, allowing to identify trends in the dynamics of poverty in Russian households for sufficiently long period of time. In this context, identifying and detailing the contributions to poverty of various sources of income, which makes it possible to assess the importance of wages, pensions, state social programs, interfamily transfers, etc. in different periods of time and to identify the effectiveness of measures that have been taken in the field of streamlining and increasing wages, indexing pensions and benefits, never loses its relevance. One of the acute problems in assessing poverty is taking into account the contribution to its level of those household incomes that remain outside the field of vision of official statistics and tax authorities.
The main method for measuring poverty in Russia is the absolute approach, which measures the proportion of the population with money incomes below the subsistence level. Regular publication of data on the share of the population with money income below the subsistence level in our country began in 1992. Since 2018, Rosstat has also began to calculate the aggregate indicator of relative poverty, the most common in Western Europe, where three levels of disposable income are used as the threshold of relative poverty, i.e. income amounting to 40, 50 or 60 % of the median income. The advantage of this approach is that it maintains a single poverty criterion for a long time, while the calculation of the subsistence minimum is influenced by social and economic situation in the country, the inflation rate, etc.
Problem Statement
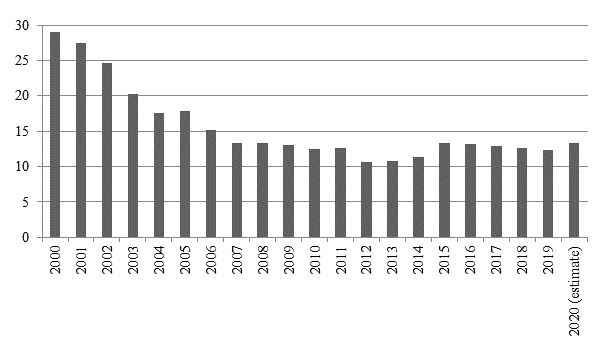
The beginning of the new millennium was a period of long-awaited economic growth for the country. Since 2000, the share of the population with money income below the subsistence minimum has been steadily declining (Figure 1). The 2014 crisis caused by the external sanction led to a sharp rise in the exchange rate of currencies. Another round of falling prices for hydrocarbons led to the fact that official statistics showed a drop in real incomes and, as a result, an increase in the level of poverty, which began to decline again in 2019, but in 2020 the trend reversed due to the economic and social impact of the coronavirus crisis. The growth in the number of the poor was facilitated by a decrease in business activity during the pandemic and, as a result, a decrease in real money income of the population (according to Rosstat, real disposable income in the second quarter of 2020 experienced the deepest drop in quarterly dynamics since the end of the 1990s).
It should be taken into account that the indicators of income and poverty level published by official statistics refer to the population as a whole, while the household is the main resource unit of society. The funds are concentrated in households to maintain a certain standard of living, develop and make decisions about spending, savings, etc. The level and sources of income of household members largely form individual path of economic behavior, and strategies for responding to external influences. In this regard, the study of the dynamics of not only poverty in general, but also the assessment of contributions to total poverty of various sources of income is of considerable scientific interest. It makes it possible to assess the importance of wages, pensions, state social programs, interfamily transfers, etc. and thus assess the effectiveness of measures that have been taken in the field of streamlining and increasing wages, indexing pensions and benefits. An equally important circumstance of Russian reality is the presence of a hidden component in the income of Russian households. It is known that some part of cash in the hands of the population is not reflected in any way in the official reporting of organizations and enterprises as well as tax authorities. The origin of these funds is different. This is both criminal money and income from the shadow economy, but largely its origin is associated with informal employment of the population, such as tutoring, various types of private services, nursing the sick, and cleaning premises. Many of those employed in small and medium-sized enterprises receive their salary off the book. There are many ways to generate income bypassing the fiscal authorities, while tax revenues are an important part of budgets at all levels, and therefore the relevance of knowing where these funds are concentrated is extremely high (Nivorozhkina, 2020).
A detailed overview of the poverty assessment methodology is presented in Ravallion, (1992). The decomposition of poverty by factors of growth and redistribution in dynamics, which makes it possible to assess the mechanism of poverty reduction policy, methods for solving these problems are proposed in Datt and Ravallion (1992). Methods for decomposing poverty indices by income sources are described in Shorrocks (1999). The most complete overview of methods for assessing and decomposing inequality and poverty is presented in Duclos and Araar (2003), who developed a package of applied programs that implement these methods in the STATA package.
Research Questions
The subject of the study is the dynamics of the relative poverty of Russian households in the context of the contribution to poverty elimination of various components of disposable resources of households, including hidden income. The research questions are as follows:
- What components of income play the most significant role in lifting Russian households out of poverty?
- How large is the hidden income component in the household budget and how does it affect the poverty rate, how stable are these characteristics over time?
Purpose of the Study
The aim of the study is to explain the changes in the structure of relative poverty of Russian households caused by various components of disposable resources, including hidden income.
Research Methods
The largest source of data on the population’s living standards at the micro level is the Russia Longitudinal Monitoring Survey – Higher School of Economics (RLMS-HSE) for 1994–2018. (http://www.cpc.unc.edu/projects/rlms, http://www.hse.ru/rlms) containing information of social and demographic nature and information on income and expenditures of households and individuals. RLMS-HSE data represent the population of Russia; however, the institutional population, people without a fixed place of residence, very rich people are not represented in the polls. The main advantage of the RLMS-HSE is a unified methodology for the establishment of indicators of household income and expenditure during the study period.
The households are the objects of analysis. However, with this approach, households with different number of members have the same weight; therefore, for the analysis and decomposition of poverty, the array of households is “stretched” by the number of household members. As an indicator of household welfare, an indicator of monthly disposable resources of a household was identified, which includes, in addition to monetary income, an assessment of natural consumption from various sources, as well as spent loans and savings. Households for which no item of income was specified were excluded from the analysis. For further analysis, the definition of disposable resources of households was used:
Disposable resources = household income including wages + social transfers + private transfers + income from personal subsidiary plots + other income (debt repayment money + insurance payments + sale of personal property + property lease + capital investment in the form of interest on deposits + shares and other securities) + loans and spent savings + hidden income.
To highlight the components of hidden income, the initial data, from 2000 to 2018 inclusive, were transformed into panels for two consecutive years, and all subsequent calculations were carried out on the data of the final panel of the year. Households with hidden income were considered to be those in which current expenditures exceeded available resources by at least 10 % for two consecutive periods. The methodology and empirical assessment of the size of the hidden income component of Russians, based on the Pissarides-Weber model (Pissarides & Weber, 1989), is presented in Nivorozhkina (2020); Nivorozhkina et al. (2020).
The presented approach to poverty decomposition refers to a situation when disposable resources are divided into a J component in the form of wages, social transfers, income from personal subsidiary plots (PSP), hidden income, etc. and the contribution of these sources of income to aggregate poverty needs to be identified.
According to Shapley’s (1953) approach, the marginal contribution of theth component to total poverty reduction is determined by sequentially eliminating each of the factors making up the total income, and then finding the average number of its marginal contributions in all possible elimination sequences for each factor. This procedure leads to an exact cumulative expansion of Yi into J contributions. In the absence of any source of income, its values are considered to be zero. This approach allows for the decomposition of poverty based on FGT indices (Foster et al., 1984) not only for non-overlapping groups of households, but also for their sources of income. The FGT appears as follows:
where is per capita income, – population size, – poor population, – poverty threshold. When =0, the index gives an estimate of the share of population with the income below the poverty threshold; at=1 the index gives an estimate (in % of the poverty threshold) of the poverty gap; at2 the significance of large values of the missing income increases, therefore this indicator characterizes the severity of poverty.
Findings
Figure 2 shows the distribution of disposable resources of households since 2004.
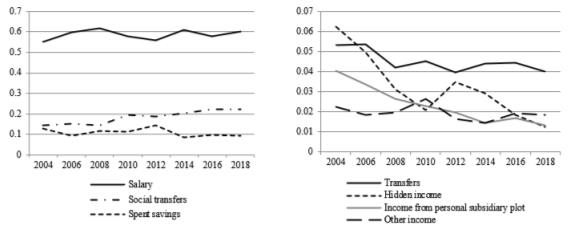
As one can see, more than 60 % of disposable resources of households were wages. The share of social transfers throughout the entire period had been growing steadily and exceeded 22 % by 2018. The spent savings and loans is a difficult component to interpret, since it also includes the so-called turnover cash, meaning not spent in the previous period, and expenses on large purchases. Their share did not fall below 10 %. The share of hidden incomes decreased from 6.2 % in 2004 to 1.3 % in 2018. Accordingly, the share of individuals with hidden incomes had also decreased, i.e. from 21.5 % in 2002 to 9.4 % in 2018. During the study period, the importance of income from personal subsidiary plots had been declining, which during the years of crisis was a significant support for low-income families. The role of inter-family transfers and other sources of informal assistance weakened. Other income, including capital gains, insurance payments, etc., have not become a significant source of growth in living standards over the past time.
The poverty level according to the RLMS data and the definition adopted in the work was close to the official one (Figure 1), but in contrast to it, it did not show a trend in poverty growth after 2014, and for households with hidden incomes, the poverty level was steadily higher (Table 1), which indicates their prevalence among lower-income households.
For better visualization and interpretation of the results of assessing the contribution to poverty of various components of disposable resources, i.e. the transfers, income from household plots and other incomes not exceeding 10 % in total, were combined into a general group, i.e. other incomes. Consider the decomposition of poverty by sources of household income (Figure 3).
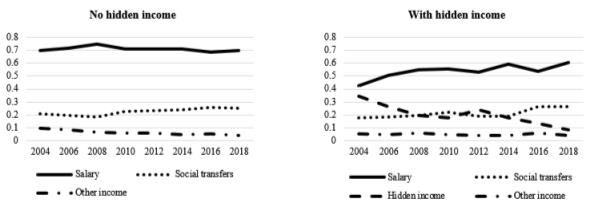
In the analyzed period, wages made the largest contribution (up to 70 %) to the elimination of poverty. The contribution of social transfers during this period increased from 10 to 20 %, while hidden income decreased from 10 to 1 %. The so-called other incomes also mitigated poverty, their contribution ranged from 19 to 13 %.
Given that the number of households with hidden incomes is relatively small, and, in addition, the impact of hidden incomes on poverty elimination will certainly be more significant in households where they are present, it seems appropriate to consider separately two groups of households with hidden income and without it.
As it can be seen from Figure 3, for α = 0 wages made the largest contribution to poverty reduction, regardless of the presence or absence of hidden income, but their presence reduced the contribution of wages to poverty. In households without hidden income, the contribution of wages to poverty elimination grew up until 2008, and then began to decline. At the same time, the role of social transfers in this process began to grow. The importance of other incomes in eliminating poverty remained relatively small and stable.
Contribution of hidden income to poverty among their recipients in the early 2000s was practically equal to the contribution of wages, but then began to decline, and by 2008 it was equal to the contribution to poverty of social transfers. Since 2014, the contribution of hidden income to the elimination of poverty has sharply decreased, which can be explained by the specifics of the current economic crisis, as a result of which the number of sources of informal income has sharply decreased.
The trends in the contributions of various income components to the deficit and poverty severity for α = 1 and α = 2 are similar to those represented by α = 0. However, the contribution of hidden incoms to the deficit and the severity of poverty is more significant. Until 2006, the contribution of hidden income to poverty deficit was almost the same as the contribution of wages, and the contribution of hidden income to poverty was close to the contribution of wages until 2014! Until 2016, the contribution of hidden income to the deficit and poverty severity exceeded the contribution of social transfers, and then equaled them.
Conclusion
The presented results convincingly show that in the structure of incomes of Russian households the predominant source is wages, which play a key role in lifting Russian households out of poverty. Thus, the presence of workers in the family most significantly increases the chances of not falling into poverty. The growing role of social transfers in overcoming poverty is the result of the state’s social policy, which regularly indexes pensions, child benefits and other payments to population with low-income.
As for the role of hidden incomes in overcoming poverty revealed as a result of the analysis, one should take into account the fact that both extremely poor and very rich households are absent in the RLMS data. In addition, the participation in survey is voluntary. Therefore, even if the conditions of representativeness of the sample are met, households whose income is predominantly shadow will not be represented in the data and the presented results may be somewhat underestimated. In general, the revealed share of hidden incomes in all the initial population is small and does not have a significant effect on the reduction of poverty level among all households. However, for those who receive them, it is the next source of income after wages, allowing the household to overcome poverty. The fact that the FGT index values for the component of hidden incomes are close to the values of the index for the component of wages in contributions to the income deficit and especially to the severity of poverty indicates that hidden incomes are the latent mechanism that allows households to overcome the hardships of poverty. The analysis showed that after the 2014 crisis, the sources of hidden income and their volumes sharply decreased, and this became a factor in the growth of poverty.
Currently, the process of extracting hidden household income remains to be obscure and completely hidden from the fiscal authorities and statistical records. Their share in the total volume of disposable resources of households is relatively small, but for those who receive them, they are a “lifeline” that allows them not to drown in poverty. Without challenging the need to withdraw all types of hidden income of the population from the shadows, there is a serious work that needs to be done regarding the establishment of regulatory conditions for their legalization.
Acknowledgments
The reported study was funded by RFBR according to the research project No. 19-010-00009 “Inequality and Poverty in Post-Soviet Russia: Dynamics and Determinants with Adjustments for Hidden Incomes of Households”.
References
Datt, G., & Ravallion, M. (1992). Growth and redistribution components of changes in poverty: A decomposition with application to Brazil and India. Journal of Development Economics, 38, 275–295.
Duclos, J-Y., & Araar, A. (2003). Poverty and Equity: Measurement, Policy and Estimation with DAD. Québec: Université Laval.
Foster, J. E., Greer, J., & Thorbecke, E. (1984). A Class of Decomposable Poverty Indices. Econometrica, 52, 761–766.
Nivorozhkina, L., Arzhenovskiy, S., & Galazova, S. (2020). Estimation of Undisclosed Household Earnings Based on the Pissarides-Weber Model Modification. International Journal of Economics and Business Administration, VIII(4), 635–646.
Nivorozhkina, L. I. (2020). Hidden incomes of Russian households: who do they have? University news. North-Caucasian region. Social sciences series, 3, 91–98.
Pissarides, C., & Weber, G. (1989). An Expenditure-Based Estimate of Britain’s Black Economy. Journal of Public Economics, 39, 17–32.
Ravallion, M. (1992). Poverty Comparisons: A Guide to Concepts and Methods. LSMS Working paper, 88. World Bank.
Shapley, L. (1953). A value for n-person games. In: H.W. Kuhn and A.W. Tucker (ed.), Contributions to the Theory of Games, Annals of Mathematics Studies (Vol. 2, pp. 303–317). Princeton University Press.
Shorrocks, A. F. (1999). Decomposition procedures for distributional analysis: A unified framework based on the Shapley value. University of Essex.
Copyright information

This work is licensed under a Creative Commons Attribution-NonCommercial-NoDerivatives 4.0 International License.
About this article
Publication Date
29 November 2021
Article Doi
eBook ISBN
978-1-80296-116-4
Publisher
European Publisher
Volume
117
Print ISBN (optional)
-
Edition Number
1st Edition
Pages
1-2730
Subjects
Cultural development, technological development, socio-political transformations, globalization
Cite this article as:
Nivorozhkina, L. I., Arzhenovskiy, S. V., & Tregubova, A. A. (2021). Poverty In Post-Soviet Russia: Development Dynamics By Household Income Source. In D. K. Bataev, S. A. Gapurov, A. D. Osmaev, V. K. Akaev, L. M. Idigova, M. R. Ovhadov, A. R. Salgiriev, & M. M. Betilmerzaeva (Eds.), Social and Cultural Transformations in The Context of Modern Globalism, vol 117. European Proceedings of Social and Behavioural Sciences (pp. 1168-1175). European Publisher. https://doi.org/10.15405/epsbs.2021.11.155