
Modeling Of Regions Sustainable Development Based On Digital Technologies


Abstract
The authors examine the concept of sustainable development as the basis for improving the activities efficiency and quality in the regions of Russia. Sustainable development today requires innovative tools and techniques to ensure successful implementation. The purpose of this study is to formulate recommendations for achieving optimal level of sustainable development for regions on the basis of multiparametric models of sustainable development, built using mathematical modeling methods, using neural networks and the quality tensor. On the basis of these methods, it is proposed to solve problem of multi-criteria assessment of development and finding balanced indicators of various areas. Analysis of regions sustainable development components on the basis of mathematical modeling with the use of digital technologies contributes to finding optimal solutions for quality formation of regions sustainable development. In the study, based on the established list of key statistical indicators of sustainable development of regions, a cluster analysis was carried out, the results of which were economic clusters identification and analysis. Regression analysis was carried out according to the average indicators of regional clusters, which established the most significant connections. An approach to finding the quality tensor of regions sustainable development based on artificial intelligence methods using neural network programming is presented.
Keywords: Sustainable development, regions, mathematical modeling, quality tensor
Introduction
The introduction of sustainable development concept will contribute to solving problems of negative impact on the environment and creating more favourable conditions for human life. The concept was created against the backdrop of global environmental and social problems and growing social injustice. Sustainable development is development in which the needs of the current generation are met without detriment to the ability of future generations to meet their own needs (Ivolga, 2014).
Sustainable consumption and production aim to improve efficiency and quality, but with fewer resources and costs (Birkeland, 2012). The concept also aims to overcome the direct link between economic growth and environmental deterioration, improve resource efficiency and promote more sustainable lifestyles. In addition, introducing the concept of sustainable development into production and psychology of consumption can make a significant contribution to poverty reduction and transition to low-carbon and green economy (Azimina & Suchkova, 2020).
Sustainable development in Russia can only be realized through sustainable development of regions due to their diversity and wide territorial coverage. Regions’ sustainable development management is aimed at ensuring a balance of economic, social and environmental aspects of regional development, meeting the needs of population in the region and providing these opportunities for future generations (Podprugin, 2012). Sustainable development plays an important role in improving existing systems and requires formation of effective tools for successful implementation and use of innovative methods for determining ways for further development (Belobragin et al., 2020).
Problems of society sustainable development have not yet been resolved, and there is also no methodology for assessing and forming the optimal level of sustainable development. This also applies to the regions whose development is of greatest importance.
Problem Statement
The problem is that sustainable development components are characterized by many interdependent indicators, which raises questions of such development. The difficulty in identifying complex socio-economic objects, including regions, lies in their diversity, including a large number of indicators in various fields of activity: economic, social, environmental, as well as in stochastic nature of its formation (Govorova, 2019b). The above raises the problem of using information technologies to identify a complex level of quality and its further improvement.
There are also problems connected with the fact, that many indicators have a multidirectional nature of interinfluence. For example, environmental performance rapidly improves if production is reduced; social indicators depend, on the one hand, on the profit received, and on the other, they reduce profits and, accordingly, investments in the economy fixed capital by the amount of funds for social events and other similar dependencies (Gorbashko et al., 2019; Leonova et al., 2020). Therefore, it is required to find the optimal components balance, that can be done on the basis of assessment, analysis of relationship between indicators and finding optimal solution.
Research Questions
The research questions are multicriteria analysis of regions that introduce sustainable development on the basis of mathematical modeling using digital technologies, including cluster, regression methods, neural network programming to find optimal solutions in sustainable development formation, including finding a quality tensor of sustainable development.
There are some studies in the scientific literature on the use of neural networks (Belikova, 2018). At the same time, methodological recommendations for the practical application of neural networks to optimize the quality of regions sustainable development in the context of digitalization are still not enough. We need a new mathematical model for digitalization of the multi-parameter quality criterion, which would correspond to modern ideas about the surrounding reality.
Purpose of the Study
To form multi-parameter models of regions sustainable development, to determine the range of input and output indicators of regions sustainable development, to select and apply methods of mathematical modeling, to formulate on its basis recommendations for achieving an optimal level of regions sustainable development through the use of neural network programming and a quality tensor formation.
Research Methods
It is appropriate to assess sustainable development of regions on the basis of indicators characterizing the subject. The main indicators of the quality of sustainable development determine the degree of achievement of sustainable development criteria for stakeholders’ satisfaction (Govorova, 2019a). The indicators should cover different aspects of the region's performance; should not duplicate each other; should be officially published by government agencies to increase reliability and accuracy of conclusions; have a quantitative characteristic. In order to determine the list of influencing and defining indicators, it is necessary to identify interrelated indicators and determine the criteria for their selection.
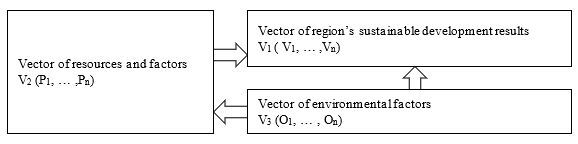
The analysis of cause-effect relation allows us to build a fundamental model for formation of indicators of regions sustainable development which is shown in Figure 1.
Based on a literature review and our own research, we formed a list of indicators of region’s sustainable development results in three areas of sustainable development: economic, social, environmental components, reflected in the reporting of Russian Federal State Statistics Service (Table 1).
For complex multivariate analysis of indicators, you can apply cluster analysis. Mathematical cluster analysis in statistics is a complex of classification methods according to several parameters at the same time, as a result of which clusters, or groups of similar objects, are formed. When conducting mathematical cluster analysis, the Ward's method can be most objectively used, that uses methods of variance analysis to estimate distances between clusters. Also, the analysis used the Euclidean distance – geometric distance in multidimensional space.
It is assumed that regions can be classified and combined using mathematical cluster analysis. Cluster analysis is an effective assessment tool in the presence of many indicators. Assessment of sustainable development of regions is based on clusters for taking into account the subjects specifics and competitive growth. The study assessed the quality of sustainable development of the region through formation of regional clusters, i.e. using cluster analysis.
The cluster analysis was carried out on the indicators of 85 regions of Russia in 2019. The statistical study was carried out in the IBM SPSS Statistics 26 software package. The dendrogram of the resulting clusters is shown in Figure 2.
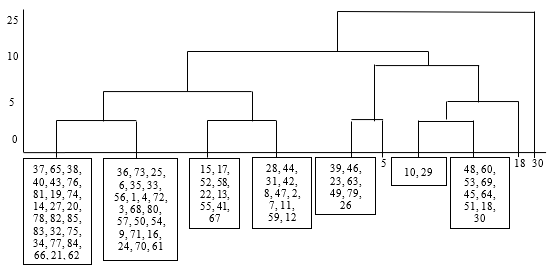
The abscissa shows the numbers of regions, and the ordinate shows the distance between clusters as a percentage of the maximum possible distance in the studied group. At the first stage, each region is a separate cluster, the distances between the objects are determined by the Euclidean distance. Thus, the minimum distance is the one at which the first merge occurred. Figure 2 shows that none of the clusters included regions numbered 30 – Republic of Adygea (Adygea), 5 – Ivanovo region and 18 – City of Moscow (city of federal status). For a more complete and detailed analysis of the obtained clusters, these regions should not be included in any of the selected clusters. They should be assessed separately.
In order to explanate the results obtained and determine the clusters characteristics, the average values of the variables were determined for each cluster.
Cluster 1 is distinguished by controversial results in the economic sphere, since it occupies either a leading position or, on the contrary, lagging behind. But the lag is mostly so striking that we can come to the conclusion that the economic sphere in cluster 1 is at a low level. The social sphere also shows bad results. But in ecological development, on the contrary, we can observe positive and moderate development. Cluster 2 almost always takes the middle position in all areas, but has positive results in the mining operation, but negative results in natural growth, mortality, pollutant emission and freshwater use. Cluster 3 is distinguished by positive results in the economic and environmental spheres, but sharply negative results in social development in almost all indicators, except for the population with monetary incomes below the subsistence level and the number of crimes. Cluster 4 is distinguished by negative results in the economic and social spheres, but positive in the environmental ones. Cluster 5 is distinguished by moderate development in all areas – there are single leading and lagging indicators. Cluster 6 is a strong leader in the economic and social spheres, but indicators of freshwater use and especially discharge of contaminated wastewater remain problematic. Cluster 7 is distinguished by positive results in the economy in the production sphere, but probably because of this there are problems with the environment, namely with the pollutant emission, the social sphere shows negative results in terms of the number of crimes, morbidity and natural increase.
As a result of the indicators assessment, it can be concluded that among all the clusters presented, cluster 6 can be called as the most leading, and cluster 4 as the most lagging behind. Clusters 1 and 3 are quite problematic in certain areas, while clusters 2, 5 and 7 can be called moderately stable. Summing up, we note that the use of cluster analysis is extremely useful in assessing the quality of regions sustainable development in the short term, since this will allow us to analyze the influence of individual factors on the balanced region development, as well as assess possible consequences of changes in indicators in the future.
Also, the cluster analysis made it possible to build a number of regression models illustrating the interdependence of averaged indicators for each of the seven identified clusters. To do this, you first need to build a matrix of pairwise correlations between all the considered indicators of the clusters. Next, select indicators that have the strongest relationship with other indicators and do not correlate with other indicators in order to take into account multicollinearity. As a result, based on the correlation analysis, a number of such interesting regression equations were obtained (indicators designations are made in accordance with Table 1):
Х1 = 155573.3*Х4+1.5*Х5+69458.3 (1)
t-statistics х4 = 4.4, t-statistics х5 = 3.5, R-square = 0.987, F statistics = 149.2.
Х15 = 1.565*Х2 + 5.096 (2)
t-statistics = 4.9, R-square = 0.826, F statistics = 23.8.
Х18= 57.5*Х15 + 589.3 (3)
t-statistics = 4.3, R-square = 0.787, F statistics = 18.4.
Х20= 0.00000274*Х7+5.382 (4)
t-statistics = 28.7, R-square = 0.994, F statistics = 823.3.
Х21=6.043*Х6+ +0.124*Х24+ +79.32 (5)
t-statistics х6 = 2.2, t-statistics х24 = 6.9, R-square = 0.964, F statistics = 53.8.
(6)
t-statistics = 9.3, R-square = 0.945, F statistics = 85.5.
The statistical characteristics of the regressions calculated in the software package IBM SPSS Statistics 26 show high reliability of the models.
The conclusions of such studies were the identification of significant dependencies such as: gross regional income per capita (X1) from fixed assets and investments; the population number with monetary incomes below the subsistence minimum (X15) from the unemployment rate; the crime rate (X18) of the population with monetary incomes below the subsistence level; graduation of mid-level specialists, bachelors, specialists, masters (X20) from the growth of manufacturing industries; the volume of recycled and consistently used water (X21) and the average from the extraction of minerals; discharge of contaminated wastewater (X25) from the growth of processing industries.
At the same time, the above cluster analysis does not allow for a quantitative analysis of certain factors influence on the main criterion of the regions’ sustainable development quality due to the variety of parameters that determine it, as well as due to the fact that they are latent and correlate with each other. Therefore, the data should be presented as a tensor of a multidimensional space. In this case, when applying formalized mathematical procedures, it can be optimized, i.e. as a result of the multicriteria analysis, it is possible to find such a ratio of the input variables that will maximize the value of the sustainable development quality tensor.
Taking into account that the components of the quality tensor are usually positive values and assuming their significant influence on the final criterion of sustainable development quality, based on the Perron theorem that for positive matrices there is a single characteristic number with the largest absolute value, which can be chosen as an indicator of the quality tensor optimality, which has the greatest value of its own. Calculation of the main eigenvector W of the positive matrix || y || is carried out on the basis of the following equality:
УW=λmaxW (7)
where λmax is the maximum eigenvalue of the matrix ||y| obtained from the formula (8):
λmax= eT||y||W (8)
To determine the components of the quality tensor, it is most effective to construct regression dependencies using the construction of neural networks and their training according to the scheme “with a teacher” (Belikova, 2018; Vinogradov et al., 2019). With the help of regression analysis, the dependences of the components characterizing the resulting quality of sustainable development of the economic, social and environmental components on the regional resources’ indicators and the indicators of the external environment are found, according to which the corresponding tensor will be formed. In the course of its creation, linear neural networks with a specific architecture should be created and trained (Vinogradov, 2017).
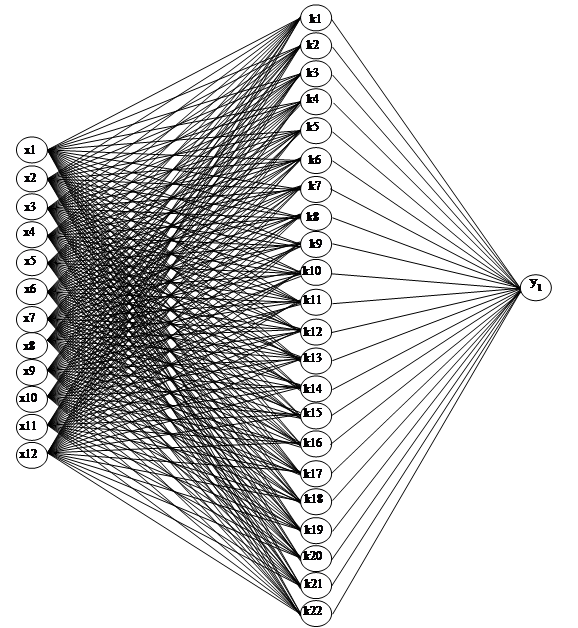
In this case, the following settings were set: network type – multilayer perceptron (MLP); the minimum number of hidden neurons in the network is 10; the maximum number of hidden neurons in the network is 30; the number of networks for training is 200; the number of networks to save is 5. In the study, it is important to isolate a block of output (dependent) variables from the general data array and combine them into a tensor. And also set the input variables as independent, in this case there are 12 indicators of resource and external factors. Next, you need to build regression neural networks for each output variable. A neural network of the MPL 12-22-1 type for one of the output variables is shown in Figure 3.

A sensitivity analysis of all variables should be performed to show the importance of all factors. The constructed neural networks have high performance and a low errors percentage for all three samples: training, test, and control. The performance values are close to one, which indicates a high approximation of the data to the real values of the process. The use of regression dependences of the obtained mathematical model makes it possible to predict the components values of the economic development quality tensor with a high degree of probability.
The presented approach can form the basis for the study of constructing the quality tensor of regions sustainable development based on the official data of the Russian Federal State Statistics Service, as a new task formulation based on modern digital technologies. At the same time, such work usually takes quite a long time (several months), which will be carried out in the future by this group of researchers. The analysis of the change in the values of the characteristic numbers corresponding to the quality tensors of sustainable development, carried out in the course of the planned numerical experiment with the constructed mathematical model, made it possible to identify a set of input variables that optimize the value of the objective function.
Findings
The following results were obtained:
- The composition of 25 key statistical indicators of regions sustainable development was formed, the value of which is reflected in the official reports of the Russian Federal State Statistics Service, which will allow the use of reliable data in the process of mathematical modeling;
- As a result of cluster analysis application, seven economic clusters were identified, that it is possible to develop recommendations for improvement for; the regression analysis of the averaged indicators dependence over the clusters was presented, which makes it possible to establish the most significant dependencies and to regulate such indicators;
- The authors formulated the problem of finding the quality tensor of regions sustainable development based on modern methods of using artificial intelligence in the form of neural network programming.
Conclusion
The presented approach to the mathematical modeling use is important for the socio-economic development of regions, as it allows finding ways to achieve a balanced level of economic growth, social justice and environmental conditions in the regions.
In the detailed research process, the use of methods with classification, clustering and regression analysis is possible.
However, especially promising seem to be the approaches using neural networks construction, in which interrelated factors and the degree of their influence on each other and on the final result can be identified, which makes it possible to optimize the quality of sustainable development through the most optimal selection of values of controlled input parameters under constantly changing environmental conditions. In this case, it is possible to carry out further training of neural networks based on new data covering the largest number of possible situations. The task of further research is to build a general methodology that would allow to construct the quality tensor of regions sustainable development and determine the parameters that ensure it, using artificial intelligence technologies based on neural networks.
References
Azimina, E. V., & Suchkova, M. Yu. (2020). Transition to the concept of sustainable development: resolving global contradiction at the micro level. Collect. of thesis of the nat. sc.-pract. conf. with internat. participation: National concept of quality: management training; under. ed. Dr. econ. Sciences, prof. E.A. Gorbashko, 8-14.
Belikova, K. (2018). Teaching a neural network with a teacher, without a teacher, with reinforcement – what is the difference? Which algorithm is better? Neurihive – Neural networks. https://neurohive.io/ru/osnovy-data-science/obuchenie-s-uchitelem-bez-uchitelja-s-podkrepleniem/ date of the application
Belobragin, V. Ya., Salimova, T. A., & Biryukova, L. I. (2020). Standardization in achieving the UN Sustainable Development Goals. Collect. of thesis of the nat. sc.-pract. conf. with internat. participation: National concept of quality: management training; under. ed. Dr. econ. Sciences, prof. E.A. Gorbashko, 15-27.
Birkeland, J. (2012). Design blindness in sustainable development: from closed to open systems design thinking. Journal of Urban Design, 17(2), 163-187.
Gorbashko, E. A., Titova, A. V., & Vershinina, Yu. V. (2019). From ecology to sustainable production and consumption models. Standards and quality, 1, 46-51.
Govorova, N. V. (2019a). The quality of economic growth in the context of the UN Sustainable Development Goals. Standards and quality, 7, 70-73.
Govorova, N. V. (2019b). Labor productivity and stable employment as tools for sustainable development. Standards and quality, 11, 30-34.
Ivolga, A. V. (2014). Substantiation of the approach to the concept of sustainable development of the regional economy. Bioresources and nature management, 1-2, 151-154.
Leonova, T. I., Burylov, V. S., & Mozaleva, N. I. (2020). Optimization of the strategy of society sustainable development. Sustainable development of economies: collect. of sc. papers, ed. Dr. econ. Sciences, prof. E.A. Gorbashko, Dr. econ Sciences, prof. V.Ya. Belobragin. – SPb, 159-167.
Podprugin, M. O. (2012). Sustainable development of the region: concept, main approaches and factors. Russian entrepreneurship, 24, 214-221.
Russian Federal State Statistics Service. (2021). https://rosstat.gov.ru/folder/210 date of the application
Vinogradov, L. V. (2017). Application of mathematical modeling in quality management processes. Collect. of thesis of the nat. sc.-pract. conf.: National concept of quality: state and public protection of consumer rights; under. ed. E.A. Gorbashko, 55-57.
Vinogradov, L. V., Zhukova, A. G., & Burylov, V. S. (2019). Modeling the process of drinking water purification using artificial neural networks. Collect. of thesis of the nat. sc.-pract. conf.: National concept of quality: state and public protection of consumer rights; under. ed. E.A. Gorbashko, 140-143.
Copyright information

This work is licensed under a Creative Commons Attribution-NonCommercial-NoDerivatives 4.0 International License.
About this article
Publication Date
25 September 2021
Article Doi
eBook ISBN
978-1-80296-115-7
Publisher
European Publisher
Volume
116
Print ISBN (optional)
-
Edition Number
1st Edition
Pages
1-2895
Subjects
Economics, social trends, sustainability, modern society, behavioural sciences, education
Cite this article as:
Leonova, T., Vinogradov, L., Burylov, V., & Mozaleva, N. (2021). Modeling Of Regions Sustainable Development Based On Digital Technologies. In I. V. Kovalev, A. A. Voroshilova, & A. S. Budagov (Eds.), Economic and Social Trends for Sustainability of Modern Society (ICEST-II 2021), vol 116. European Proceedings of Social and Behavioural Sciences (pp. 707-716). European Publisher. https://doi.org/10.15405/epsbs.2021.09.02.79