
The Population Health And The Environment Quality: Construction Of Mathematical Assessments


Abstract
The article presents the research results of the health level analysis and of the quality environment in the region social and economic system. The construction of mathematical assessments of the health level and the environment quality is carried out using of the Udmurt Republic’s statistical data for the period 2000-2020. The results of the analysis indicate a decline share of healthy people from 61.6% in 2000 to 54.3% in 2020. But the share of people with chronic diseases increased from 33.2% to 39.8%, the share of people with disabilities in the total population – from 5.3% to 5.9%. The general level of population health has declining at an average annual rate of 0.3 percentage points. To assess the environment quality, a mathematical model is proposed, considering the effectiveness of environmental protection measures. It is found that the average rate of environmental pollution of atmospheric air is 0.64%, water resources – 0.73%, land resources – 0.31%. Over the 25-year period under research, the share of the environment in need of treatment has grown from 50.3% to 56.3%. It is identified that the healthy population of the region directly depends on clean ecology (94.4%). Obviously, the population with health problems (general morbidity, chronic diseases, disability) shows an inverse relationship with the indicator of clean ecology. Thus, the general morbidity of the population depends on the poor environment quality by 95.8%, chronic morbidity – by 90.8%, disability to a lesser extent – by 83.7%.
Keywords: Mathematical modeling, population health level, environmental factor, environmental protection
Introduction
Now the human capital quality is an important factor in ensuring a stable socio-economic state of regional systems. The quality of a region’s human capital is an integrated characteristic of health, intelligence, knowledge, and culture of its population. Dubiei (2021) and Amanova et al. (2017) consider that in the context of rapidly changing technologies, with the development of the components of an innovative economy, it is the quality of human capital that influences the formation of positive dynamics of social progress.
Since human capital is a leading factor in scientific, technical and socio-educational progress, it makes necessary to take it into account when building strategies for optimal management of regional economic systems. The ranking of the factors determining the rate of this progress in the current conditions is presented, for example, in papers: Morozov (2017), Ketova et al. (2020), Rusyak et al. (2020).
In terms of the influence degree on the economy, the most important components of human capital are health, education and culture. In this research, we study the population health level of the socio-economic system. Bickler et al. (2020) and Cramer et al. (2021) suggest that the state needs to allocate funds and plan financial strategies to improve the health of the population, since investments in health care development reduce the levels of morbidity and mortality and extend the working life period (this research results of Seixas et al. (2021) and Yang et al. (2020)). It, ultimately, according to Ketova (2007), increases the potential of labor resources and reduces economic losses from demographic losses.
A considerable factor influencing the population health level is the environmental factor. Considerable attention is currently being paid to the study of environmental problems: Mcinnes and Roemer-Mahler (2017), Huang (2018), Fan et al. (2020). The people activities of the last century have contributed to the deterioration of the natural environment state. As a result of this activity, the natural ecological balances of the biosphere are disrupted; atmospheric air, water resources and land resources are polluted. It leads to the depletion of all living organisms. It is possible to prevent an ecological catastrophe if the principle of respect for the environment is implemented. In this regard, in order to preserve natural resources and a clean environment, the issue of building and implementing the concept of environmentally oriented progress, as presented in the article of Gasanov et al. (2017) and article of Fedulova et al. (2017), implemented at the international level, is relevant.
Along with the production and human factor, in the current situation, the environmental factor is also one of the main conditions for economic development. From this it follows that investments in environmental protection are becoming important sources of economic dynamics. This is also stated in study of Maher et al. (2020) and research of Danilova et al. (2020).
Problem Statement
The health condition determines the capabilities of a person during labor activity and the degree of his participation in it. Obviously, the good health of the population is of obvious importance for the progressive development of society, for stimulating educational progress and, as a result, scientific and technological progress. In this work, we consider issues related to the dynamics analysis of the population health level and the ecological factor as the environment quality.
To assess the quality of the environmental protection policy, the relevance of the mathematical assessment of the effectiveness of environmental protection measures is obvious, as well as the issues of studying and modeling the environmental factor are relevant. Solving these issues allow us to compare the ecological situation in time and space more effectively by using mathematical methods.
Research Questions
It is required to determine whether the ecological conditions affect the health level of the population in the socio-economic system. If it does, then how strong is this influence and what ways can be used to reduce the negative impact of the deteriorating environmental situation on the population health. Numerical calculations are carried out on the social and economic system of the Udmurt Republic (one of the middle regions in the Russian Federation).
Purpose of the Study
Purpose of our research is analysis of the population health level and the environment quality in the regional system, as well as the study of the relationship between these two indicators of living conditions of the population.
Research Methods
The population health level assessment. Analysis of statistical material
We solve the problem of assessing the population health level on the example of the Udmurt Republic (UR). In accordance with the division of the population by health condition, we examine the statistical information provided on the official statistical sites of the Russian Federation. We use the methods of statistical processing of the official information available to the researcher.
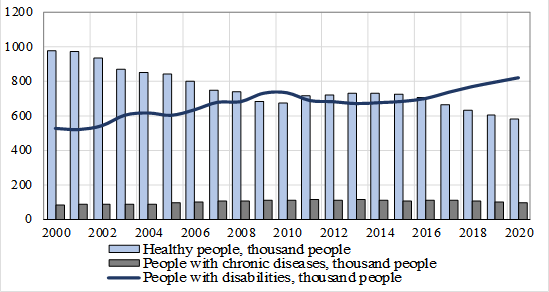
Figure 1 shows the region’s population dynamics for the period 2000-2020.
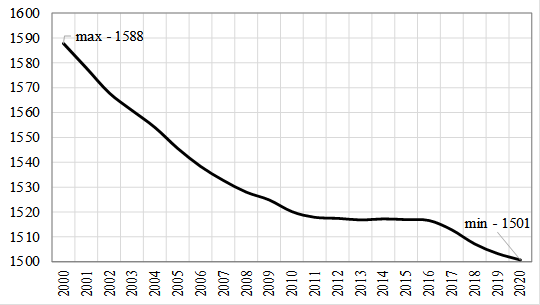
Figure 2 presents statistical data on the general and primary morbidity per 1000 people of the UR’s population for the period 2000-2020.
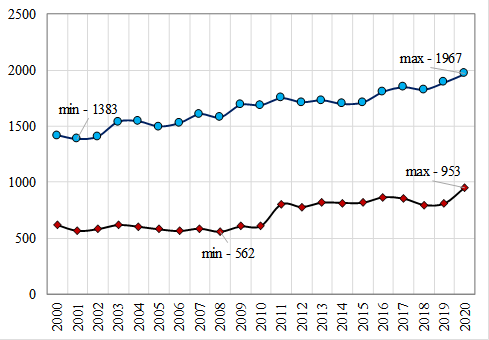
According to the medical classification, the primary morbidity is a set of newly emerging diseases that have not been accounted for anywhere and for the first time in a given year among the population (relapses of chronic diseases that occur during the year are not taken into account); the total morbidity is the sum of primary diseases and diseases accumulated in previous years, i.e. known in advance. Thus, the total morbidity characterizes the total number of existing diseases among the population of a given territory during a certain period of time.
The general morbidity of the UR’s population for the period 2000-2020 increased by 38.8% and amounted to 1967 diseases per 1000 people. For the entire regional system, in terms of the total population, the incidence changed from a value of 2250.8 to a value of 2952.5 thousand diseases.
The primary morbidity of the UR’s population for the period 2000-2020 increased by 53.2% (compared to the beginning of the studied period in 2000) and amounted to 953 diseases per 1000 people. For the entire socio-economic system of the region, in terms of the entire population, the primary incidence rate changed from 987.3 to 1430.4 thousand diseases.
Since the general morbidity is the sum of primary and existing diseases, then, consequently, the increase in the total morbidity of the UR’s population for the period 2000-2020 is conditioned by the presence of newly diagnosed diseases. This situation is partly due to the introduction in the Russian Federation since 2011 of regular medical examinations, which significantly increased the detection rate of primary diseases among the population.
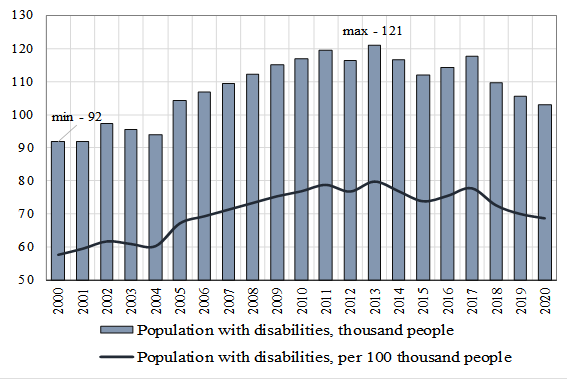
For health condition, the population of the regional socio-economic system is grouped as follows: a healthy individual; having chronic diseases; having a disability. Figure 3 shows the dynamics of people with disabilities (the graph is based on statistical data), as well as the calculated values of people with disabilities per 100,000 people of the UR for the period 2000-2020.
The population with disabilities in the region increased from 92.0 to 103.2 thousand people for the period 2000-2020, the growth rate is 12.2%. People with disabilities (per 100 thousand of the population) in the region grown up from 57.8‰ to 68.7‰ (for comparison, in 2020 it is 75.1‰ for the Russian Federation).
The group of people with disabilities is also characterized by an internal division according to the degree of disability. The third group of disability presupposes a person's ability to work; the second group is established when a person is partially capable of labor activity; the first group of disability occurs when a person is completely incapable of work.
The change in the internal structure of the studied population category in the UR according to the disability degree is shown in Figure 4.
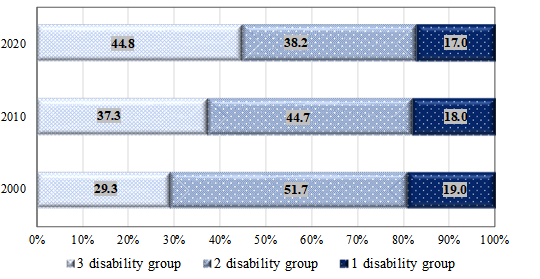
Redistribution takes place between groups. The proportion of people able to work is increasing. Over the period 2000-2020, the increase in people able to work is 2 percentage points.
The assessment of the environmental quality and the effectiveness of environmental protection measures
We construct a model of the environmental factor dynamics and the effectiveness of environmental protection measures using the methods of economic and mathematical modelling. As noted in the introduction, an important factor influencing the population health level is the environmental factor. As a result of human activity, the natural environment changes: atmospheric air, water resources and land resources are polluted. The environment is a collection of three types of resources: atmospheric air, water and soil. Therefore, the ecological factor reflects the change in all three explicit components of the environmental components (implicit, that is, indirect objects of the influence of human life are, in particular, living organisms). The values of the environmental factor is measured as a percentage, calculated as a part of the unpolluted natural resource in its total volume. We also introduce the concept of a measure of environmental pollution, which determines the degree of deterioration of the environmental factor. We divide the environmental factor by type of costs aimed at environmental protection and rational using of natural resources: investments protecting atmospheric air, water resources and land resources. The total value of the environmental factor is defined as a linear combination: (1)
(2)
In formulas (1) and (2) is the share of the corresponding terms in the total volume factor; index i=1 defines atmospheric air, i=2 – water resources, i=3– land resources.
The dynamics of the i-th component of the environmental factor is determined by an ordinary differential equation of the first order:
(3)
In formulas (3) is the sum of the costs of carrying out clean-up measures and environmental protection for the i-th component of the environmental factor; the coefficient of conversion of the costs expressed in monetary units into units of measurement of the environmental factor; -the intensity of pollution i-th component of the environmental factor.
The initial condition of the i-th environmental factor component at has the form:
, (4)
where -the value known from the statistical data.
The dynamics equation (3) with the initial data (4) is a Cauchy problem. The solution is carried out by a numerical three-stage Runge-Kutta method of 3 orders. For the variable t we introduce a difference grid with a step h and consider the set of points Then the calculation formulas take the form:
(5)
The effectiveness of environmental protection measures (indicate it ) it directly affects the value of the environmental factor . We analyze this indicator. The effectiveness of environmental protection measures is inversely proportional to the intensity of environmental pollution with a certain coefficient a. Then, for the i-th resource, has the relation:
. (7)
We determine the intensity of environmental pollution by expressing it from the formula (3):
(8)
We determine the coefficient of conversion k of the amount of costs for environmental protection measures expressed in monetary units into units of measurement of the environmental factor. To do this, we calculate the ratio of the volume of the cleared resource U of the i-th type to the current cost of protecting this resourceZ, the index j sets the time period, year:
. (9)
Next, it should calculate the values of the coefficients of the conversion of the environmental factor components into monetary terms, as the ratio of the average value for the period to the known values of the total volume of these resources.
Findings
Results of the structural and dynamic analysis of the population health level in the region
As noted above, according to the health condition, the population of the regional socio-economic system are grouped as follows: a healthy individual; having chronic diseases; having a disability. The total population of the region denote as P; the healthy people is ; the people with chronic diseases is ; the disabled people is . Based on the data presented in the graphs of Figures 1-3, the number of healthy population per year can be determined by the formula:
. (10)
As a result, the distribution of healthy people from the working-age group in the UR region for the period 2000-2020 is obtained, the graph of which is shown in Figure 5.
The graph has a wave-like character, since the health level is related to the age characteristics of the population, which change in a wave-like manner (see Figure 6).
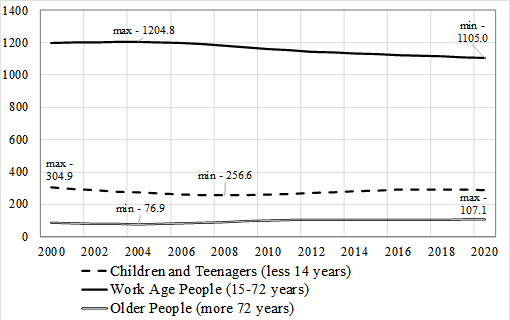
Figure 7 shows the changes diagram in the population health level of the UR in the division into three groups (healthy people, people with chronic diseases and people with disabilities).
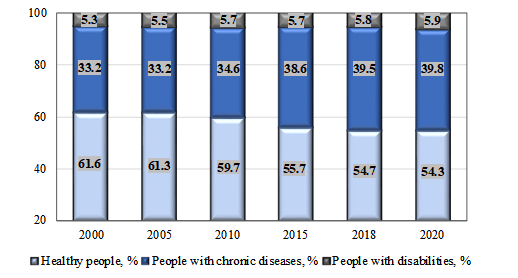
As a result of the structural-dynamic analysis of the population health level of the Udmurt Republic for the period 2000-2020, it is found that the share of healthy people decreased from 61.6% in 2000 to 54.3% in 2020 (the overall rate of decline for the period is 11.8%, the annual rate is 0.6%); the share of people with chronic diseases increased: 33.2% in 2000 to 39.8% in 2020 (the overall growth rate for the period is 19.9%, the annual growth rate is 0.9%).
Numerical results of assessment the effectiveness of environmental protection measures in the region
The value of the environmental factor directly depends on the effectiveness of environmental protection measures. Dynamics of the environmental factor in three components (atmospheric air, water resources and land resources) for the UR for the period 1996-2020 are presented in Figure 8. Figure 9 shows the environmental factor dynamics by three components as the dynamics of the annual rates of environmental pollution in the region.
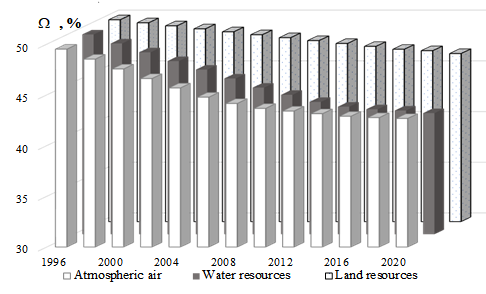
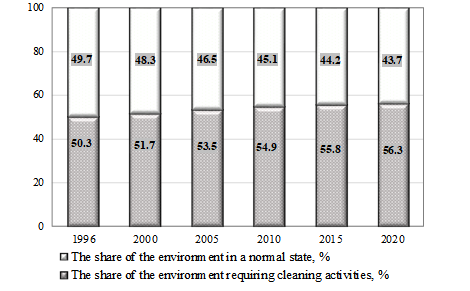
As a result of calculations, it is found that the average annual rate of pollution in the UR of atmospheric air is 0.64%, water resources – 0.73%, land resources – 0.31% (Figure 8). The annual share of the environment, which requires the using of cleaning measures, on average for the period 1996-2020 for UR is 53.9%. Over the 25-year period under study, the share of the environment in need of treatment has increased from 50.3% to 56.3% (Figure 9). The most intense pollution is the atmosphere and the water. The soil is polluted less intensively, but, nevertheless, production and economic activities cause significant damage to nature, given the cumulative nature of this phenomenon.
The calculated dynamics of the environmental factor shows that the rate of pollution has decreased. This is due to the strengthening of measures aimed at combating environmental pollution in the last decade.
We determine the coefficient of conversion k of the value, expressed in monetary units, into the amount of refined resources. First, we calculate in accordance with formula (9) the average for the period 1996-2020 the value of the coefficient for each resource. For the calculation, we use information on the annual indicators of pollution and purification of atmospheric air, water and land resources of the UR for the period 1996-2020 and information on the current costs of environmental protection of the UR for the period 1996-2020 (in the calculations, the current financial costs for the possibility of comparing the obtained results were adjusted to 2020 prices). Average value of the coefficient for each resource:
Further, the values of the coefficients for converting the components of the environmental factor into monetary terms are calculated, as a ratio to the known values of the total volume of these resources. Received the following values:
For the period under study, 1996-2020, according to the UR, there are calculated values obtained in accordance with formula (8), the values of the intensity of pollution for atmospheric air is , pollution intensity for water resources is and for land resources is .
Based on the values of the annual indicators of pollution and purification of atmospheric air, water and land resources of the UR for the period 1996-2020 and calculations of the intensity of environmental pollution, the values of the proportionality coefficients for the corresponding resources are obtained:
Thus, the estimated efficiency of environmental protection measures, determined by formula (7), for atmospheric air is about 25.0%, for water resources is 47.5%, for land resources is 38.0%.
Numerical results of assessment the relationship between the environment quality and the population health level
We consider aspects related to the assessment of the relationship between the environmental factor and the population health level of the social and economic system on the example of the UR. For this, we use the preliminary results presented in this work. We analyze the data shown in the diagrams in Figure 7 and Figure 8.
Let’s study the correlations between the dynamics of the percentage of the environment that does not need cleaning measures and the dynamics of the percentage of different population groups in the region in terms of their health status.
Table 1 shows the correlation coefficients calculated in accordance with the formula:
(11)
Where -covariance between indicators and ; -standard deviation.
All correlation coefficients have values close to . The significance level of the obtained coefficients is 99%.
So, the healthy population in the region directly depends on a clean ecology (94.4%). Obviously, the number of groups of people with health problems (general morbidity, chronic diseases, disability) shows an inverse relationship with the indicator of “clean” ecology. Thus, the general morbidity of the population depends on the poor quality of the environment by 95.8%, chronic morbidity – by 90.8%, disability to a lesser extent – by 83.7%.
The results of the correlation analysis, obtained when assessing the relationship between the population health level and the environment quality, taking into account the distribution of the population by age (dynamics of some age groups is shown in Figure 6), are presented in Table 2.
The results of this analysis are showed that environmental pollution has a negative effect on the health of all age groups; nevertheless, there is some cumulative effect, since the correlation coefficients slightly increase as a person grows up.
Conclusion
Thus, the question of construction mathematical estimates of the dynamics and degree of interconnection and the environment quality and the health level of the population is studied. The calculations are carried out using the example of the Udmurt Republic based on primary statistical data. The period for assessments the health level of the region’s population is 20 years: from 2000 to 2020. The period for assessments the ecological state of the region is from 1996 to 2020. This is due to the availability of up-to-date official statistical data in the public domain, as well as the need to study the cumulative effect of the negative impact of poor environmental quality on human health.
During the period under review, the population health level of the Udmurt Republic has been declining. As a result of the structural-dynamic analysis of the population health level of the region for the period 2000-2020, it is found that the proportion of healthy people decreased from 61.6% in 2000 to 54.3% in 2020 (the overall rate of decline for the period is 11.8%, the annual rate is 0.6%); the proportion of people with chronic diseases increased: 33.2% in 2000 to 39.8% in 2020 (the overall growth rate for the period is 19.9%, the annual growth rate is 0.9%).
For the ecological factor, as a result of calculations, it is obtained that the average annual rate of pollution in the Udmurt Republic of atmospheric air – 0.64%, water resources – 0.73%, land resources – 0.31% The annual rate of the environment that needs cleaning measures, on average for the period 1996-2020 years for the region is 53.9%. Over the 25-year period under study, the share of the environment in need of treatment has increased from 50.3% to 56.3%.
It is found that the healthy population of the region directly depends on clean ecology (94.4%). Obviously, the number of groups of people with health problems (general morbidity, chronic diseases, disability) shows an inverse relationship with the indicator of “clean” ecology. Thus, the general morbidity of the population depends on the poor quality of the environment by 95.8%, chronic morbidity – by 90.8%, disability to a lesser extent – by 83.7%.
References
Amanova, G., Turysbekova, G., Tazhibayeva, R., Izatullaeva, B., & Kaltayeva, S. (2017). Human capital as a determining factor of increasing the competitiveness. Espacios, 38(42), 27.
Bickler, G., Morton, S., & Menne, B. (2020). Health and sustainable development: an analysis of 20 European voluntary national reviews. Public Health, 180, 180-184.
Cramer, G. R., Young, G. J., Singh, S., McGuire, J., & Kim, D. (2021). Evidence that collaborative action between local health departments and nonprofit hospitals helps foster healthy behaviors in communities: a multilevel study. BMC Health Services Research, 21(1), 1.
Danilova, M., Podoprigora, Y., & Ufimtseva, E. (2020). Investment Ensuring Process of Rational Environmental Management as Factor of a Sustainable Development of the Territory. IOP Conference Series: Materials Science and Engineering, 753(7), 072014.
Dubiei, Yu. V. (2021). Interrelation between human capital and innovation in the context of technical and technological development of a country. Naukovyi Visnyk Natsionalnoho Hirnychoho Universytetu, 6, 148-154.
Fan, X., He, P., Hou, L., & Meng, X. (2020). Review of International Research Progress on Ecological Threshold. Research of Environmental Sciences, 33(3), 691-699.
Fedulova, E. A., Korchagina, I. V., Vik, S. V., Kalinina, O. I., & Martyanov, V. L. (2017). International Cooperation in Environmental Management and Rational Use of Natural Resources. IOP Conference Series: Earth and Environmental Science, 50(1), 012023.
Gasanov, M. A., Kolotov, K. A., Demidenko, K. A., Podgornaya, E. A., & Kadnikova, O. V. (2017). The Concept of Ecologically Oriented Progress and Natural Resource Preservation. IOP Conference Series: Earth and Environmental Science, 50(1), 012025.
Huang, S. (2018). Air pollution and control: Past, present and future. Chinese Science Bulletin, 63(10), 895-919.
Ketova, K. V. (2007). A mathematical economic model of the manpower resource potential and cost characteristics of demographic losses. Applied Econometrics, 3(7), 80-94.
Ketova, K. V., Rusyak, I. G., & Vavilova, D. D. (2020). Mathematical modeling and neural network prediction of the structure and dynamics of human capital of the Russian Federation. Tomsk State University Journal of Control and Computer Science, 53, 13-24.
Maher, S. M., Fenichel, E. P., Schmitz, O. J., & Adamowicz, W. L. (2020). The economics of conservation debt: a natural capital approach to revealed valuation of ecological dynamics. Ecological Applications, 30(6), e02132.
Mcinnes, C., & Roemer-Mahler, A. (2017). From security to risk: Reframing global health threats. International Affairs, 93(6), 1313-1337.
Morozov, V. A. (2017). Human capital is the main state value. Creative Economy. 11(2), 213-222.
Rusyak, I. G., Ketova, K. V., Saburova, E. A., & Vavilova, D. D. (2020). Regional socio-economic parameters modeling and system analysis by means of programming and computing suite. IOP Conference Series: Materials Science and Engineering, 862, 52044.
Seixas, B. V., Regier, D. A., Bryan, S., & Mitton, C. (2021). Describing practices of priority setting and resource allocation in publicly funded health care systems of high-income countries. BMC Health Services Research, 21(1), 90.
Yang, Y., Zheng, R., & Zhao, L. (2020). Population aging, health investment and economic growth: Based on a cross-country panel data analysis. International Journal of Environmental Research and Public Health, 18(4), 1801, 1-16.
Copyright information

This work is licensed under a Creative Commons Attribution-NonCommercial-NoDerivatives 4.0 International License.
About this article
Publication Date
25 September 2021
Article Doi
eBook ISBN
978-1-80296-115-7
Publisher
European Publisher
Volume
116
Print ISBN (optional)
-
Edition Number
1st Edition
Pages
1-2895
Subjects
Economics, social trends, sustainability, modern society, behavioural sciences, education
Cite this article as:
Ketova, K. V., & Vavilova, D. D. (2021). The Population Health And The Environment Quality: Construction Of Mathematical Assessments. In I. V. Kovalev, A. A. Voroshilova, & A. S. Budagov (Eds.), Economic and Social Trends for Sustainability of Modern Society (ICEST-II 2021), vol 116. European Proceedings of Social and Behavioural Sciences (pp. 2572-2584). European Publisher. https://doi.org/10.15405/epsbs.2021.09.02.286