
Operational Risk And Identification Of Critical Sets In Process-Event Approach


Abstract
In the paper we are considering an important aspect of process-event modeling: identification and calculation of the probability of critical sets of events leading to increase in the operational risk of an enterprise. We pose operational risk as not a financial but a systemic risk of any economic agent, including enterprises of real sector of economy, trading, banking, social organizations, legal authorities, state administration. Operational risk is released in undesirable events which lead to operational losses. We are describing the enterprises activity as parallel processes consisting of sequence of events. An example of the numerical calculation of operational risk in dynamics and the probabilities of the occurrence of critical sets of events is given, based on real data from the event log, the evolution of the structural model of operational risk as a model of a random Hilbert graph is shown, examples of time diagrams for enterprise’s event flows are given. The offered approach can be used for dynamic economic capital reservation to cover possible losses.
Keywords: Operational risk, probability, event flow, critical set of events, process-event approach
Introduction
This paper describes further development process-event approach described in (Karaseva, 2018; Karaseva & Karasev, 2018; Karasev & Karaseva, 2019). Process-event approach was developed by author for dynamic operational risk assessment and economic capital reservation at enterprise operating in the real sector of economy. The ontology and main definitions of process-event approach were stated in (Karaseva, 2018; Karasev & Karaseva, 2019). The process-event approach is intended to replace the existing method for identifying operational risk factors based on simulation modeling of business processes, presented in the form of flowcharts and diagrams in a certain notation. Process-event approach allows to perform a numerical assessment of operational risk and management of economic capital for any agent in economics.
Many specialists and scientists are engaged in the problem of operational risk; there are a large number of publications devoted to the assessment and management of operational risk. Operational risk, its properties, and methods of its assessment are described, for example, in the works (Kaspereit et al., 2017; McKim, 2017; Panjer, 2006). Methods and recommendations for assessing operational risk and calculating the amount of economic capital are reflected in the documents of regulators, in particular, the Basel Committee on Banking Supervision (International Convergence of Capital Measurement and Capital Standards: A Revised Framework, 2006). But, despite numerous publications, the research of operational risk based on the analysis of the flow of events of the enterprise has not yet been performed.
Problem Statement
In our research, we proceed from the following postulates:
- Operational risk is not a financial risk but a systemic risk of any economic agent.
- The phenomenon of operational risk is defined by complex formalization. We cannot get precise numerical assessment applying most mathematical methods and simulation methods.
- Operational risk appears in undesirable events, which are caused by factors of any nature. Therefore, operational risk can be described by two numerical characteristics - the probability of an undesirable event (a real number in the interval [0, 1]) and losses (expressed in money).
- Operational risk is a dynamic value.
The functioning of any agent of the economy can be described by the dynamic sequence of set of events at this agent. For the purposes of assessment and management of operational risk, from the whole set of possible events , we select only those elementary events, that correspond to the successful performance of working procedures (actions, operations) aimed at achieving the required goals and being the raison d'être of the enterprise. The set of such events is a closed finite set, . The set is constant but can be changed when the activity of the enterprise and the business processes are changed accordingly.
As a rule, elementary events are casual events corresponding to the successful finalization of the simplest indivisible action (operation, procedure) of a process. It is impractical to divide elementary events into events that are initiating in relation to the primary event, since it is impractical to divide the operation (procedure, action) of the process.
Every process can be performed at a concrete time moment, that is, the process is an. Processes can be performed in sequence or in parallel in the same time, so, processes can be active at time.
The set of active processes determines the of the enterprise at time, or, by another words, operational risk is determined by the set of operations (procedures, actions) of all parallel processes, those successful finalization is expected at the current time.
The generalized structural model of operational risk is shown in Figure 1.
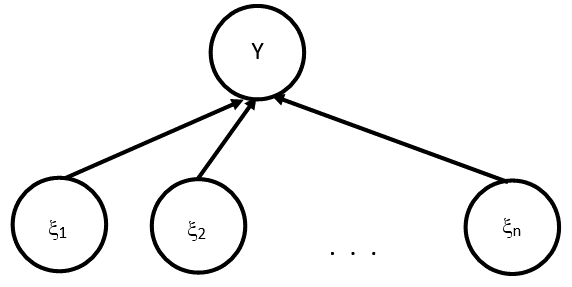
The structural risk model is a of an undesirable event (event tree) and is a directed graph, where is the number of nodes, is the number of links. Vertex corresponds to an undesirable event (losses due to operational risk), are independent casual events from the set .
The probability is calculated in accordance with the fault tree analysis method (Dugan et al., 1993; Xing & Amari, 2008).
At each time moment we have a set E of initiating events corresponding to the successful finalization of the current elementary procedures (operations, actions) of the process. At different consecutive times the set E will be consist of different events and their number will also be different, that is, the cardinality of the set E changes with time: . This can be clearly demonstrated at the time diagrams of the enterprise’s event flow, examples of such diagrams are given in (Karaseva, 2018; Karaseva & Karasev, 2019).
Considering the number of events in the tree at Figure 1 is constantly changing, then we observe a dynamic change in the graph in time, i.e. the graph is a random graph with a given structure of connections ( initiating vertices and one derivative), that is,,, and the graph can be denoted by.
The considered graph is a random Hilbert graph, where each new vertices (and new edges, correspondingly) are added with probability. Moreover, the graph is finite, since the set is finite.
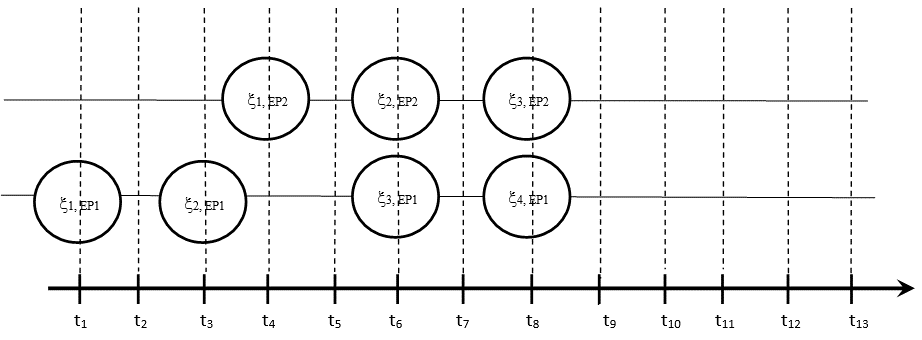
Let consider the evolution of a random graph using an example. Suppose, we have two active processes EP1 and EP2, executed in parallel in time, EP1 consists of four sequential operations (events of successful finalization of these operations are ), EP2 consists of three sequential operations (events of successful finalization of these operations ). Each operation has determined time interval for execution, for simplicity, let's assume, the intervals are equal for all operations of both processes.
Let's display at Figure 2 the timing diagram of the event flow of these two processes. At the Figure we see, the event must occur before time (or exactly at this moment), - before time - before - before , events and - up to , etc. Operational risk is determined by the logical sum of the probabilities of events where is the process’ number (in this case,), is the number of events in the process (in this case = 4, = 3).
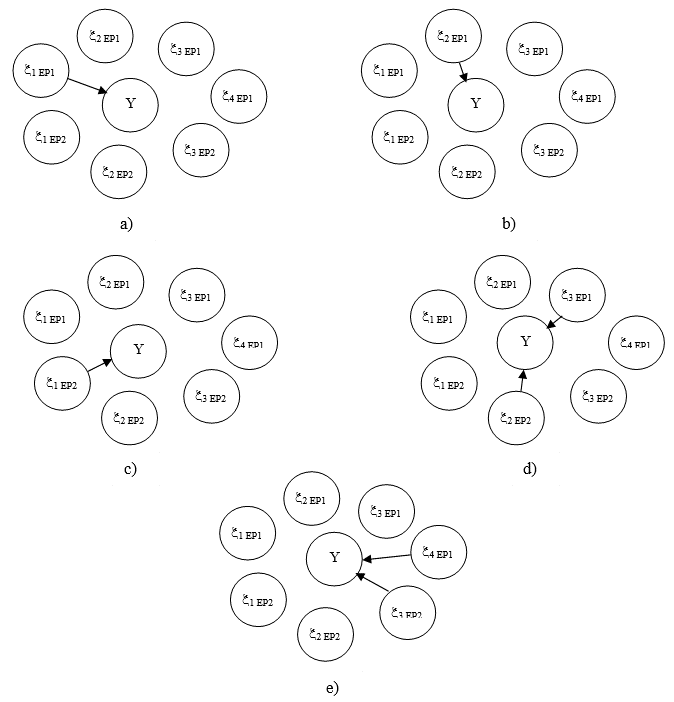
At Figure 3, a - e the time evolution of the graph (structural model of the operational risk of the enterprise) is shown.
During the enterprise’s functioning, situations are possible when the set of active events E consists of events having a high probability of finalization failure. Then we are talking about "critical combinations" of events, such critical sets will be denoted by St.
The study of random graphs and time diagrams of the event flow is necessary for identification theoretically possible critical sets of events St, calculating their probability and operational risk value for these critical sets.
Operational risk management in the process-event approach is development measures aimed at early evasion from the appearance of critical sets by redistributing processes over time and reducing the appearance probability for these sets. In parallel processes, when a critical set appears, the operational risk value increases rapidly, similar to the so-called “Snowball Effect”.
So, the problem of operational risk assessment in dynamics and identification of critical sets of events are main aims of our research.
Research Questions
To this moment the operational risk is considered as constant value at defined time interval. For commercial banks, this interval is three years (International Convergence of Capital Measurement and Capital Standards: A Revised Framework, 2006). The economic capital is calculated under constant operational risk for three years period.
We need to be sure the operational risk is dynamic value and could be changed in any time interval. If we consider such feature, we can define economic capital volume more precisely and reasonably. The results of research will be suitable for any economic agent.
Further, if operational risk is dynamic value, then we will observe extreme operational risk values at charts in time. Maximal values require most attention. If operational risk is high, then there are events which caused this danger situation. We need a tool for prediction such events in their combination.
So, we pose two research questions:
- To calculate operational risk for economic agent in different times with use of real event log data.
- To simulate event flow and suggest the method to predict combinations of events, leading to high operational risk.
Purpose of the Study
Today there is promising “Industry 4.0” concept. Within “Industry 4.0” framework we will get information metasystem having integrated systems: BPM (business process management information systems), WFM (work flow management systems), Enterprise Resource Planning II (ERP II), and others. Besides data repositories, these systems are keeping events logs (or protocols) which are useful for analysis and decision-making in order to increase the reliability and efficiency. Also, there is important task to identify real processes from the event logs of the functioning of information systems, organizations and enterprises. The problem is especially actual in cases where a precise mathematical formalization of the system is difficult or impossible as in operational risk assessment. Process Mining technologies are being actively developed (Wil, 2011), which allow extracting a process model from the event log, checking its compliance with the statistics of subsequent events, and improving it if there is a discrepancy between the data of the model and the process. Implementing the “Industry 4.0” framework we have a good possibility to apply process-event approach to solve the complex problem of operational risk assessment and economic capital reservation.
As operational risk is important systemic parameter and realizes in events, we now require the effective technology for assessment and analysis of this phenomena based on process-event modeling. In process-event modeling we are simulating the enterprise’s activity as flow of events in dynamics.
Purpose of the study is to provide further research process-event approach, started in (Karaseva, 2018), and get answer to above-mentioned research questions.
Research Methods
We will solve the above-mentioned problem and achieve the purpose by applying process-event approach with time event flow diagrams (Karaseva’s diagrams). Also, we will calculate operational risk by probabilistic model under risk scenario (tree of events).
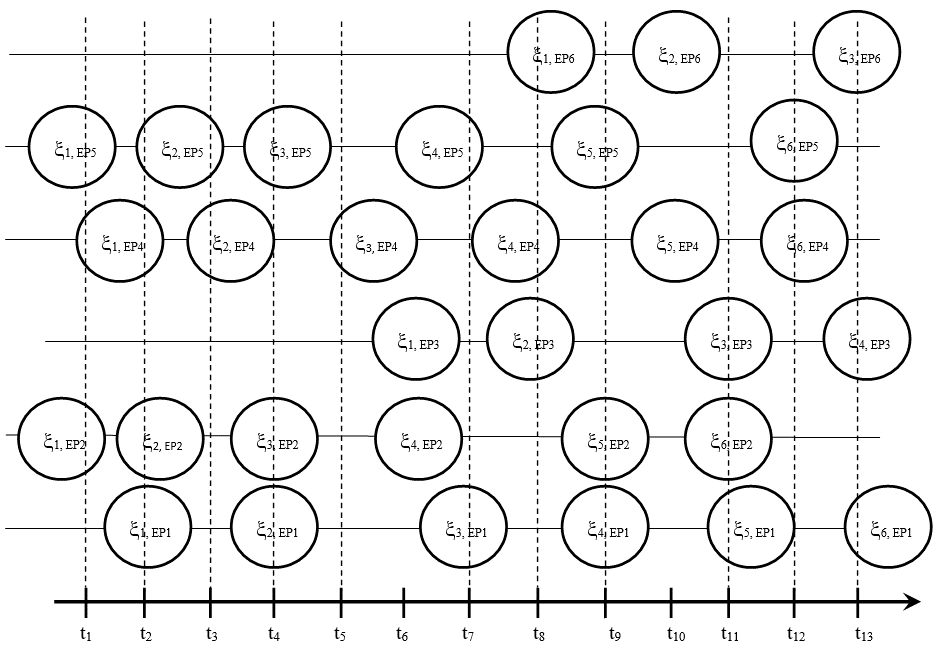
Let consider another example of a time diagram, presented at Figure 4. The abscissa axis is a time scale where time intervals or terms of key events ("milestones" of the project in project management) are plotted. The ordinate axis shows the ordinal numbers of business processes. Thus, in Figure 4, we have displayed a "snapshot" of the enterprise’s event flow with the time interval t1 – t13, which contains six active parallel business processes EP1 - EP6. Presented example demonstrates processes at active agent of the economy - a small enterprise that is a tax resident of the Russian Federation and performs general construction work. This example is discussed in more detail in (Karaseva, 2018). The probabilities of events i EPn, i = 1, …, kEPn are presented in Table 1. Data were obtained from the unfavorable event log, which was kept at the enterprise from 2009 to 2011, Note that the Table contains the probabilities of finalization failure Q(i, EPn) (the probabilities of failure of elementary operations, procedures or actions), that is, the current operational risk at concrete active process.
The processes EP1 - EP4 can occur both sequentially and in parallel mode. From the experience of the enterprise’s functioning (from the beginning of 1997 to July 2018), there are never more than two processes EP1 and EP3 at the same time (based on the specifics of the enterprise's activities), and processes EP2 and EP4 - no more than one, i.e. the number of active processes. Therefore, the diagram contains two EP1 processes, two EP3 processes, one EP2 process and one EP4 process, totally, six processes. To facilitate perception, the processes are assigned identifiers EP1 - EP6 and probabilities of events of two identical parallel processes will also be equal.
Processes EP1, EP2, EP4 and EP5 have six operations, EP3 has four operations, and EP6 has three operations. A detailed description of the processes and those operations is presented in (Karaseva, 2018).
The value of the enterprise's operational risk at time is determined by the totality (set E) of events which are active at time t. So, for example, in the diagram at time we have a momentary cut off the diagram with the set Е { }, at time we have Е { } and at time we have Е { }. Every event has probability of failure Q ( ) = P( ) – 1, k = 1, .., 6, i = 1, .., . the value of the enterprise's operational risk is equal to the probability of failure at least one event from the set E, i.e., for example, at times the value will be equal to:
;
;
Let's calculate the operational risk of the enterprise at . The calculation results are presented in Table 2.
Note, in general, the enterprise’s activity has a high operational risk. The dynamics of the operational risk of the enterprise is shown at Figure 5.
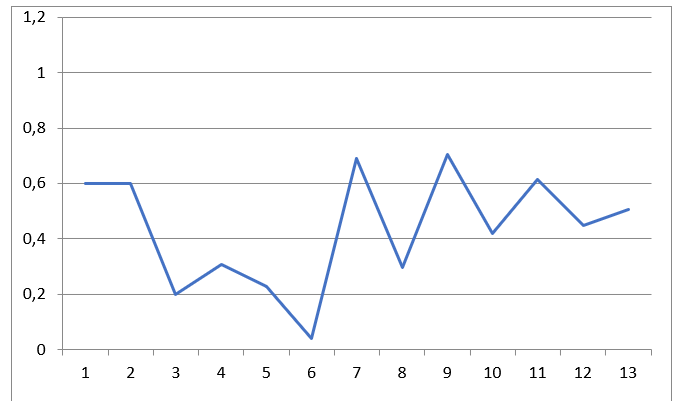
In the enterprise’s activity, critical sets also arise in time: - the set . We can see at Figure 5 some peaks - maximal operational risk values. At times , we should expect such combinations of events, where operational risk is extremely high. Or, in other words, the maximum values of the enterprise's current operational risk correspond to the critical sets of events on the event flow diagrams.
We can calculate probabilities of critical sets realization.
So, each event has probability of realization Р ( ) during a certain time interval . The event can occur if the previous event in the given active process EPn has realized, i.e., Р = 1 = 1. Therefore, the chain of events of the active process EPn is a Markov process - the probability of the realization of the current event (successful finalization of an operation, procedure action) depends only on the result of the previous operation (action, procedure).
In the case of several parallel synchronous processes, the prediction of the realization of critical set of events St is not difficult. The prediction can be performed visually with use of the event flow diagram for the enterprise (Karaseva's diagram) or the Gantt chart (Clark & Gantt, 1923). The relationship between the Gantt chart and the Karaseva’s diagram is discussed in (Karaseva & Karasev, 2019).
Note, the coincidence of time intervals with critical events from parallel processes does not indicate a 100% probability of a critical set of events, since the events of successful finalization of previous operations within the given time interval are random. A shift in time or delay any previous operation leads to a change in the set of current events E, which, as a result, may become uncritical. Therefore, we are talking about the probability of a critical set of events.
In the case of asynchronous processes, the probability of a critical set of events is calculated as follows.
Since the process in process-event approach is considered as a sequence of elementary events, the critical elementary event can realize only if all the previous events in the EPn process were realized, and the probability of realization of an operation with a critical elementary event is calculated according to the formula:
P( ) = , . (1)
Then, the probability of joint realization of critical events from active processes will be calculated using the formula for the probability of joint realization of these events:
P(St) = , i = 1, …, . (2)
Thus, according to the Karaseva diagram, we visually determine whether the time intervals for critical events from several parallel active processes coincide, and the probability of the realization of critical sets is calculated using formulas (1) and (2). Let’s calculate the probabilities of realization of critical sets for the processes EP1 - EP6 and write the results in Table 3.
As we can see from Table 3, at times and , critical sets arise with probability P(St) = 1 where P(Y) = 0.6. The reason is following: in our example the processes EP2 and EP5 (as well as EP1 and EP4) begin at the same time interval, and the first operation in these processes has a high probability of failure. To avoid a high value P(Y), we recommended, for example, to slightly change the production plan and shift these processes in time.
Thus, the identification and assessment the probability of critical sets allows you to correct the production plan in advance and reduce losses due to operational risk factors.
Findings
As we can see, the considered economic agent (small enterprise) is functioning with a high operational risk P(Y). Also, in enterprise’s activity there are some critical sets of events which lead to high operational risk. These sets are appeared in parallel processes and, in average, has not large probability of realization. But if several processes are starting simultaneously and their initial operations has large default probability then critical sets are not casual but quite determined. To avoid this, we need to start processes in different times, so, correct production plan or working schedule.
We have proved, the operational risk is dynamic value. We need to assess operational risk and calculate economic capital volume in dynamics also. The algorithm for economic capital volume calculation we will develop in our further research.
Conclusion
Finally, let’s explain the importance of the critical sets of events St.
The well-known concept of "Swiss cheese holes" (Foer, 2013) is based on the fact: large accidents and losses do not realize for a single reason but there are many reasons. There is a direct analogy between "Swiss cheese holes", which are internal systemic errors or unrecoverable external factors, lined up due to "cheese layers shifting" caused by the dynamic evolution of the system, and critical sets of events with high operational risk.
The high probability of failure in some operations indicates important systemic errors in the activities of the enterprise, or a strong influence of external factors that cannot be eliminated. When these errors accumulate and realize simultaneously, a large accident (failure, disaster, catastrophe) with high losses occurs. The critical set St is an example of such a "hole".
The process-event approach allows calculate the time interval and the probability of critical sets of events in advance, thereby correcting the production plan - shifting "cheese layers" to avoid high risk.
Of course, the process-event approach has some defects. For example, difficulties can arise in assessment the probabilities of elementary events for the successful finalization of some operations (actions, procedures).
Another important aspect of process-event management is the dynamic changes of the probabilities of elementary events, taking into account changes of external conditions and measures taken by managers to reduce risks. Today the technology of dynamical change the probabilities of elementary events has not been developed. This problem will be the next step in our research.
Also, the economic capital problem has not been researched while. In work (Karaseva, 2018) formulas for calculating the amount of economic capital are stated, however, they require clarification to be applied in the case of critical sets St. A high level of operational risk does not mean high financial losses. In order to develop measures to avoid critical sets, we should take into account the amount of losses. In the case of small losses with a high level of risk, it may be inappropriate to adjust the production plan (the cost of changing the plan may exceed the probable losses). A decision-making method is needed that takes into account the balance between the operational risk and the amount of losses.
Nevertheless, the process-event approach is a promising technology and has good perspectives within the framework of the “Industry 4.0” concept. The approach, proposed by the author, relates to the Process Mining technologies (Wil, 2011) (extracting processes from a dataset). The widespread use of the event log in modern information systems allows to solve the problem of assessment of the probabilities of elementary process events.
On the basis of the technology, proposed by the author, analytical tools for monitoring the state of an enterprise in real time can be developed. Operative control of the state of processes and current operational risk allows make the right decisions and effectively manage the enterprise by the criterion of loss minimization.
References
Clark, W., & Gantt, H. (1923). The Gantt Chart. A Working Tool for Management. The Ronald Press Company.
Dugan, J. B., Bavuso, S. J., & Boyd, M. A. (1993). Fault Trees and Markov Models for Reliability Analysis of Fault Tolerant Systems. Reliability Engineering and System Safety, 39, 291-307.
Foer, E. (2013). Metafora katastrofy kak upravljat riskami pri pomoschi «shvejcarskogo syra» [Catastrophe Metaphor: How to Manage Risk with Swiss Cheese]. Theory & Practice. https://theoryandpractice.ru/posts/7427-metafora-katastrofy-kak-upravlyat-riskami-pri-pomoshchi-shveytsarskogo-syra
International Convergence of Capital Measurement and Capital Standards: A Revised Framework. (2006). Bank for International Settlements Press & Communications CH-4002 Basel, 333. https://www.bis.org/publ/bcbs128.pdf
Karasev, V., & Karaseva, E. (2019). Process-Event Approach for Operational Risk Estimation. Environment. Technology. Resources. Proceedings of the 12th International Scientific and Practical Conference on June 20-22, 2019, 70-73.
Karaseva, E. I. (2018). Osnovy processno-sobytijnogo podhoda dlja ocenki operacionnogo riska kommercheskogo banka [Fundamentals of Process-Event Approach for Operational Risk Assessment in Commercial Bank]. Nauchnyj vestnik finansy banki investicii, 4(45), 105-113.
Karaseva, E. I., & Karasev, V. V. (2018). Processno-sobytijnyj podhod k ocenke operacionnogo riska predprijatija realnogo sektora ekonomiki [Process-Event Approach for Estimation of Operational Risk of Enterprise of Real Economy]. Analiz modelirovanie upravlenie razvitie socialno-ekonomicheskih sistem sbornik nauchnyh trudov XII Mezhdunarodnoj shkoly-simpoziuma AMUR-2018 Simferopol-Sudak 14-27 sentjabrja 2018, 199-207.
Kaspereit, T., Lopatta, K., Pakhchanyan, S., & Prokop, J. (2017). Systemic operational risk. Journal of Risk Finance, 18(3), 252-262.
McKim, V. L. (2017). Operational risk assessment. Journal of Business Continuity & Emergency Planning, 10(4), 339-352.
Panjer, H. H. (2006). Operational Risk: Modeling Analytics. Wiley.
Wil, M. P. van der Aalst. (2011). Process Mining: Discovery, Conformance and Enhancement of Business Processes. Springer-Verlag Berlin Heidelberg.
Xing, L., & Amari, S. V. (2008). Fault Tree Analysis. In Handbook of Performability Engineering. Springer.
Copyright information

This work is licensed under a Creative Commons Attribution-NonCommercial-NoDerivatives 4.0 International License.
About this article
Publication Date
25 September 2021
Article Doi
eBook ISBN
978-1-80296-115-7
Publisher
European Publisher
Volume
116
Print ISBN (optional)
-
Edition Number
1st Edition
Pages
1-2895
Subjects
Economics, social trends, sustainability, modern society, behavioural sciences, education
Cite this article as:
Karaseva, E. (2021). Operational Risk And Identification Of Critical Sets In Process-Event Approach. In I. V. Kovalev, A. A. Voroshilova, & A. S. Budagov (Eds.), Economic and Social Trends for Sustainability of Modern Society (ICEST-II 2021), vol 116. European Proceedings of Social and Behavioural Sciences (pp. 2451-2462). European Publisher. https://doi.org/10.15405/epsbs.2021.09.02.273