
Features Of Economic Development Policies For New Industrial Countries


Abstract
An extended list of newly industrialized countries was assessed by signs of growth and risk over the period since 1950. Of the 10 types of development, 7 types of development and 32 countries from 37 studied countries are classified as newly industrialized countries. Under the policy of economic development, the change in the indicators of risk and growth of the study period is determined in comparison with the previous economic cycle. Reducing risk and accelerating growth is defined as a progressive policy, the opposite is defined as regressive, the growth of both indicators is defined as aggressive, and decline is a conservative policy. 6 groups of countries were identified with the maximum number of policy matches from 3 to 5 out of 7 possible. The intersection of groups of countries on the basis of the type of development and historical fate coincides with some cultural and civilizational groups. The groups with the same development policy revealed the coincidence of the development strategy: oil exporters and labor-surplus countries with different cultural identities.
Keywords: Newly industrialized countries, economic development policy, historical fate, economic growth, economic risks
Introduction
The object of this study includes the "newly industrialized countries" (NIS) the economies of which in a short period of time made the transition to the highly developed.
The NIS of the "1st wave" include: Hong Kong, the Republic of Korea, Singapore, Taiwan, Argentina, Brazil and Mexico; the "second wave": India, Malaysia, Thailand, Chile; "Third wave": Indonesia, Turkey; "Fourth wave": Iran, Philippines. Promising NISs include Nigeria, Egypt, Pakistan, Bangladesh, Vietnam (Demand for Manufactured Products…, 2017; Karimullina, 2011).
The long-term growth trajectory of developing countries was explored in (Popov, 2015). The features of the institutions and culture of China, India and Brazil in relation to innovative development were considered in the work (Yasin & Snegovaya, 2009).
This hypothesis was put forward by us in a number of works that investigated the institutional and cultural development, as in the construction of theoretical models (Savelyev, 2015, 2016, 2020b), and in the phenomenological description of various historical and cultural communities: civilizations and cultures (Savelyev, 2015, 2016).
Problem Statement
When studying newly industrialized countries (hereinafter - NIS), researchers usually estimate the period of accelerated growth and, on this basis, group countries into all kinds of "waves". But when answering the question of how capable NIS is for a consolidated policy towards the countries of the “Golden Billion”, an analysis of the dynamics of economic growth is clearly not enough. The second most important indicator of the analysis in this case is to determine the sustainability of economic development.
Research Questions
In the course of the study, answers were obtained to the following questions:
- What groups can be sorted into the expanded composition of newly industrialized countries by the type of economic development in terms of risk and growth indicators?
- Which countries have the same dynamics of changes in risk and growth that make up their historical destiny?
- Which countries are simultaneously pursuing certain policies to change growth and development risk?
Purpose of the Study
This study is aimed at studying this set of indicators in order to determine the similarities and differences in the economic development of this group of countries. The aim is also to determine an expanded list of NIS, taking into account the economic success in the last two decades of a whole group of countries that were not included in the NIS before.
Research Methods
When assessing the controllability and sustainability of economic development of countries, it seems most reasonable to use indicators of economic growth and risk, quantitatively expressed in the growth rates of real Gross Domestic Product and standard deviation (SD) of these rates, respectively.
This research scheme is described in detail in (Savelyev, 2020a) and applied to study the development of Russia in the imperial, Soviet and modern periods (Savelyev et al., 2020b), in relation to German-speaking countries (Savelyev et al., 2020a), Portuguese-speaking and French-speaking (Savelyev et al., 2021a, 2021b), as well as in combination with factor analysis to analyze the activities of Russian governments over the past 30 years (Savelyev et al., 2021c). With regard to the development of newly industrialized countries, this study builds on our previous study (Savelyev et al., 2021d), but for a wider range of countries.
Within this approach, it is customary to consider changes in the economy as progressive in the case when the subsequent period, in comparison with the previous one, has a higher growth rate of macroeconomic indicators and a lower risk indicator (SD). On the contrary, in the event of a decrease in growth and an increase in risks, economic development will be regressive. In the case of a mutual decline in growth rates and risks, economic development is conservative, and in the case of growth, it is aggressive.
Findings
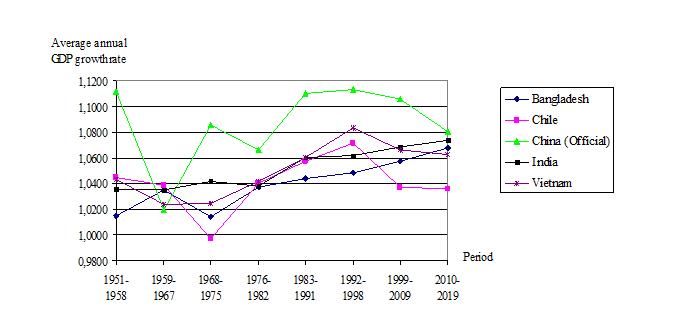
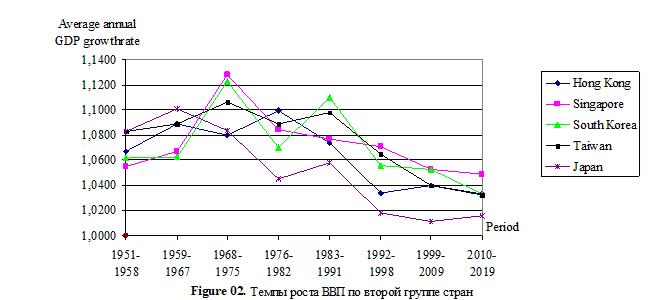
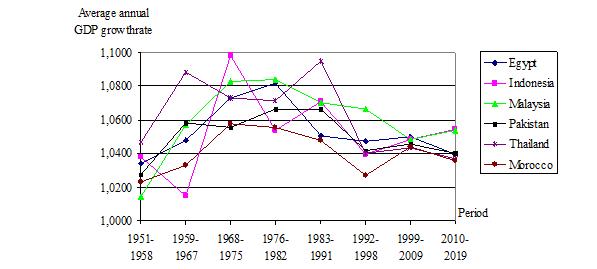
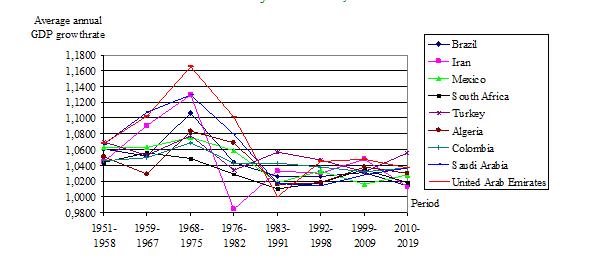
Based on important positive relationships, the groups of countries with the most significant connections in terms of growth and risk were identified. Five groups of countries were identified according to the correlation of trends in average real Gross Domestic Product growth rates for the economic cycle and 8 groups of countries according to the correlation of trends in SD. Graphs of real Gross Domestic Product growth rates by groups of countries, taking into account the correlation, are shown in Figure 1-6. Groups of countries according to the correlation of real Gross Domestic Product growth rates:
- The 1st group - Bangladesh, Chile, India, Vietnam, China (Table 1).
- The 2nd group - Hong Kong, Singapore, South Korea, Taiwan, Japan (Table 2).
- The 3rd group - Thailand, Egypt, Malaysia, Pakistan, Morocco, Indonesia (Table 3).
- The 4th group - Brazil, Colombia, Iran, Mexico, Saudi Arabia, South Africa, United Arab Emirates, Algeria, Turkey (Table 4).
- The 5th group - Peru and Qatar (Table 5).
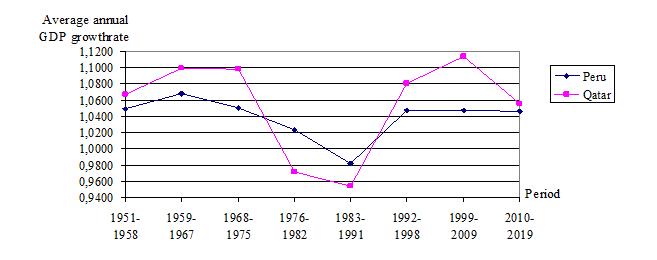
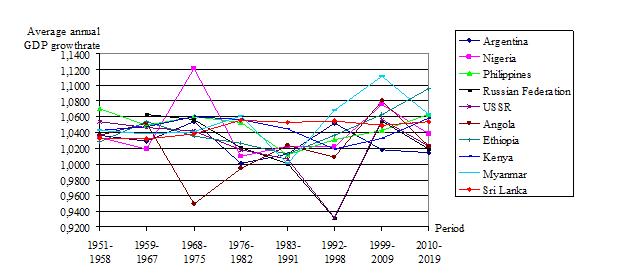
The rest of the countries: Angola, Argentina, Nigeria, Philippines, Venezuela, Kenya, Sri Lanka, USSR-Russia, Ethiopia, Kenya, Myanmar have no significant correlations of average growth rates. Most of them, as well as the fifth group, were not previously included in the number of NIS.
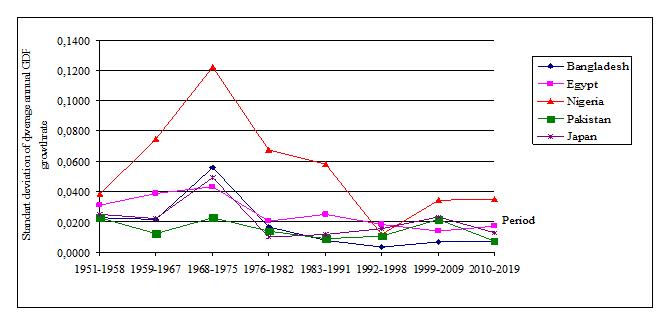
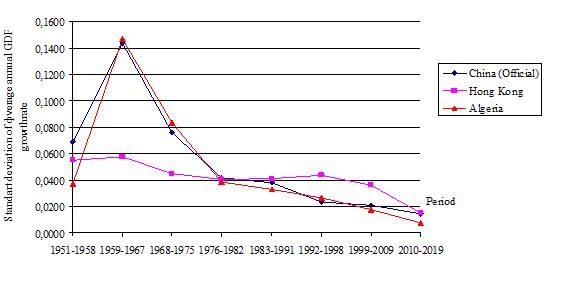
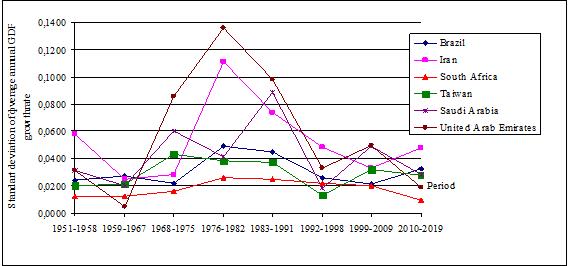
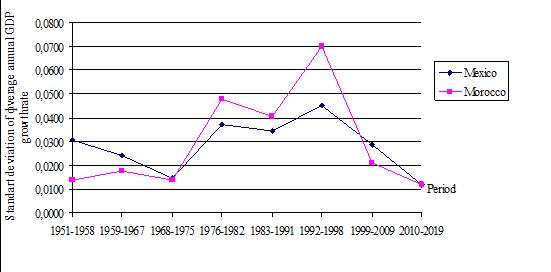
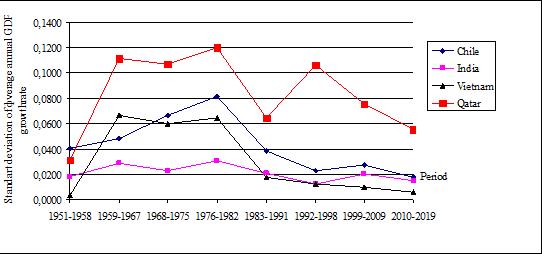
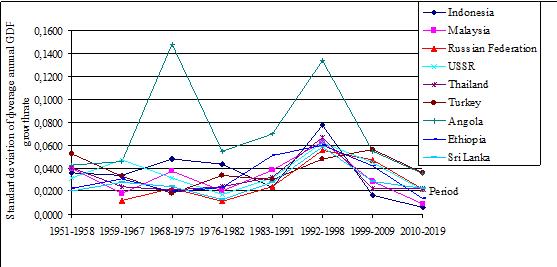
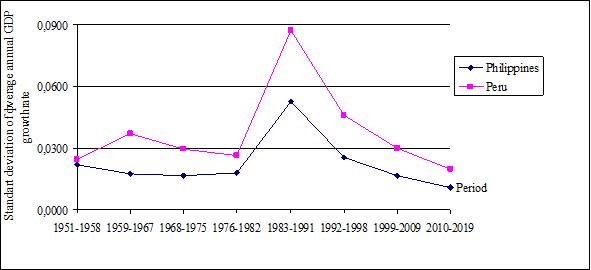
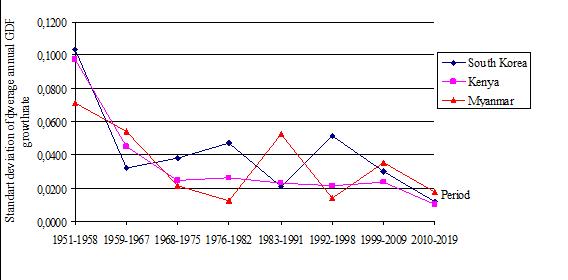
The graphs of the standard deviation taking into account the correlation are shown in Figure 7-14. Groups of countries by correlation of standard deviation values:
- The 1st group - Bangladesh, Japan, Egypt, Nigeria, Pakistan (Table 6).
- The 2nd group - China, Hong Kong, Algeria (Table 7).
- The 3rd group consists of three pairs of more interconnected countries Brazil and Iran, South Africa and United Arab Emirates, Taiwan and Saudi Arabia (Table 8).
- The 4th group - Mexico, Morocco (Table 9).
- The 5th group - Chile, India, Vietnam, Qatar (Table 10).
- 6th group - Indonesia, Malaysia, Thailand, Sri Lanka, USSR-Russia, Ethiopia, Turkey and Angola (Table 11).
- 7th group - Peru and Philippines (Table 12).
- The 8th group - South Korea, Kenya, Myanmar (Table 13).
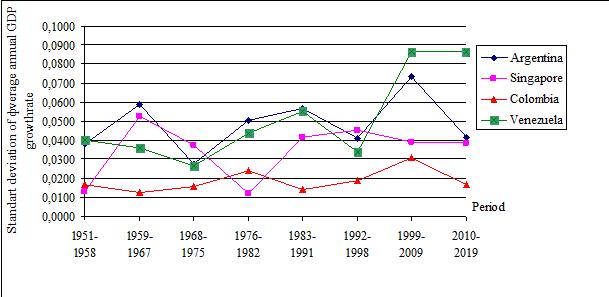
The rest of the countries: Argentina, Venezuela, Colombia and Singapore have no significant SD correlations.
The overlapping of groups of countries with the most significant connections in terms of growth rates and risks on top of each other along the most close ties made it possible to compose groups of the historical fate of the NIS. In these groups, one can distinguish pairs of countries with the closest ties with each other as the nuclei of the groups. The results of such a grouping show the following groups of historical fate:
- First group - 6 countries: 1 subgroup - core India / Vietnam (0.85 and 0.81) + Chile, 2 subgroup - core Bangladesh / Japan (0.89) + Nigeria, the relationship between subgroups India / Bangladesh (0, 86).
- The second group - 6 countries: with the center South Korea and connections from it to Singapore (0.85), Taiwan (0.83) and further to Hong Kong, as well as to Kenya (0.88) and further to Myanmar.
- The third group - 10 countries: 1 subgroup - the core of Morocco / Egypt (0.86), 2 subgroup - the core of Malaysia / Thailand (0.84) + Pakistan, Indonesia and further Angola, Sri Lanka and further Ethiopia and the USSR / Russia.
- Fourth group - 10 countries: 1 subgroup - core Brazil / Colombia (0.92) + Iran and Turkey, 2 subgroup Saudi Arabia and the United Arab Emirates (0.93) + Mexico and South Africa, 3 subgroup - China / Algeria (0.96).
- Fifth group - 3 countries: Philippines / Peru (0.96) + Qatar.
Argentina and Venezuela did not find a stable relationship for the indicators studied with any NIS country. Thus, according to the type of development and historical fate, we have the following classification matrix for NIS (Table 14).
In order to be able to compare the development of countries in different periods, it was assumed that if the subsequent period compared to the previous one had a lower risk indicator and a higher growth rate, then changes in economic development can be considered progressive, the reverse change - regressive. If risks and growth are falling, the development can be considered conservative, and if they grow, aggressive. Thus, opposite politicians are two pairs: 1) aggressive and conservative politicians, 2) regressive and progressive politicians. Taking this into account, a table of economic development policies of the studied countries was obtained (Table 15).
Analysis of the results of Table 15 showed that each of the studied countries had a maximum indicator of proximity with any other country not lower than 3, and several pairs of countries found closeness with an indicator of 4 and 5. A higher indicator (maximum - 7) was not found. If we group the countries according to the indicator of their proximity, taking into account only the maximum values for each country (indicators of proximity less than the maximum for the country were not taken into account), then we get the following distribution:
- The first group (8 countries) is a core of four countries, in which Brazil and Algeria, Algeria and China, China and Vietnam have an indicator of proximity 5. Vietnam and Chile, as well as Argentina with China, India and Vietnam - 4. To this group Taiwan, which has an indicator of proximity of 3 with China and Nigeria, can also be attributed, but due to the cultural component it is closer to China.
- The second group (8 countries) - an indicator of proximity of 5 at the core of four countries: Angola and Hong Kong, Hong Kong and the USSR, the USSR and Russia, if the USSR and Russia are taken into account as different objects of study, since their ties with other countries did not always coincide. Thailand with each of these four had a score of 3, and it also had the same score with two other countries from the core of the other group (Ethiopia and Qatar), but due to the greater number of equal countries, it was assigned to this group. Singapore has an indicator of 4 ties with Hong Kong, the USSR and Morocco (the latter is also included in the core of another group of countries). Malaysia and Sri Lanka have a connection with each other and with Singapore at level 3, Malaysia has an indicator of 3 with Japan, which we referred to another group due to its greater proximity to its core, and Sri Lanka - with Mexico, which is a part of the core of another group.
- The third group (5 countries) - the core is made up of indicators of proximity 5 for Qatar with Ethiopia, Morocco and South Africa, and Peru is also assigned to this group, which has an indicator of 3 with Qatar, Ethiopia and South Africa. With the countries of the first and second groups, Peru has the same connection, but only with a couple of countries in each.
- The fourth group (11 countries) - the core with an indicator of 4 are: Colombia in ties with South Korea, Kenya and Turkey. Then there are paired ties with indicator 4: Kenya - UAE, Turkey - Mexico, Mexico - Philippines. For indicator 3, this group includes Japan in connection with Colombia, Myanmar - with the Philippines, Indonesia - with Turkey and South Korea, Iran - with the UAE and South Korea.
- The fifth group (3 countries) - can be considered transitional between the first and fourth: indicator 3 has ties between Venezuela and Nigeria and Iran, Nigeria with Saudi Arabia. Venezuela also has the same connection with Argentina, Nigeria with Taiwan, which are included in the first group.
- The sixth group (3 countries) - can be part of the second. It has an indicator of 3 for Pakistan's ties with Egypt and Bangladesh. Egypt and Pakistan are connected with Hong Kong and Russia from the second group, respectively.
No phenomenological connections of the resulting grouping of countries with the coinciding development policy with culture, development strategy, synchronicity of risk and growth changes, and the type of development were found. Perhaps this connection exists in relation to some institutional changes or in combination with additional policy indicators, a large number of periods, the duration of outrunning growth, an additional grouping of countries, etc. An accidental coincidence is also possible, although the average indicator of such an outcome is below 2 (7/4 = 1.75) for 7 periods studied, and in 9 cases it is exceeded almost 3 times! The discovery of a nonrandom, but so far unexplained phenomenon is also a scientific result that other scientists can investigate.
Without a single criterion for the formation of groups, we can only note that some of the identified groups of countries have signs of grouping by resources and development strategy
- The first group contains the largest labor-surplus countries: India, China, Brazil, Vietnam.
- The fourth and fifth groups at their junction have an unbroken chain of OPEC member countries: UAE, Iran, Venezuela, Nigeria, Saudi Arabia.
- The sixth group consists of labor-abundant Islamic states: Egypt, Bangladesh and Pakistan.
In any case, all the studied countries are linked to each other in one large group according to the criterion of belonging to newly industrialized countries. And the presence of a proximity indicator of at least 3, which is 1.7 times higher than the random one, indicates that they are all included in a certain sample. On the other hand, if we take 4 or more as a significant indicator of proximity, then the newly industrialized countries consist of the cores of the first four above-defined groups. In this case, the rest of the countries either do not have similarities in economic development policies or cannot be attributed to the desired group at all.
It can also be important under which policies the countries are synchronized. Then we will have groups united by progressive politics or conservative ones.
Conclusion
The newly industrialized countries differ greatly in their historical fate and type of development by the type of development, the use of two main strategies was revealed: export and import substitution. The export strategy provides two types of development: commodities and industrial products. There are also countries that have changed strategies and have not fully utilized development opportunities. Only one country - China - is simultaneously applying both of these strategies in conjunction with the strategy of technological leadership and is the new potential leader in human development. During the study period, 10 types of development were identified according to the characteristics of risk and economic growth. 7 types of them are classified as newly industrialized countries.
A dynamic analysis of changes in growth rates and risks by economic cycles showed the presence of 5 groups of newly industrialized countries with a similar historical fate.
By the proximity of countries in the implementation of economic development policy, 4 main and 2 possible groups of countries have been identified.
When countries are grouped by types of development and a similar historical fate, by enlarging the grouping, cultural and civilizational groups can be distinguished. The proximity of countries in the implementation of the policy of economic development does not show such signs, but there is a coincidence with some resource-strategic signs.
Acknowledgments
The reported study was funded by RFBR, project number 20-010-00869.
References
Abramova, I. O., Bolshov, I. G., Bragina, E. A., Degterev, D. A., Deich, T. L., Kalinichenko, L. N., Korendyasov, E. N., Kukushkin, V. Yu., Kulkova, O. S., Kupriyanov, P. I., Lileev I.L., Matveeva, N. F., Matsenko, I. B., Morozenskaya, E. V., Morozov, V. P., Novikova, Z. S., Pavlov, V. V., Pashkova, E. V., Popova, O. P., Pospelov, V. K., Rybalkin, V. V., Skubko, Yu. S., Sledzevsky, I. V., Robert Herve Tambo Talla, Ulchenko, N. Yu., Khalitova, A. R., & Khamatshin, A. D. (2016). Africa: Modern Strategies for Economic Development: Monograph. Institute for African Studies RAS.
Akamatsu, K. (1962). A historical pattern of economic growth in developing countries. Journal of Developing Economies, 1(1), 3-25.
Amsden, A. (1991). Diffusion of Development: The Late-Industrializing Model and Greater East Asia. The American Economic Review, 81(2), 283.
Balassa, B. (1988). The Lessons of East Asian Development: An Overview. Economic Development and Cultural Change, 36(3), 288.
Barrett, R., & Whyte, M. (1982). Dependency Theory and Taiwan: Analysis of a Deviant Case. The American Journal of Sociology, 87(5), 1086.
Bolt, J., & van Zanden, J. L. (2014). The Maddison Project: Collaborative research on historical national accounts. Economic History Review, 67(3), 627-651.
Chen, E. (1979). HyperGrowth Asian Economies: A Comparative Study of Hong Kong, Japan, Korea, Singapore, and Taiwan. Macmillan.
Cumings, B. (1984). The Origins and Development of the Northeast Asian Political Economy: industrial sectors, product cycles, and political consequences. International Organization, 1, 8.
Demand for Manufactured Products: A Factor for Inclusive and Sustainable Industrial Development. (2017). Industrial Development Report - 2018 by the United Nations Industrial Development Organization.https://www.unido.org/sites/default/files/files/2017- 11/IDR2018_OVERVIEW_RUSSIAN.pdf
Evans, P. (1987). Class, State and Dependence in East Asia: Lessons for Latin Americanists. Deyo Fr. (ed.) The Political Economy of the New Industrialism, Ithaca-London, 208-209.
Glazyev, S. Yu., & Fursov, A. I. (2014). The Big Leap Strategy. Algorithm.
Hein, S. (1992). Trade Strategy and the Dependency Hypothesis: A Comparison of Policy, Foreign Investment, and Economic Growth in Latin America and East Asia. Economic Development and Cultural Change, 40(3), 495-521.
Kagarlitsky, B. Yu. (2004). Peripheral Empire: Russia and the World System. Ul-ra. Kultura.
Karimullina, A. V. (2011). Modern Western Interpretations of the Features of the Economic Development of New Industrial Countries in Asia Southeast Asia: Actual Problems of Development No 16. https://cyberleninka.ru/article/n/sovremennye-zapadnye-interpretatsii-osobennostey-ekonomicheskogo-razvitiya-novyh-industrialnyh-stran-azii (date of access: 07/04/2020) ekonomicheskogo-razvitiya-novyh-industrialnyh-stran-azii
Korotayev, A. (2007). Compact Mathematical Models of World System Development, and How they can Help us to Clarify our Understanding of Globalization Processes. Globalization as Evolutionary Process: Modeling Global Change. Edited by George Modelski, Tessaleno Devezas, and William R. Thompson. Routledge.
Krugman, P. (1994). The Myth of Asia's Miracle. Foreign Affairs, 73(6), 77.
Maddison, A. (2008). Historical Statistics of the World Economy. http://www.ggdc.net/MADDISON/Historical_Statistics/horizontal-file_02-2010.xls
Popov, V. (2015). Searching for new Sources of growth. Are the Developing Countries Catching up with the Developed ones? Voprosy Ekonomiki, 10, 30-53.
Savelyev, M. (2015). Multicultural institutionalism: General economic theory of civilizations. The political economy of traditionalism Network Society Project: [monograph]. Izhevsk: Assoc. according to methodol. Ensuring bus in ess activity and societies development "Mitra", 488. http://cognitiofluctus.ru/science/s001/001.htm
Savelyev, M. (2016). Neoinstitutionalism: methodological contradictions and multicultural means of overcoming them. Science of Udmurtia, 3(77), 47-56.
Savelyev, M. (2020a). Methods for researching the sustainability of economic development of territories. Problems of regional economy, 3-4, 54-62.
Savelyev, M. (2020b). Problem statement for modeling innovative development of territories with different cultural environments. Problems of regional economy, 3-4, 133-140.
Savelyev, M., Gruzdeva, T., Savchenko, A., Koretsky, V., & Pushina, N. (2021a). Assessment of the Competitiveness and economic development policies of the countries of the Former French Empire. SHS Web Conf, 101, 02005.
Savelyev, M., Ivanov, V., & Polyakov, Yu. (2020a). The effect of institutional differences on the economic development of German-speaking countries. E3S Web of Con., 222, 05009.
Savelyev, M., Kutyashova, E., Savchenko, A., Koretsky, V., & Polyakov, Yu. (2021b). Diversity of economic development in Portuguese-speaking countries, SHS Web Conf, 101, 02004.
Savelyev, M., Pushina, N., & Bryndin, A. (2021c). Search for Effective Governments in Post-Soviet Russia While Excluding the Factor of World Oil Prices from the Results of the Country's Economic Development. IOP Conf. Ser.: Earth Environ Sci., 666062092.
Savelyev, M., Pushina, N., & Savchenkо, A. (2020b). Assessment of the sustainability of economic development under the governments of Russia. E3S Web Conf, 208, 03052.
Savelyev, M., Sokolova, N., & Polyakov, Yu. (2021d). Newly Industrialized Countries: Is There an Alternative to the Golden Billion? IOP Conf. Ser.: Earth Environ Sci., 666062093.
Sen, S. (1998). Asia: Myth of a Miracle. Economic and Political Weekly, 33(3), 439.
Sergeev, V. M., Alekseenkova, E. S., & Nechaev, V. D. (2020). Typology of models of innovative development.http://ecsocman.hse.ru/data/2011/12/29/1270393214/Politeia_Sergeev_Alexeenkova_Nechaev-2008-4.pdf (date accessed: 02/07/2020).
The Conference Board, Total Economy Database. (2019). https://www.conference-board.org/retrievefile.cfm?filename=TED_1_APR20191.xlsx&type=subsite (04.07.2020).
Wade, R. (1989). What Can Economics Learn from East Asian Success? Annals of the American Academy of Political and Social Science, 505, 69.
Wallerstein, I. (2001). Analysis of world systems and the situation in the modern world. Translated from English P M Kudyukin ed. B Yu Kagarlitsky. University book.
Wolf, Ch. (1988). Markets or Governments: Choosing between Imperfect Alternatives Cambridge. Mass: MIT Press.
World Bank, "World Development Indicators". (2020). https://databank.worldbank.org/source/world-development-indicators
Yasin, E., & Snegovaya, M. (2009). Institutional and Cultural Limitations of Catching-up Countries. Voprosy Ekonomiki, 11, 32-49.
Copyright information

This work is licensed under a Creative Commons Attribution-NonCommercial-NoDerivatives 4.0 International License.
About this article
Publication Date
25 September 2021
Article Doi
eBook ISBN
978-1-80296-115-7
Publisher
European Publisher
Volume
116
Print ISBN (optional)
-
Edition Number
1st Edition
Pages
1-2895
Subjects
Economics, social trends, sustainability, modern society, behavioural sciences, education
Cite this article as:
Savelyev, M. Y., Savchenko, A. I., Pushina, N. N., Sokolova, N. G., Koretsky, V. P., & Bryndin, A. V. (2021). Features Of Economic Development Policies For New Industrial Countries. In I. V. Kovalev, A. A. Voroshilova, & A. S. Budagov (Eds.), Economic and Social Trends for Sustainability of Modern Society (ICEST-II 2021), vol 116. European Proceedings of Social and Behavioural Sciences (pp. 975-991). European Publisher. https://doi.org/10.15405/epsbs.2021.09.02.109