
Integral Assessment Of The Intellectual Capital Of The Region


Abstract
At present, the role of intellectual capital is increasing, which is a competitive advantage and a prerequisite for the region’s transition to an innovative development path. Efficient use of intellectual capital is a major factor in innovation activity and the economic growth of a region in a knowledge economy. At the same time, in the process of managing innovative capital at the regional level, there are problems of its formation and evaluation. To determine the state of the intellectual capital of the region, we consider some instrumental methods and propose a method for calculating the integral assessment, which includes indicators characterizing the main components of the regional intellectual capital. The measuring system is formed taking into account the fact that it should not be cumbersome and should be easily checked and updated with available sociological and statistical information. A comprehensive assessment of intellectual capital based on available sociological and statistical information will allow us to apply its results for the purposes of strategic planning of innovative development of the region.
Keywords: Intellectual capital, integral index
Introduction
A necessary condition for the modernization of the Russian economy, the strengthening of the country's competitive position in the external market, is to increase the effectiveness of innovation and the formation of a knowledge economy. The transition of the Russian economy to the innovative path of development highlights the growing need for the intellectualization of labour and the active implementation of scientific achievements. In this regard, intellectual capital (IC) acquires special relevance as national wealth and as a strategic resource for innovative development of the country's economy.
The formation of intellectual capital is a competitive advantage and a prerequisite for the transition of the region to an innovative path of development. The transition to an innovative model of economic development necessitates the management of the intellectual capital of the region (ICR). Efficient use of intellectual capital is a major factor in innovation activity and the economic growth of a region in a knowledge economy. The level of innovation development in the region is determined by the abilities of economic entities to generate new knowledge and use the obtained intellectual results and acquired productive relations with the external environment (Saktoev & Khaltaeva, 2011; Saktoev et al., 2018).
In general, the concept of ICR can be viewed as a combination of all the intangible resources available in the region and as providing the region with competitive advantages and opportunities to create new values (Bronisz et al., 2012). This article outlines the goals and objectives of the integral assessment of ICR, discusses some instrumental methods, and suggests a method for calculating the integrated assessment of ICR for the purposes of strategic planning of innovative development of the region.
Problem Statement
Issues of evaluation of ICR are relatively understudied. Most of the studies presented in the literature are devoted to the assessment and management of the intellectual capital of commercial organizations. The main purpose of assessing the intellectual capital of a region is to obtain objective information about the state of the ICR and the process of its formation. The problems of estimating ICRs are primarily related to the complexity of describing this economic category, the lack of a unified approach to the interpretation of the concept, and its structure.
The work of many foreign and domestic scientists is devoted to solving the problem of evaluating intellectual capital, including Edvinsson and Malone (1997, 1999); Kozyrev & Makarov (2003); Kaplan & Norton (2005); Lukicheva (2007); Poltorak and Lerner (2004); Sitnova (2007) and other.
The most comprehensive review of methods for measuring intellectual capital, in our opinion, is presented by Sveiby (2001). He identifies 25 methods of measuring intellectual capital, grouping them into 4 categories.
At present, there is no generally accepted method in the scientific literature of calculating ICR, but there is an economically similar and standardised method for calculating the human development index (HDI), developed in 1990 by Pakistani economist Mahbub Ul Haq (1995) under the auspices of UNESCO and widely used in international comparisons.
Intellectual capital, like the HDI, is an integral concept, but more specialised. Using the methods of calculating the human development index to assess the intellectual capital of a region is possible only if there is a significant adjustment of the analysed indicators. An attempt to modify the human development index in this context was undertaken in the works of Levashov (2008) and (Levashov & Rutkevich, 2000). They assume that only two elements are fundamental in the evaluation of intellectual capital: science and education. Levashov notes the following.
The intellectual capital of a society can be compared to a precious diamond with the only difference that the intellectual potential is polished not by a skilled jeweller, but by the material and spiritual culture of society. The diamond can be measured using many characteristics, but two of them are essential: weight and transparency. To measure the intellectual capital of a society, there are also two main characteristics: science and education, which directly or indirectly reflect the intellectual potential of the whole society (Levashov, 2008).
The model proposed by Levashov and Rutkevich seems very interesting to us, but focusing on only two areas of public life cannot provide a complete picture of the state of the intellectual potential of a region.
Research Questions
Intellectual capital is one of the most mobile and controversial economic categories. Such scientists as Al-Shubiri (2013); Bontis (1998); Brooking (2001); Buzan (2013); Chun-Yao and Yeong (2005); Means and Schneider (2000); Sanchez et al. (2009) and others have paid great attention to the definition of intellectual capital, as well as its composition and dimensions. A number of Russian scientists, such as Inozemtsev (1998); Leontieva and Leontiev (2015); Shakhovskaya (2004) and others, can also be seen as the founders of this category.
The requirements of modern production and the level of competition brought to the forefront not only the labour force, but also its main characteristics – intelligence, on the one hand, and knowledge and information, on the other hand – as the main strategic resources of economic activity. Together, these factors represent the core of intellectual capital.
The main directions of determining the structure of intellectual capital were used in relation to organizations. Modern economic practice approaches the definition of intellectual capital from the standpoint of the allocation of its three elements: human, structural, and market capital. It is also possible to select only two of its elements: human and structural. There is no fundamental difference between the two approaches.
Both of these approaches fairly accurately reflect the essence of intellectual capital. In the case of the allocation of the third element – market capital or consumer capital – the system of organization of interrelations of the company is subjected to a more detailed analysis. In this case, structural capital characterises the internal environment, and market capital characterises the external environment.
There is no doubt that both approaches have the right to exist, since each of them provides certain opportunities for the researcher. In the first case, a greater number of elements makes it possible to diversify management methods and assess intellectual capital, which is obviously in demand at the enterprise level. In the second approach, it becomes possible, due to the consolidation of elements, to more clearly examine the mechanism of reproduction and movement of intellectual capital.
Purpose of the Study
World experience shows that countries and regions engaged in the development of human, scientific, technological, and production potential in promising areas of the formation of an innovative economy receive fundamental competitive advantages, the realization of which allows economic entities (regions, industries, enterprises) to ensure sustainable growth. At the same time, the speed of transition to a new type of social reproduction and the efficiency of the functioning of the innovative economy are determined primarily by the intensity of the deployment of innovation processes, the formation of an adequate institutional environment, and the planning of the intellectual capital development at the regional level. The transition from a raw material economy to an economy of knowledge and innovation, characterised by an increase in the share of high-tech production in gross domestic product (GDP), creates the need for research and measurement of the ICR and analysis of the conditions for its formation (Dubina & Ostashchenko, 2016).
Purposeful formation of the intellectual capital of the region, bringing the state in line with the needs of the development of the socio-economic system, is a complex process that requires appropriate scientific study. One of the important areas of research for ICR is the search for new methods and tools for assessing the state of intellectual capital in the region, identifying and systematizing the factors influencing the formation of intellectual capital.
Research Methods
To assess the intellectual capital of a region, we propose a method according to which the indicators characterizing the main components of the region’s intellectual potential are determined at the first stage of the analysis. The method involves the determination of the estimated points of the region according to the values of each of the indicators characterizing various aspects of the socio-economic attractiveness of the regions.
The indicators that were determined to assess the state of intellectual capital are grouped. Indicators of educational potential characterise the totality of knowledge, skills, abilities, and opportunities provided by education for the most effective functioning of the region’s socio-economic system. The group of indicators of educational potential includes:
- (Е1) the share of the employed population with higher education;
- (E2) the share of education expenditure in GRP; and
- (E3) the number of university students per 10,000 population.
The next group is indicators of social well-being, which characterise the efficiency of the social sphere, a reflection of social sphere, the level of well-being, and the quality of life of the population. In other words, this group of indicators may be a criterion of the effectiveness of regional policies. This group includes the following indicators:
- (SW1) the Gini coefficient is a statistical indicator of the degree of stratification of a region’s society in relation to any studied trait. The Gini coefficient varies from 0 to 1. The closer its value is to zero, the more evenly the indicator is distributed. Most often, in modern economic calculations, the level of annual income is taken as the characteristic under study. The Gini coefficient can be defined as an indicator characterizing the differentiation of the population’s monetary income in the form of the degree of deviation of the actual distribution of income from their absolutely equal distribution among the inhabitants of a country; and
- (SW2) unemployment rate.
The indicators of scientific potential characterise individual and material factors that ensure the circulation of scientific knowledge in the national economy for the creation of high-tech systems and their distribution in mass production. These include:
- (S1) the number of researchers per 1000 people employed in the economy;
- (S2) the share of domestic expenditure on R&D in the GRP; and
- (S3) the number of employees performing research. This indicator more fully reflects the picture in working with R&D.
The group of information and communication indicators characterises the equipment of the region with information and communication technologies, since the organization of open interaction and the development of the e-economy are impossible without the use of modern means that directly provide all the necessary operations for processing, transmitting, or providing information. This group includes such indicators as:
- (IT1) the number of personal computers per 100 employees;
- (IT2) the proportion of computers with Internet access; and
- (IT3) the number of organizations using information and communication technology (ICT). This indicator more fully discloses the work of organizations with information and communication technologies.
Indicators of relational capital characterise the relations of the system with the external environment, considered as part of its total capital – the region’s involvement in international processes and attractiveness for investments and joint projects. These include:
- (R1) capital investment per capita, i.e. a set of costs aimed at the acquisition, creation, and reproduction of fixed assets;
- (R2) the number of advanced production technologies used;
- (R3) number of advanced manufacturing technologies created; and
- (R4) the proportion of innovative goods, works, and services in the total volume of goods, works, and services.
At the second stage, the selected indicators are converted into a comparable form using the linear scaling method used in calculating the human development index.
At the feedback connection of the estimated indicator, the calculation was made according to the following formula:
.(1)
At a direct connection of the estimated indicator, we used the formula:
, (2)
where is the index of intellectual potential;
is the actual value of the i-th indicator;
and are the maximum and minimum values of the indicator in the period under consideration among all the studied regions;
is the number of indicators.
At the third stage, five intermediate indices are calculated using the arithmetic average method of the relevant indicators: the educational potential index (EPI), the social welfare index (SWI), the scientific potential index (SPI), the information and communication component index (ITC), and the relational capital index (RCI).
At the fourth stage, we determined the weight of the coefficients by the method of expert evaluation for calculating the integral index of intellectual potential.
The integral index of the intellectual potential of a region (IP) was calculated using the method of weighted arithmetic average of intermediate indices. The weight of the coefficients was determined on the basis of expert evaluation:
(3)
where is the educational potential index;
is social welfare index;
is scientific potential index;
is information and communication component index;
is the relational capital index.
Findings
The assessment of the level of intellectual capital of the Republic of Buryatia (Figure 1) shows that during the analysed period, there was a change in the value of this indicator in the direction of growth and decrease. These dynamics are associated with changes in indicators of social well-being, relational capital, and educational potential. At the same time, it can be noted that the indicators of the information and communication component have stability, since over the period from 2009 to 2017 the value of this group of indicators has not changed and was equal to one.
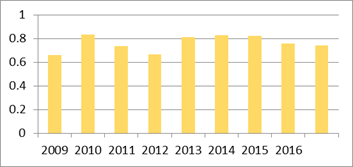
Indicators of educational potential throughout the analysed period show different values. In 2011, the value of this group of indicators reached its peak, and was equal to 1. Subsequently, in 2012, a decline is already observed, which is due to a decrease in the indicator of “The share of the employed population with higher vocational education”. In 2012, a decrease of 0.13 compared with 2011 is observed. It can be argued that this decrease occurred because of the decline in the share of expenditure on education in GRP almost three times. Also, the share of the employed population with higher education decreased by 0.09, and the number of students at 10,000 of the population also decreases. By 2014, this indicator has grown to 0.78, but this position cannot be maintained by 2016, where the value of this group of indicators is 0.67 (one of the lowest values during the study period). This is due to a sharp decline in such indicators as “The share of expenditure on education in the GRP” and “The number of university students per 10,000 population”.
Indicators of social well-being have more favourable dynamics. In 2011, there is also a peak in the value of this group of indicators equal to 1. The values of this group of indicators do not fall below 0.49 throughout the study period, with the exception of 2012, where the intermediate index value was 0.11. This is due to the high level of such indicators as the Gini coefficient and the unemployment rate in 2012. In general, the picture of the group of indicators of social well-being is not entirely favourable. In 2017, the value of the intermediate index of this group was equal to 0.58, given the fact that the maximum value is equal to 1.
Indicators of scientific potential also have a favourable environment. From 2010 to 2013, the value of this intermediate index did not rise above 0.7, which cannot be said about 2014, when the value of the index rose to 0.84. In 2016, the value of the intermediate index of indicators of scientific potential reached its peak, equal to 1. By 2017, however, the value drops to 0.84, which is associated with a decrease in the number of organizations performing research and development.
There is a positive trend in the dynamics of relational capital, except for the value of the intermediate index of this group of indicators in 2013. This value was the minimum for the entire analysed period in 2013: 0.32. This decline is associated with a sharp drop in such indicators of this group as “The number of used advanced technologies”, “Total patents granted for intellectual property” and “The share of innovative goods, works and services in the total volume of goods, works and services”. In 2012, however, we can already see that there was an increase in the intermediate index of the group of indicators of relational capital, which continued until 2017. Such indicators as “The share of innovative goods, works and services in the total volume of goods, works and services” and “Total patents issued for intellectual property” have grown.
Thus, the evaluation of intellectual capital as a “super-integral” concept, combining economic, financial, social, and other components, reflects the general state of the socio-economic situation in the region. Despite the fact that the assessment showed a high result, the standard of living in the Republic of Buryatia remains at a low level, which indicates that the existing potential is not fully realised. The analysis showed that it is necessary to pay attention to the educational potential, indicators of social well-being, and relational capital.
In order to determine the position of the Republic of Buryatia among the regions of the Siberian Federal District (SFВ) in terms of the level of intellectual capital, we conducted a ranking of the regions of the SFВ using a comparative analysis. This analysis allowed us to compare the indicators of the state of intellectual capital of the Republic of Buryatia with larger regions.
Intermediate indices of groups of indicators for assessing the state of the intellectual capital of the region, as well as the integral index of the intellectual capital of the region, were compared. Consideration should be given to the population size of each of the regions because the values of indicators relative to the size of the population can have different effects on the region. This method provides an opportunity for a qualitative assessment of regions according to the considered attribute in the form of a definition of common features or specific differences between the regions under consideration.
Comparative evaluation of intellectual capital should be carried out on the basis of a method that allows for accurate and informative – both qualitative and quantitative – characteristics. Quantitative characteristics assume the most accurate result of a formalised measurement procedure for the selected system of indicators. The qualitative characteristic is reflected in the establishment of interrelations between the economic activity of the region and the result obtained. In this and in another case, the accuracy of the assessment determines the information content of the statistical data of the selected method. As analysed above, the method of calculating the integral index of intellectual capital (IIIC) was the most informative, and therefore objective in the results obtained.
At the first stage of the comparative analysis, we filled out data tables for the selected system of indicators by regions of the SFD.
At the second stage, the calculation of the integral index of intellectual capital for 2017 by the selected method was performed. The regions were ranked according to the results obtained after the calculation.
The ranking of the regions suggests that the Republic of Buryatia is one of the most capital-rich regions in the field of intellectual capital and ranks 7th in the rating.
The Krasnoyarsk region is in the first place, with IIIC equal to 0.94, and the Republic of Altai occupies the last place, with the IIIC equal to 0.46, as shown in Figure 02.
Comparison of regions by the components of intellectual capital, as well as by the nature of these components, allows us to identify the following types of regions: prosperous, capital-rich, and disadvantaged.
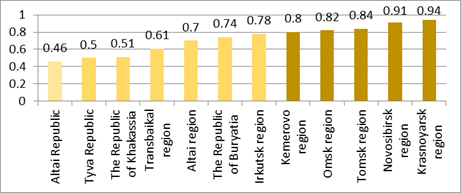
The integral index (II) of prosperous regions is over 0.8. These regions include the Krasnoyarsk Region, Novosibirsk Region, Tomsk Region, Omsk Region, and Kemerovo Region. Figure 2 represents regions with a high index of educational and scientific capital, which is due to a dense network of educational institutions and research institutes, and as a result, they have a large number of students and a high personnel component. Unlike other regions, the number of students in higher educational institutions in the Krasnoyarsk region, the Novosibirsk region, the Tomsk region, and the Omsk region did not decline from 2012 to 2017. Also, an analysis of scientific capital has shown that there is a continuous increase in the number of researchers and the absence of a reduction in the budgeting of R&D in these regions.
The integral index of the capital-rich regions ranges from 0.5 to 0.8. This group includes such regions as the Irkutsk Region, the Republic of Buryatia, the Altai Region, the Trans-Baikal Region, the Republic of Khakassia, and the Republic of Tyva. These regions have high indicators of the information and communication component and average indicators of the level of social well-being. However, at the same time, these regions have low rates of educational and scientific capital, which indicates problems in the field of education and science. The development of intellectual capital is impossible in the presence of a shortage of human resources, even in the conditions of active development of the material and technical base.
The integral index of disadvantaged regions is below 0.5. This group includes the Altai Republic. This region is characterised by a small number of universities and a low index of educational capital, which in turn affects the low rates of scientific and innovative capital of the region. This characteristic entails the absence of both established and used advanced production technologies. Therefore, it is necessary to update the role of universities in the formation and development of the intellectual capital of the region. Universities should play a role at the centre of a system that forms a technological and sociocultural structure based on building up intellectual capital.
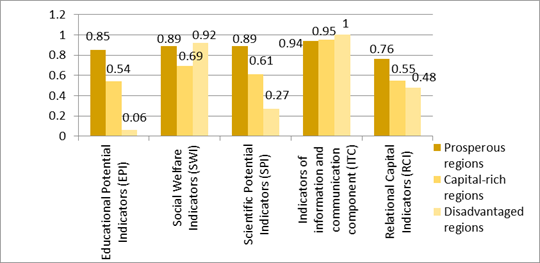
A more detailed assessment of the main components of intellectual capital in the regions of the Siberian Federal District showed that those regions that have high indicators of social well-being have a correspondingly high level of educational and scientific capital. The standard of living of the population of a region determines its development in all spheres, including the sphere of the formation and development of intellectual capital (Figure 3).
Gross regional product per capita occupies a central place among the indicators of the socio-economic development of the region. The numerical value of GRP per capita makes it possible to characterise the scale and efficiency of the regional economy, to identify and support problem regions, and to stimulate the further development of prosperous regions. When calculating the GRP per capita, data of all types of economic activity in which the region is engaged is used. Therefore, it most fully reflects the socio-economic situation in the region.
To conduct a full economic and statistical analysis and determine the degree of dependence of GRP per capita and the IIIC of the regions, it is necessary to carry out a one-factor correlation-regression analysis between these factors.
In the process of conducting a correlation-regression analysis between such factors as the volume of GRP per capita (roubles) and the value of the integral index of intellectual capital (units), we took the volume of GRP as the dependent variable x and IIIC as the independent variable y. In other words, we need to determine how the quality of life of the population, expressed by an indicator such as GRP per capita, affects the amount of intellectual capital in the region.
The estimated regression coefficients are:
b1=0,0000012and b0= -31564.(4)
Thus, the constructed model can be written in the form:
y= -31564 + 0,0000012x.(5)
The coefficient b1 shows that the level of intellectual capital will increase by 0.0000012 units with a change in the volume of GRP per capita by 1 rouble.
The correlation coefficient (r) and the coefficient of determination (D) are equal to:
r= 0.72 and D=52%.
The correlation coefficient is quite high. This indicates a significant relationship between the volume of GRP per capita and the level of development of intellectual capital. The coefficient of determination is also quite high. It shows that the level of intellectual capital is explained by the volume increase of GRP per capita by 52%.
The value of the actual Fisher’s F-test equals:
Factual= 10.86.
When comparing it with F1, 10 = 5 for the 95% significance level. Therefore, we can argue that the model is adequate.
The student's t-test is:
tcalcul.= 3,14.
After comparing the calculated indicators with a table value equal to t10;0,05=2,23 we can talk about the statistical significance of the regression coefficients.
Conclusion
Thus, the obtained results confirmed our assumption that the active and productive realization of intellectual capital is impossible without creating and maintaining a high level of quality of life for the population. Taking into account the synergistic effect of the concept of intellectual capital, it is necessary to create a comprehensive programme for the development of the region and ensure a high level of investment in its core areas, as well as effective mechanisms for managing and implementing this program.
Purposeful formation of the intellectual capital of the region, bringing the state in line with the needs of the development of the socio-economic system, is a complex process that requires appropriate scientific study. One of the important areas of research in the intellectual capital of the region is the search for new methods and tools for assessing the state of the ICR, identifying and systematizing the factors influencing the formation of intellectual capital.
In modern conditions, intellectual capital can become the most important factor in overcoming difficulties and bringing high-tech companies into a new stage of development.
Evaluation and management of the intellectual capital of the region will allow us to identify the factors of development, improve the management of intangible assets, increase innovation activity, and more carefully treat human capital and its development.
References
Al-Shubiri, F. N. (2013). The impact of Value Added Intellectual Coefficient components on financial health. Review of International Comparative Management, 14, 459-472.
Bontis, N. (1998). Intellectual capital: an exploratory study that develops measures and models. Management Decision, 36(2), 63–76.
Brooking, E. (Trans.) (2001). Intellectual capital: A translation of N. Kovalik. Saint-Petersburg: Piter.
Bronisz, U., Heijman, W., & van Ophem, J. (2012). The assessment of intellectual capital in Polish regions. Applied Studies in Agribusiness and Commerce, 1-2, 101-105.
Buzan, T. (2013). Mind Maps for Business: Using the ultimate thinking tool to revolutionise how you work. London: FT Press.
Chun-Yao, T., & Yeong, J. (2005). Intellectual capital and corporate value in an emerging economy: empirical study of Taiwanese manufacturers. R&D Management, 2, 187-202.
Dubina, I. N., & Ostashchenko, T. V. (2016). Evaluation of the intellectual capital of the region: tasks, methods, tools. Problems of Management, 4, 140-149.
Edvinsson, L., & Malone M. (1997). Developing Intellectual Capital in Scandia. Long Range Planning, 30(3), 366-373.
Edvinsson, L., & Malone, M. (1999). Intellectual capital. In V.L. Inozemtsev (Ed.), New post-industrial wave in the West. Anthology (pp. 335-351). Academia.
Inozemtsev, V. L. (1998). Outside the Economic Society. Academia-Nauka.
Kaplan, R. S., & Norton, D. P. (2005). Balanced scorecard. From strategy to action. Olimp-Business.
Kozyrev, A. N., & Makarov, V. L. (2003). Valuation of intangible assets and intellectual property. Interreklama.
Leontieva, V. B., & Leontiev, B. B. (2015). Evaluation of intellectual property in terms of import substitution. Patents and licenses. Intellectual rights, 1, 56-61.
Levashov, V. K. (2008). Intellectual potential of society: sociological measurement and forecasting. Monitoring of public opinion, 3, 17-30.
Levashov, V. K., & Rutkevich, M. N. (2000). On the concept of intellectual potential and methods of its measurement. Science Studies, 1, 49-65.
Lukicheva, L. I. (2007). Intellectual capital management. Omega-L.
Mahbub Ul Haq. (1995). Reflections on Human Development. Oxford University Press.
Means, G., & Schneider, D. (2000). Meta-Capitalism: the e-business revolution and the design of 21st century companies and markets, John Wiley & Sons.
Poltorak, A., & Lerner, P. (2004). Fundamentals of Intellectual Property. Williams.
Saktoev, V. E., & Khaltaeva, S. R. (2011). State innovation policy: implementation mechanism. Russian Entrepreneurship, 12(4), 26-30.
Saktoev, V. E., Khaltaeva, S. R., & Tsyrenova, A. A., (2018). Estimation of intellectual capital as a basis of management. Bulletin of the east siberian state university of technology and management, 1(68), 80-87.
Sanchez, P., Elena, S., & Castrillo, R. (2009). Intellectual capital dynamics in universities: a reporting model. Journal of Intellectual Capital, 10(2), 307-324.
Shakhovskaya, L. S. (2004). Marketing of educational services. Volgograd: RPK "Polytekhnik".
Sitnova, I. A. (2007). Economics of Knowledge and Institutional Environment, Scientific Works of DonNTU. Economic Series, 31(1), 181-186.
Sveiby, K. E. (2001). Measuring Intangibles and Intellectual Capital. In D. Morey, M. Maybury and B. Thuraisingham (Eds). Knowledge Management: Classic and Contemporary Works. Cambridge, MA: MIT Press.
Copyright information

This work is licensed under a Creative Commons Attribution-NonCommercial-NoDerivatives 4.0 International License.
About this article
Publication Date
01 July 2021
Article Doi
eBook ISBN
978-1-80296-112-6
Publisher
European Publisher
Volume
113
Print ISBN (optional)
-
Edition Number
1st Edition
Pages
1-944
Subjects
Land economy, land planning, rural development, resource management, real estates, agricultural policies
Cite this article as:
Tsyrenova, А. A., & Haltaeva, S. (2021). Integral Assessment Of The Intellectual Capital Of The Region. In D. S. Nardin, O. V. Stepanova, & V. V. Kuznetsova (Eds.), Land Economy and Rural Studies Essentials, vol 113. European Proceedings of Social and Behavioural Sciences (pp. 724-735). European Publisher. https://doi.org/10.15405/epsbs.2021.07.87