
The Usage Of Electronic Atlases In Teaching At A Higher Educational Institution


Abstract
This article discusses the usage of electronic atlases in teaching technical disciplines through the elements of geoinformation technologies, databases, and environments of high-level programming languages; creating a central node for publishing spatial data; managing research works; organizing students’ group work on spatial data; creating students’ spatial resources and providing access to them. The example of electronic atlases usage to support the learning process, which affects the stages of the software life cycle, is shown. When creating an electronic pollution source atlas of enterprises of the town of Birobidzhan, located in the Jewish Autonomous Region, data from the environmental passports of enterprises of the heat and power complex were taken into account. The process of building electronic atlases included the following stages: analysis of models for assessing atmospheric air quality and its parameters; design of a database of enterprises and emission sources; creating Spatio-temporal queries based on various criteria; building thematic maps of the urban area and exporting the results of Spatio-temporal queries. Verification of electronic atlases creation process was carried out among the junior and senior students of the specialty of "Information Systems and Technologies" at Sholom-Aleichem Priamursky State University in the course of study of the disciplines "Network Database Programming" and "Corporate Information Systems". The attribute and spatial database management system consisted of Microsoft Access and MapInfo Professional 15 software products. Students created author's client-server applications, designed and implemented electronic atlases for monitoring the movement of public transport, the location of tourist sites, trading centers, etc.
Keywords: Electronic atlas, educational process, information and educational environment, geoinformation technologies, education, higher educational institution
Introduction
During the educational process realized in a higher educational institution, there is an increased tendency to use geographical information systems, which allow processing large arrays of attribute data and visually displaying their spatial and temporal relationships (Avdić et al., 2020; Rakhmatullayev et al., 2018). Geographical information systems, as a means of teaching, contain both developing and informational components and perform the functions of visual aids. This is largely due to the teacher's attempt to demonstrate the possibility of operational construction of not only electronic reports and tables of natural and socio-economic objects and phenomena, but also the formation of atlases using modern tools for analytical data processing.
Problem Statement
It is generally accepted that most of the electronic atlases used in the educational process correspond to the tools of web-based systems and information and educational standards. Some of these tools are spatial services Yandex and Google; however, the development of the author's data visualization allows the student to fully master all the stages of the life cycle of an electronic Atlas. They include obtaining a new information product for building thematic maps, editing them, updating and rebuilding them to zone the territory, studying the dynamics, combining natural and anthropogenic phenomena, and socio-economic characteristics.
Research Questions
The problems of using electronic atlases in Russian and International teaching practice, building the life cycle of electronic atlases, teaching design, implementation and visualization of atlases in various subject areas, multi-sided data visualization, as well as evaluation of the effectiveness of using electronic atlases in the course of teaching technical disciplines to students were solved within the framework of this research work.
Purpose of the Study
By information-educational standards of an educational organization of higher education, we understand the complexities of educational, technical, organizational, managerial components of institutions of higher education, providing rapid access to necessary information and organizing the subject-to-subject communication between the participants of the educational process (Sanders et al., 2001). Spreadsheets, graphs, maps, and atlases are used in the implementation of the educational process. Electronic atlases perform various educational functions: they visually demonstrate information in the course of study of geographic information technologies; reflect information about the location of environmental objects on the earth's surface; reflect the placement and characteristics of objects and their development in spatial-temporal aspect with the help of symbolic language; and perform psychological and pedagogical support in presenting, learning and remembering information.
Research Methods
The following methods were used to carry out this research: the logical-didactic analysis of the construction of electronic atlases, the analysis of technical documentation of various instrumental geographical information systems, the analysis of existing experience in the use of information technologies in technical subjects, and the comparative analysis.
Findings
According to the updated definition of information and educational standards, it is necessary to describe the components of this set of tools. Thus, the software tools advised for information and educational standards consist of platforms to support the educational process. Technical devices including local networks, servers, and computers refer to the equipment of an educational organization of higher education. Teaching tools consist of developed teaching aids to support the educational process (educational-methodical complexes of disciplines, etc.). Organizational and managerial components relate to the system of the administrative organization of the information and education standards that are specified by regulatory documents of the Federal and local levels (Federal Law on Education, Federal State Standard of Higher Education, regulations on the use of information and educational standards of educational institution of higher education).
According to the standard of the educational organization of higher education, information technologies are used to create indirect interaction between the teacher and the student in the educational process (Yelena, 2011). With an objective scope of application (communication, work with user groups), the implementation of electronic atlases can organize indirect work with students. Teachers at Sholom-Aleichem Priamursky State University use electronic atlases in the educational process in the following cases: creating a central node for publishing spatial data; managing research work (Bond et al., 2020); organizing students ' group work on spatial data (Medyckyj-Scott & Morris, 1997); creating their spatial resources and providing access to them (Johansson, 2003).
Thus, the usage of electronic resources as support tools in the educational process seems vital and efficient.
Testing of the electronic atlas implementation was carried out in the course of technical subjects taught to bachelor students. During the study, the life cycle of the process of creating an electronic atlas of pollution sources of Birobidzhan enterprises was considered. When constructing the atlas, the data of environmental passports of enterprises of the heat and energy complex were taken into account. The stages of building electronic atlases included the analysis of models for assessing atmospheric air quality and its parameters; designing a database of enterprises and emissions sources; building the atlas on the example of the urban area of Birobidzhan.
A mathematical model of impurity scattering in the atmosphere from stationary and mobile sources of pollution was used to make the electronic atlas. This model has received the status of a regulatory document OND-86 for use by various government agencies at all levels in carrying out design and control calculations (Rybak & Ryabichina, 2020), compiling consolidated volumes of maximum permissible emissions for enterprises and entire territories. The management of the attribute part of the data in the Spatio-temporal assessment of atmospheric air pollution was performed based on the Microsoft Access database management system (Glagolev et al., 2020). Support for the database management system is built into the Mapinfo Professional geographic information system tool (Korol et al., 2020), so data integration is achieved with the help of geographic data providing data processing in the context of spatial proximity and thematic data identification key. Thus information is transferred from the database to the vector layers of the geographic information system using the geographical key. The logical structure of such attribute and spatial data is presented in the form of an E-R diagram (Karimian & Kabolizadeh, 2020) describing the data schema and table components of a relational database (Figure 1).

The developed relational database for the electronic atlas includes 6 tables: "Enterprises", "Production", "Products", "Sources of pollution", "Pollutants". Tables are linked using primary and foreign keys. The primary key defines unambiguous non-repeating entries in the tables: "Enterprises", "Production", "Products", "Sources of pollution", "Pollutants". The foreign key links the above-listed tables by key in the "Volume of emissions" table.
With the help of an electronic atlas, territories with the different atmospheric air quality of the urban area are displayed. The main sources of pollution in the town of Birobidzhan are represented by three complexes: industrial enterprises; road transport; a combined heat and power plant with a system of boiler houses. The first two complexes can be considered stationary, and the third complex is characterized by intensive intra-annual dynamics: the winter period of major pollutants emissions exceeds the summer period. The register of pollutants of the database includes a description of 178 elements, which include oxides of nitrogen, sulfur, carbon, heavy metal compounds; acids; hydrocarbons, solids. The main source of pollution throughout the year is the Birobidzhan combined heat and power plant, and in winter the boiler houses are added to the list.
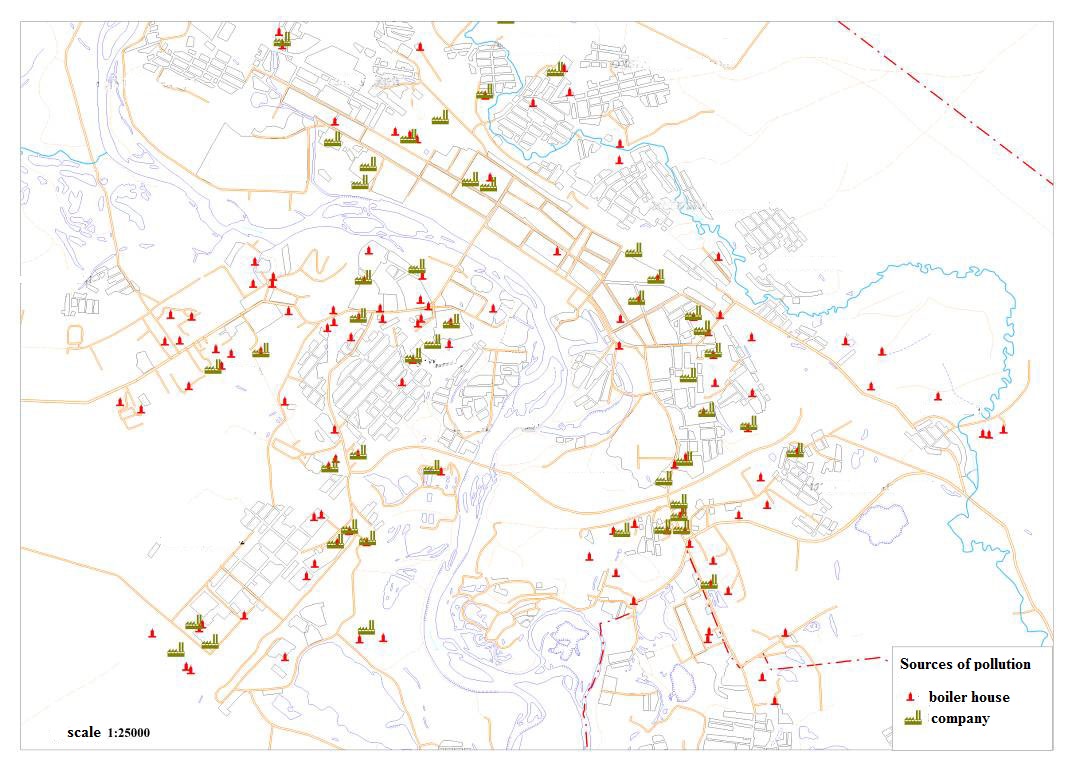
The database contains data from 50 environmental passports of the town's enterprises; this information includes data on the sources of pollution (production) and the volume of their emissions: boiler houses, garages, gas stations, workshops, etc. Data for calculations of atmospheric air pollution are collected concerning 31 boiler houses (Figure 2).
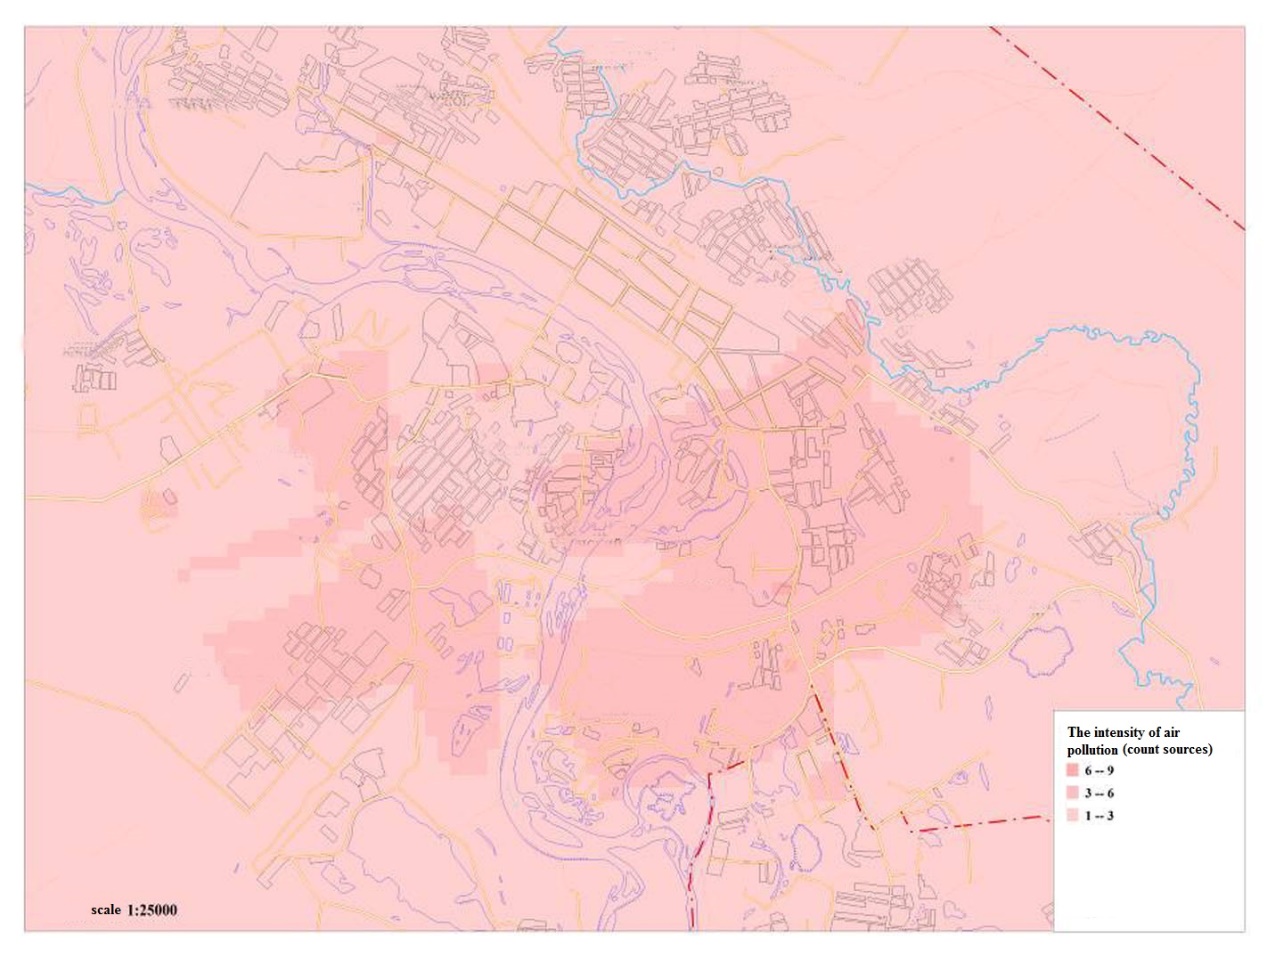
To build maps of the distribution of pollutants in the atmospheric air, according to the OND-86 method, the town territory was divided into operational-territorial units (OTU) with a size of 100x100 meters. For each source of pollution, a polygon (qualitative assessment) or a circle (quantitative assessment) was created, in the area of which the maximum emissions were achieved. Further, this polygon was divided into a set of OTU located in it to calculate the number of sources of pollution or the concentration of pollutants in a given OTU. The obtained electronic maps of atmospheric air pollution in summer and winter are presented below. The intensity of pollution was understood as the number of sources of pollution that had the maximum emissions on a site of the territory. In summer, atmospheric air pollution was observed from 9 sources in the micro districts "Sopka", "Birobidzhan-2", "Partizansky", "Microdistrict-A", "Tukalevsky", intensive qualitative pollution of the urban area was not traced (Figure 3). Most of the pollution was caused by the Birobidzhan combined heat and power plant.
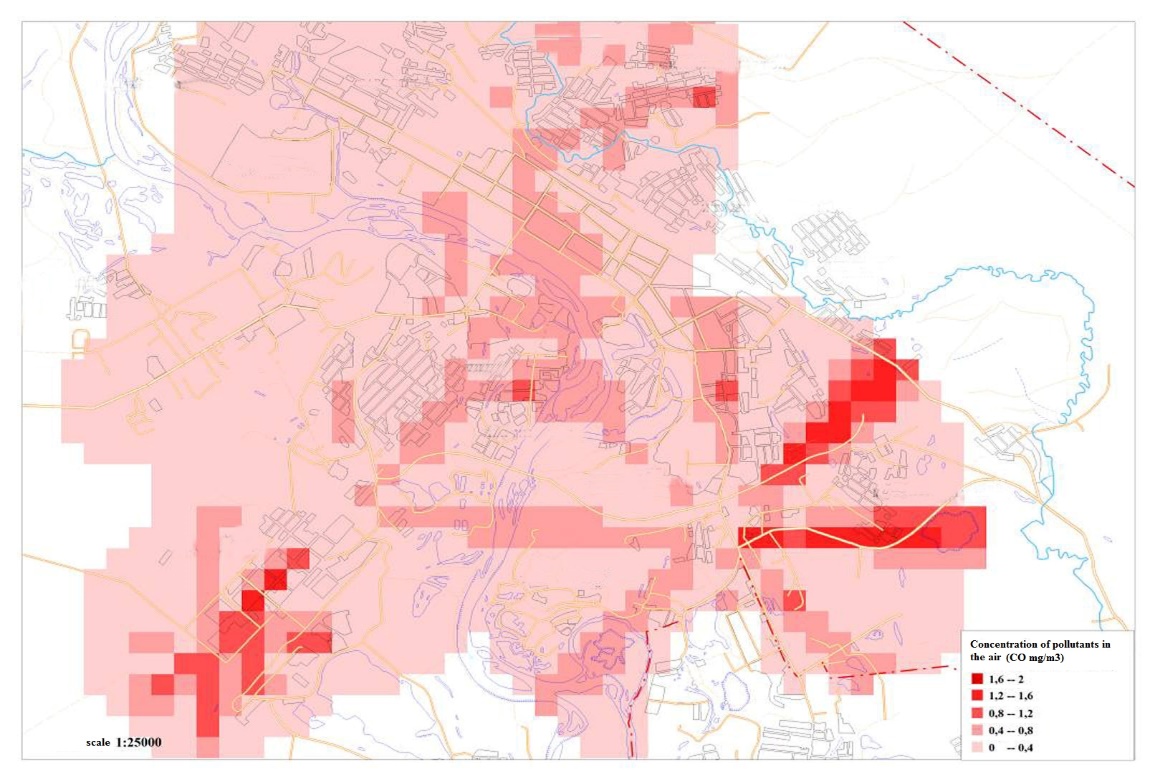
The maximum air pollution of the urban area in winter was observed in two districts: "Zarechye" and "Partizansky". About 24-29 sources of pollution were concentrated in this area. The background concentration in wintertime prevailed in the micro districts "Birobidzhnan-2 "and" Myasokombinat", the calculated concentrations were 5 times higher than the MPC (Figure 4).
The simulation of air pollution in the urban area helped to detect districts, located on the right bank of the river Bira: Tretiy Mikrorayon», «Mikrorayon A», «Zheleznodorozhnyy» and «Kirpichi». Air pollution sampling points should be located in the micro districts "Birobidzhan-2", "Zarechye", "Meat Processing Plant", "Partizansky" and "Fibralit za Ikura". Verification of the process of creating electronic atlases was carried out among junior students in the specialty "Information Systems and Technologies" in 2017, when 12 students studied the discipline "Network Database Programming". The students completed the author's information systems; as a result, they designed and implemented electronic atlases for monitoring the movement of public transport, the location of tourist sites, trading centers, and social event places. The integration of web resources and network databases, as well as the development of mobile applications on Android, were actively used.
Conclusion
Thus, the use of electronic atlases in the course of the discipline "Network Database Programming" allows the teacher to link the knowledge obtained in various areas of visualization not only of attribute queries but also to increase students’ interest in solving the construction problems of space-time queries and encourage them to acquire new information, ergonomics skills and knowledge of the system in an aesthetic, easy-to-view and logically structured form.
References
Avdić, B., Drešković, N., & Mirić, R. (2020). Attitudes among geography teachers in Bosnia and Herzegovina toward geospatial technology use: Gender, age and regional differences. Geographica Pannonica, 24(2), 136-146.
Bond, M., &Buntins, K., &Bedenlier, S., &Zawacki-Richter, O., & Kerres, M. (2020). Mapping research in student engagement and educational technology in higher education: A systematic evidence map. International Journal of Educational Technology in Higher Education, 17(1), 2.
Glagolev, V., Bazhenov, R., Povkh, I., Chuyko, O., & Dolmatova, O. (2020). Designing and producing a geographic information system to forecast vegetation fire danger according to weather conditions. IOP Conference Series: Materials Science and Engineering, 862(5), 052019.
Johansson, T. (2003). GIS in Teacher Education-Facilitating GIS Applications in Secondary School Geography. ScanGIS, 285-293.
Karimian, R., & Kabolizadeh, M. (2020). Designing a Conceptual Model for Geochemical Geodatabase of Oil Wells: A Case Study of Gachsaran Oilfield. Journal of Advanced Applied Geology. https://aag.scu.ac.ir/article_15914.html
Korol, O. M., Kornus, O. H., & Kornus, A. O. (2020). Peculiarities of Using Geoinformation Systems in Training of Future Geography Specialists in Higher Education Institutions. Chasopys sotsialno-ekonomichnoi heohrafii, 2(10), 35-42.
Medyckyj-Scott, D., & Morris, B. (1997). The virtual map library: Providing access to Ordnance Survey digital map data via the WWW for the UK higher education community. Computers, environment and urban systems, 21(1), 31-45.
Rakhmatullayev, A., Mamajanov, R., Meliev, B., & Baratov, X. (2018). The use of geographic information systems in mapping landscapes. European science review, (5-6), 60-63.
Rybak, V. A., & Ryabichina, O. P. (2020). Ecological monitoring system of the atmosphere. Doklady BGUIR, 18(4), 36-43.
Sanders, Jr. R. L., Kajs, L. T., & Crawford, C. M. (2001). Electronic mapping in education: The use of geographic information systems. Journal of Research on Technology in Education, 34(2), 121-129.
Yelena, R. (2011). Opportunities for studying cultural landscapes in the Kaliningrad region. Baltic Region, 3(1), 101-110.
Copyright information

This work is licensed under a Creative Commons Attribution-NonCommercial-NoDerivatives 4.0 International License.
About this article
Publication Date
21 June 2021
Article Doi
eBook ISBN
978-1-80296-110-2
Publisher
European Publisher
Volume
111
Print ISBN (optional)
-
Edition Number
1st Edition
Pages
1-1168
Subjects
Social sciences, education and psychology, technology and education, economics and law, interdisciplinary sciences
Cite this article as:
Aleksandrovich, G. V. (2021). The Usage Of Electronic Atlases In Teaching At A Higher Educational Institution. In N. G. Bogachenko (Ed.), Amurcon 2020: International Scientific Conference, vol 111. European Proceedings of Social and Behavioural Sciences (pp. 311-317). European Publisher. https://doi.org/10.15405/epsbs.2021.06.03.42