
Dynamics Of Titular Ethnic Groups Of Bordering States In Russian Regions


Abstract
The article considers trends of the ethnic structural modification of population in the regions of the Southern border zone of Russian Asia. It focuses on absolute and relative increase in titular ethnic groups of bordering states (Kazakhs, Chinese, Mongols, Koreans). The study period is a so-called post-Soviet period, the research basis - data of the All-Union and All-Russian population census 1989 and 2010, correspondingly.
Keywords: Ethnical content of population, titular ethnic group, Russian Asia, Southern bordering entities
Introduction
The territorial specifics of demographic processes in Russian regions is the relevant area of the modern geographical research. The papers by Balina et al. (2019), Garipov (2015) are devoted to its detection. The modern trends of ethnical transformation of Russian population are shown in research works by Safronov (2015), Manakov (Manakov, 2016; Manakov, 2019a, Manakov, 2019b). The characteristics of ethnical diversity of the Russian regional population using the geoinformation mapping are shown in works by A.N. Pelina and others. Many authors note the relevance of the ethnical processes study, conduct the detailed analysis of their individual features on bordering territories (Manakov, 2020; Manakov & Klimask, 2020; Zotova, 2018). The focus is on the spatial analysis of the effect the new state borders, emerged after the collapse of the Soviet Union, have on the population migration at both sides (Akhmetov et al., 2020).
Problem Statement
The demographic potential of regions is formed by multiple factors. In its turn, it forms specific prerequisites for social and economic development of states that is especially important under the conditions of activated international economic integration process as one of major development trends in the modern global economy. The opposite side of this process is so-called erasion of state borders that make some researchers anxious in regard to preservation of identities in contacting areas including the ethnic and cultural components (Dirin & Fryer, 2020). The analysis of spatial aspects of ethnic processes within Russian bordering areas during the post-Soviet period is important not only for the specification of theoretical ideas about their dynamics but also relevant in regard to the arrangement of the international and intern-ethnic interaction. In this regard, the dynamics of this process is of interest.
Research Questions
The time span of our study falls within the period between population censuses of 1989 and 2010. Geographically, it includes eleven Southern bordering regions of Russian Asia — the large block within Siberian and Far Eastern Federal Districts (Posdnyakova, 2019). The subject of the study is the dynamics of titular ethnic groups in the bordering states. They include Kazakhs, Chinese, Mongols and Koreans (not considering the division between two states).
Purpose of the Study
The purpose of the study is to detect major activity trends of titular ethnic groups in bordering states at the Southern borders of Russian Asia during the post-Soviet period.
Research Methods
The research is based on the analysis of statistic data about the number and ethnicities of the population obtained during the All-Union and All-Russian population censuses in 1989 and 2010, correspondingly.
Findings
According to the census materials under analysis, the number of population in regions of the Russian Federation included into the Southern border zone of Russian Asia decreased 0.3% (All-Union population census, 1989; All-Russian population census, 2010). However, the number of bordering state representatives grew by more than 20 thousand people or 13%. While in 1989 the share of ethnic groups under study in the number of population from the bordering regions of Russian Asia was 1%, in 2010 this value reached 1.15%. According to the data of 1989, the most numerous of the Southern bordering peoples residing at the area of contact Russian Federation entities are Kazakhs — about 119 thousand people, and the least numerous are Mongols, 63 people (Borisov, 1989). By 2010, the number of these ethnic group representatives changed but each of them retained their position in the rating shown (Figure 1).
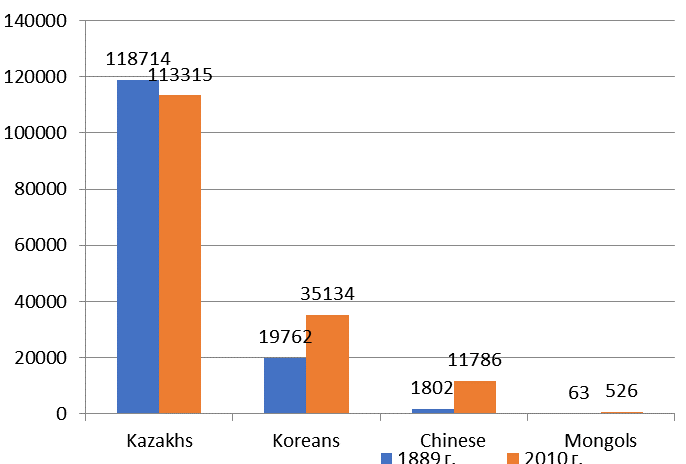
At this, the dynamics of the number of titular ethnic groups in bordering states was not the same. Thus, the number of Kazakhs during the period under consideration within the Southern border zone of Russian Asia decreased 4.5%. On the contrary, the number of other ethnic groups grew: Koreans — almost by 78%, Chinese — 6.5 times and Mongols — more than 8 times.
As a rule, the share of the titular population in bordering states is tenth or even hundredth proportion of percent in the total number of population in the relevant regions of the Russian Federation. The exception is the considerable share of Kazakhs and its growth in the Omsk Region and in the Republic of Altai (from 3.5 to almost 4% and from 5.6 to 6.07% for 1989-2010, respectively). At the same time, the number of Kazakhs in all other analyzed regions decreased in absolute and relative aspects or remained at the same level (e.g., in the Buryat Republic).
The share of Koreans in the total number of the regional population is not as noticeable as Kazakhs. However, absolute and relative growths of the Korean population is seen in all regions, apart from Jewish Autonomous Region and the Trans-Baikal Territory, where the number of representatives of this ethnic group slightly decreased in 2010. It is most considerable for the Amur Region where the number of Koreans grew 4.5 times; Altai, Primorsk Territories, Republic of Altai, Novosibirsk Region (in 2.5 times).
The number of Chinese in the Southern bordering regions of the Russian Federation grew during the period under consideration: 9 times in the Novosibirsk Region and Altai Territory, almost 6 times in the Khabarovsk Territory, 4 times in the Omsk Region, etc. The absolute leader in this respect is the Primorsk Territory where the number of Chinese grew 18 times. However, the part of this ethnic group in the share of the population in bordering RF regions is quite insignificant and exceeds the tenth proportion of percent only in the Primorsk and Khabarovsk Territories, 0.15 and 0.29%, respectively.
The geography of Mongols settlement within the Russian Territory under research is extremely limited. Thus, the representatives of this ethnic group reside only in three of eleven regions, they have an insignificant share in the structure of their population. However, their number absolutely increased during the period under consideration: it became 6 times higher — in the Republic of Tyva, almost 8 times higher — in the Buryat Republic and 28 times — in the Trans-Baikal Territory.
Thus, a strongly marked growth in the number of titular ethnic group representatives in bordering states is seen among the Korean (1.8 times), Chinese (6.5 times) and Mongol (8.4 times) populations. At this, Mongols show the specific selectiveness of habitats that is probably mostly explained by their religious attitudes. With a small exception, the trend of the decreased number of Kazakhs in bordering regions of the Russian Federation is observed after collapse of the USSR. But, despite of divergent trends, in 2010 titular ethnic groups of the bordering states have kept their positions in the rating shown.
In the territorial context, the distribution of ethnic groups under research upon the Russian Federation entities within the Southern border zone of Russian Asia is shown in Figures 2-3.
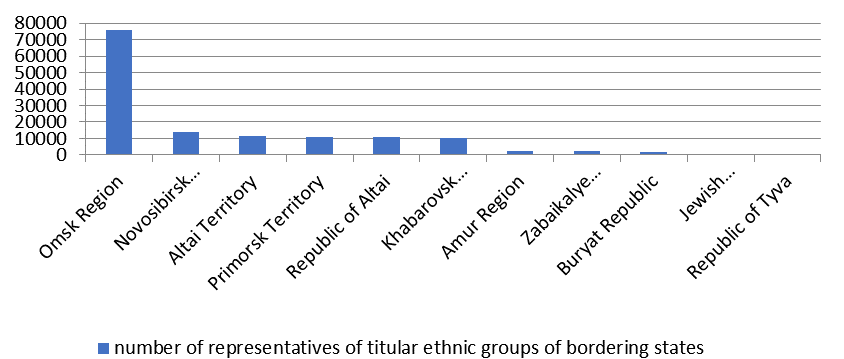
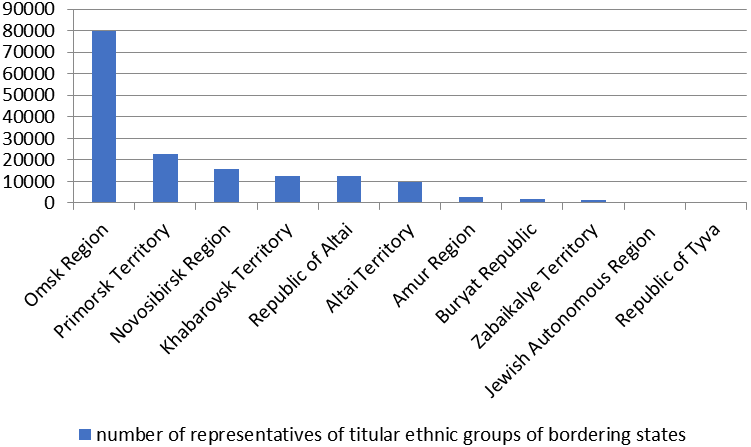
According to the data of ratings shown, the Omsk Region, having the close contact border with Kazakhstan, is traditionally is the most attractive for foreign citizens among all the neighboring countries of the first-order Russian Federation entities within the region under research.
In 2010, the shift of Far Eastern Regions, such as the Primorsk and Khabarovsk Territories, higher in the rating was noticeable in 2010. They grew two positions while replacing the Novosibirsk Region and the Republic of Altai. This trend is probably explained by the activated development of international partnership at the Eastern direction.
Based upon the calculation of the dynamics of the share of titular ethnic group representatives from the bordering states and the number of the regional population during 1989-2010, RF territorial entities were grouped on the dynamics of the number of their representatives and the share in the total number of the regional population (Table 1).
According to these indicators, the entities under research are classified into four groups. The first group includes only one territorial entity, the Republic of Altai; During the analyzed period it was characterized by the growth in both a total population number and the share of titular ethnic group representatives in the bordering states due to the increased number of Kazakhs, Koreans (more than twice), emergence of Chinese.
The second group includes the entities where both indicators have negative values. At this, while the share of titular ethnic groups in the bordering states changed insignificantly, the regional population number decreased from the insignificant (0.4% in the Republic of Tyva) to rather significant values (-19.6% in the Trans-Baikal Territory). It probably proves that these group entities are not attractive for the population as a whole due to a low level of their social and economic development.
The third and fourth groups include the regions where the growth of the share of titular ethnic group representatives in the bordering states is combined with the decline of the regional population. However, if the last value is within the allowable range (up to 10%) in the third group, it is quite significant for the fourth group that includes only Russian Far East regions. The specific leader is the Amur Region with the population decline of 21.5% for the period under consideration.
The growth of the share of titular ethnic groups in the bordering states is the highest in the Primorsk Territory (0.69%) and Omsk Region (0.47%). More than a half of Koreans and more than a quarter of Chinese residing in the regions is concentrated in the Primorsk Territory as for 2010, while the dynamics of the population number of these ethnic group representatives is positive. The Omsk Region takes its place in the rating due to a traditionally high share of Kazakhs and significant growth rates of the Chinese and Korean population. A significant decrease in the population number may be a considerable factor increasing the concentration of titular bordering ethnic groups within these RF regions. Apparently, the trend of “substituting” the residential population by titular ethnic group representatives in the bordering states may become specific for these particular groups.
Conclusion
Thus, our study discloses the following trends of the ethnical structure dynamics of regional population in the Southern border zone of Russian Asia:
- the trend of the growing number and share of titular ethnic group representatives in the bordering states is revealed against the slight decrease in the regional population number in the Southern border zone of Russian Asia;
- among titular ethnic group representatives, due to modern global economic development trends, the gradual decrease of absolute and relative number of Kazakhs is observed alongside with quite a manifested growth of the Chinese and Korean population;
- compared with 1989, in 2010 the positions of the rating of the Russian Federation entities were changed within the region under study upon the number of residing titular ethnic group representatives in bordering states;
- by the ratio of the dynamics of the total population number to the share of titular ethnic group representatives in the bordering states in the ethnic composition of the population, the bordering entities of the Russian Federation may be classified into four groups with different trends of change in the ethnic population structure. These trends may be described in more detail once the next population census will be completed.
References
Akhmetov, R. Sh., Filimonova, I. Yu., & Akhmetova, N. I. (2020). Dinamika rasseleniya naseleniya v zone rossiysko-kazakhstanskogo prigranich'ya. [Dynamics of population migration in the Russian and Kazakhstan bordering area]. Bulletin of Voronezh State University. Series: Geography. Environmental geology, 2, 29-34. https://doi.org/10.17308/geo.2020.2/2882 [in Russ.].
Balina, Т. А., Ponomareva, Z. V., & Chekmeneva, L. Yu. (2019). Territorial'nye osobennosti demograficheskikh protsessov v regionakh Rossii: analiz i tipologiya. [Territorial specifics of demographic processes in Russian regions: analysis and typology]. PNRPU Bulletin. Social and Economic Sciences, 4, 31-42. DOI: 10.15593/2224-9354/2019.4.3 [in Russ.].
Borisov, V. А. (1989). Naselenie mira. Demograficheskiy spravochnik. [Global population. Demographic reference guide]. Mysl. [in Russ.].
Dirin, D. A., & Fryer, P. (2020). The Sayan borderlands: Tuva’s ethnocultural landscapes in changing natural and sociocultural environments. Geography, environment, sustainability, 13(1), 29-36.
Garipov, Ya. Z. (2015). O metodike kolichestvennogo izmereniya urovnya mezhetnicheskogo obtscheniya. [On methods for quantitative measurement of the interethnic communication level]. Bulletin of Economics, Law and Sociology, 3, 194-197. [in Russ.].
Manakov, А. G. (2016). Dinamika etnicheskoy mozaichnosti territoriy Severo-Zapadnoy Rossii v 1897-2010 gg. [Dynamics of ethnical diversity in territories of North-Western Russia during 1897-2010]. Regional Studies, 2, 72-83. [in Russ.].
Manakov, А. G. (2019a). Otsenka izmeneniya etnicheskoy mozaichnosti regionov Evropeyskoy Rossii v periody mezhdu perepisyami 1897, 1959 i 2010 gg. [Assessment of change in ethnical diversity of European Russian regions during periods between censuses of 1897, 1959 and 2010]. RAS Bulletin, Geographic Series, 2, 117-128. DOI: 10.31857/S2587-556620192117-128 [in Russ.].
Manakov, А. G. (2019b). Prostranstvennye zakonomernosti v transformatsii etnicheskoy struktury naseleniya Rossii v period mezhdy perepisyami 1959 i 2010 gg. [Spatial patterns in transformation of ethnic structure of Russian population in the period between censuses of 1959 and 2010]. Geography and Natural Resources, 2, 13-21. https://doi.org/10.21782/GIPR0206-1619-2019-2(13-21). [in Russ.].
Manakov, А. G. (2020). Territorial'nye razlichiya v dole russkikh v postsovetskikh stranakh Vostochnoy Evropy i Baltii. [Territorial differences in share of Russian people in former Soviet countries of Eastern Europe and Baltic region]. RAS Bulletin, Geographic Series, 2, 179-190. DOI: 10.31857/S587556620020090 [in Russ.].
Manakov, A. G., & Klimask, Ja. (2020). Russian-Estonian border in the context of post-sovietethnic transformations. Geography, environment, sustainability, 13(1), 16-20. DOI:
Posdnyakova, Т. М. (2019). Istoriko-geograficheskoe rayonirovanie Aziatskoy chasti Rossii [Historic and geographic zoning of Russian Asia]. Publishing Center of Sholom-Aleichem Amur State University. [in Russ.].
Safronov, S. G. (2015). Sovremennye tendentsii transformatsii etnicheskogo sostava naseleniya Rossii. [Modern trends of ethnic transformation of Russian population]. Baltic Region, 3, 138-153. DOI: 10.5922/2074-9848-2015-3-9 [in Russ.].
Vsesoyuznaya perepis' naseleniya 1989 g. Natsional'niy sostav naseleniya po regionam Rossii. [All-Union population census of 1989. Ethnic population composition by Russian regions]. http://www.demoscope.ru/weekly/ssp/rus_nac_89.php [in Russ.].
Vserossiyskaya perepis' naseleniya 2010 g. Naselenie po natsional'nosti, polu I sub'ektam Rossiyskoy Federatsii [All-Russian population census of 2010. Population upon ethnicity, gender and regions of the Russian Federation]. http://demoscope.ru/weekly/ssp/rus_etn_10.php?reg=1 [in Russ.].
Zotova, О. А. (2018). Geodemograficheskaya situatsiya v prigranichnykh regionakh Rossii i Kazakhstana [Geodemographic situation in bordering regions of Russia and Kazakhstan]. Geograficheskiy vestnik = Geographical Bulletin, 3, 31-37. DOI: 10.17072/2079-7877-2018-3-31-38 [in Russ.].
Copyright information

This work is licensed under a Creative Commons Attribution-NonCommercial-NoDerivatives 4.0 International License.
About this article
Publication Date
21 June 2021
Article Doi
eBook ISBN
978-1-80296-110-2
Publisher
European Publisher
Volume
111
Print ISBN (optional)
-
Edition Number
1st Edition
Pages
1-1168
Subjects
Social sciences, education and psychology, technology and education, economics and law, interdisciplinary sciences
Cite this article as:
Pozdnyakova, T. M. (2021). Dynamics Of Titular Ethnic Groups Of Bordering States In Russian Regions. In N. G. Bogachenko (Ed.), Amurcon 2020: International Scientific Conference, vol 111. European Proceedings of Social and Behavioural Sciences (pp. 756-763). European Publisher. https://doi.org/10.15405/epsbs.2021.06.03.101