Dynamics Of Labour Productivity In Regions Of Russia
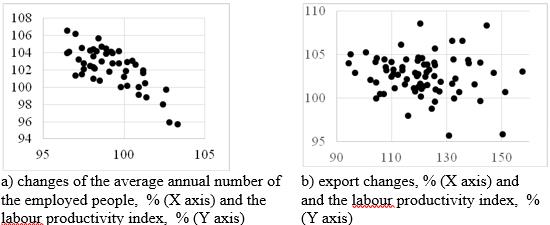
Figure 2: Scatter diagram of the tested parameters for the RF regions in 2018.The source: author’s development based on the data obtained from Federal State Statistics Service (https://www.gks.ru/)