
Accuracy Of Price Prediction For Siu9 Futures Contract Based On Ai System


Abstract
Theoretical foundations for assessing the financial risk of a time series using artificial intelligence systems have been considered. There has been developed an artificial intelligence system that allows obtaining an accurate forecast of the futures price at the predetermined financial risk calculated by the VaR method. A hypothesis has been put forward and proved that the developed AI system, using “news fluctuations” and candlestick charts, enables obtaining a very accurate forecast of the SiU9 closing price. The novelty is that the neural network was trained on a combined sample of data containing digitized “news fluctuations” obtained by the Skraper program from websites and candlestick parameters for the time series of the US dollar SiU9 futures contract with 15-minute timeframe. The approach proposed differs from previously known ones and confirms that neural network makes forecasts based not only on historical time series records, but also on digitized “news fluctuations” obtained by Skraper from websites and transformed by Word2Vec that is known to be an effective tool for analyzing the semantics of natural languages and is based on distributive semantics. On the Deductor platform, there was formed a perceptron that contained 305 parameters in the input layer, two hidden layers of 100 and 10 nodes, and an output layer with one parameter—the forecast price. The developed neural network algorithm allowed trading SiU9 futures, generating signals for sending an order to the QUIK trading terminal.
Keywords: SparkAI systemneural networkWord2VecVAR modelrisk reduction
Introduction
A hypothesis that the developed AI system, using “news fluctuations” and candlestick parameters, enables a very accurate forecast of the SiU9 closing price was put forward and proved. Of great importance are artificial intelligence systems to forecast the SiU9 futures price and risk assessment based on the VaR method.
The novelty is that the neural network was trained on a combined sample of data containing digitized “news fluctuations” obtained by the Skraper program from websites and candlestick parameters for the time series of the US dollar SiU9 futures contract with 15-minute timeframe.
The practical significance of the study lies in the fact that financial losses are reduced both by improving the accuracy of the neural network forecast of the SiU9 futures contract price and neural network forecast of possible losses at a predetermined risk of the VaR model.
Results and discussion
Results
A developed AI system that provides decision support to reduce risk and increase financial sustainability of investment activities
In the course of the study, an AI system was developed that uses not only the parameters of candlesticks and volume, but also “news fluctuations” from web sites to predict the SiU9 futures price.
The AI system includes the following elements:
- Skraper program to collect data from news sites, which is written in Python and implemented in the open Spark framework;
- an open Spark framework that allows the elements of the system to function and ensures its speed based on parallel computing;
- neural network Perceptron program, using Deductor to obtain forecast values of SiU9 futures price; and
- Kohonen map to predict the profit of the exchange robot at the predetermined risk values of the VaR model and the QUIK trading terminal that ensures transactions on the Moscow MoEx exchange.
Skraper program developed
Skraper is a program designed to collect texts from news sites; its functional diagram is shown in “Figure
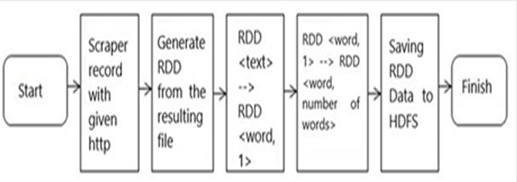
Words previously collected by Skraper from news Web sites were submitted to Word2vec and then transferred to the input layer of the perceptron model in the form of 300 numerical values. Tools to create vector semantic models existed before, but Word2vec was the first popular to be implemented. The initial parameters of the model are presented below Table
The source data were used to develop the perceptron program.
Perceptron program developed
The dataset obtained was used on the perceptron that contained 305 parameters in the input layer, two hidden layers of 100 and 10 nodes and one output layer with one parameter—the forecast price. The data obtained during processing were divided into a training set (95%) and a test set (5%) of the neural network. The back-propagation resulted in a neural network model—perceptron formed on the Deductor platform.
The financial risk of the futures contract was assessed using the VaR model.
VaR-model for assessing financial risk
A histogram of the frequency distribution and integral probability value of the time series of the SiU9 exchange-traded asset is presented in Figure
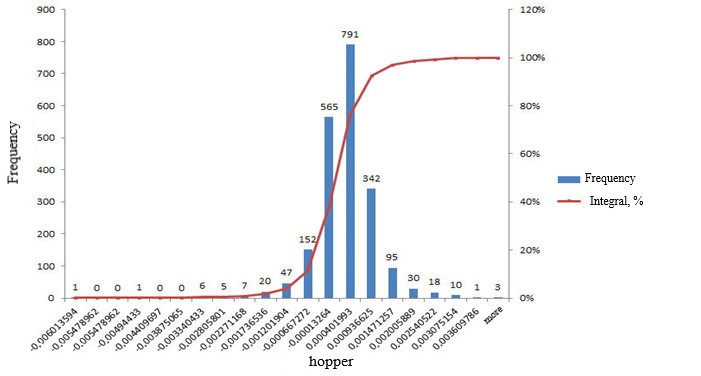
The dynamics of the relative risk values of the VaR model for SiU9 with 15-minute timeframes indicated that the model does not have “heavy tails”. The risk for the next VaR (t+1) timeframe was 0.001848603, and the forecast for the fifth timeframe of the VaR asset timeframe (t+5) was 0.004128889, with the risk not exceeding 11.8 and 26.4 RUB, respectively, and probability being of 99% regarding absolute loss.
The price volatility affected the financial risk value, with the effect itself being not linear, so it seemed advisable to use the predictive capabilities of the artificial intelligence system. The developed AI-model for exchange trading SiU9 futures allowed predicting loss values that turn in a good performance in exchange trading. So, for the analyzed period of 5 working days, namely, from August 30, 2019 (16.15) to September 5, 2019 (22.00), the average yield per calendar day was 32.01% (including commission).
The AI system showed a positive yield for the experimental period of 1,558 timeframes. In order to trade one SiU9 futures contract, one needed to have a minimum amount of money on the broker’s account—Initial margin (IM), i.e., capital (C) equal to 4059.35 RUB. In testing the “historical records” algorithm for the period under study, a positive margin—profit—was obtained. The yield per initial deposit was 32.01% per day.
The studies showed, that the forecast accuracy was high; deviations of the predicted SiU9 price values from the actual ones were insignificant. The neural network model developed—perceptron—showed high profitability due to the high accuracy of the forecast with every 15-minute timeframe.
For example, the standard error (deviation of forecast – fact) was -0.48 RUB, or -0.00007.
To identify certain patterns in the behavior of the studied characteristics, it was advisable to use the neural network quantization method.
As you can see, at a predetermined risk (for example, -0.0476694) and other input parameters introduced, i.e., closing price (Pc) of 66332 RUB, return (r) of 0,00346681, and sigma (σ) of 0,000646043, the developed neural network model gave a predicted value profit of 19.33 RUB in trading for the next 15 minutes.
Methods Used
In research, we used monographic and computational methods, machine data collection by the Skraper proprietary program followed by digitization (vectorization into a 300-dimensional vector) of words by Word2Vec in Apache Spark, an open-source framework for implementing distributed processing, as well as programming in Python language, AI system on the Deductor platform, Big Data quantization, and VaR method for assessing financial risk.
Discussion
Theoretical foundations of assessment and reduction of financial risk
All forms and types of the investment activity are risk-bearing. The investment risk is the probability of unforeseen financial losses in uncertain investment conditions. As practice shows, the idea of obtaining liquidity from exchange operations associated with high risk is not new.
As evidenced in practice, an investor worries not about the risk, as much as the amount of loss expected. That is, the SaR method is used in addition to Value at Risk (VaR) based on determined functional relationship of the risk. This method is widely used by commercial banks.
Many foreign authors devoted their works to the problem of risk assessment and management. The Markowitz’s portfolio theory (Markowitz, 1952) and Sharpe’s simplified model for portfolio analysis (Sharpe, 1970) laid the foundation for assessing financial risk. Works of modern authors contain a solution to more specific issues of financial risk management. For example, Stix (1998) proposed an approach to calculating risk; Knight (1921) proposed an approach to the study of risk, uncertainty and profit.
Of scientific interest are the results of a research study conducted by Ruppert (2019) regarding statistics and data analysis for financial engineering; Jensen et al. (1972) proposed a pricing model for capital assets.
In their scientific work, Fama and MacBeth (1973) came to the conclusion that it is necessary to consider risk as a category that experiences a return and balance while Zhang (2005) suggested focusing on the study of the value premium that is also important. We appreciate Frazinni and Pedersen’s (2010) point of view that claims to take into account the beta of a portfolio of financial instruments.
According to Follmer and Shied (2008), who studied stochastic finance, a convenient way to mathematically formalize uncertainty for a stochastic model is to use the “state of the world” concept.
Considering the mathematical structure of a simple one-step model of the financial market, Follmer and Shied (2008) studied a finite number of primary assets. Their initial prices at time t=0 are known, their future prices at time t=1 are described by random variables on a certain probability space. Asset trading occurs at time t=0. So, in this simple model, basic principles of financial mathematics are very clearly manifested.
We considered the algorithm proposed by the authors of the simplest VaR investment model. Let the estimated income D be a function of capital C and a random variable η with a distribution function(1)
(1)
Then according to formula (2)
(2)
the probability of loss is equal to (3)
(3)
where Ψ (z, y) is the inverse function for h (z, y).
The VaR method can be represented as a series of sequential steps.
It should be taken into account that the VaR methodology itself is not a financial risk management operation, since it does not except financial losses. However, the VaR method allows one to estimate the value of risk assumed.
Algorithms based on data mining in order to assess and reduce financial ris
Data mining algorithms studied by Kumar et al. (2012) are of great importance. Liu et al. (2018) noted that deep learning demonstrates very good performance when learning on large labeled data sets. Udomsak’s (2015) study on computational models deserves special attention; the models consider naive Bayes classifier. Shiralkar et al. (2017) noted the necessary to find flows in knowledge graphs.
The studies show that machine learning has been the subject of modern investigations and is the most important trend in the development of artificial learning systems applied in financial risk management. For example, Baltas et al. (2015) investigated the problem of stock selection using machine learning. Noteworthy is the study of Eason et al. (1955) regarding the product of Bessel functions and Young (1989).
Conclusion
The studies showed that VaR, SaR and GARSH models and others are widely used to assess financial risk. The Skraper program that allows collecting data from web sites is allocated in the Spark framework.
There was an AI system developed that uses not only parameters of candlesticks and volume, but also digitized “news fluctuations” from websites to predict the price of the SiU9 futures contract. The AI system is a perceptron that contains 305 parameters in the input layer, two hidden layers of 100 and 10 nodes, and an output layer with one parameter - the forecast price.
References
- Baltas, N., Jessop, D., Jones, S., Winter, P., Wu, S., Antrobus, O., & Stoltz, P. (2015). Quantitative Monographs: Stock selection using Machine Learning. UBS Global Research.
- Eason, G., Noble, B., & Sneddon, I. (1955, April). On certain integrals of Lipschitz-Hankel type involving products of Bessel functions. Phil. Trans. Roy. Soc. London, A247, 529-551.
- Fama, E. F., & MacBeth, J. D. (1973). Risk, return, and equilibrium: Empirical tests. Journal of political economy, 81(3), 607-636.
- Follmer, H., & Shied, A. (2008). Stochastic Finance: An Introduction in Discrete Time. ICMNO.
- Frazzini, A., & Pedersen, L. (2010). Betting Against Beta. NBER Working Paper.
- Jensen, M., Black, F., & Scholes, M. (1972). The Capital Asset Pricing Model: some empirical tests. Praeger Publishers Inc.
- Knight, F. H. (1921). Risk, uncertainty and profit (Vol. 31). Houghton Mifflin.
- Kumar, P., Sehgal, V. K., & Chauhan, D. S. (2012). A benchmark to select data mining based classification algorithms for business intelligence and decision support systems. arXiv preprint arXiv:1210.3139.
- Liu, J., Gibson, S. J., & Osadchy, M. (2018). Learning to support: Exploiting structure information in support sets for one-shot learning. arXiv preprint arXiv:1808.07270.
- Markowitz, H. (1952). Portfolio Selection. Journal of Finance, 7(1952), 77-91.
- Ruppert, D. (2019). Statistics and data analysis for financial engineering. Springer.
- Sharpe, W. F. (1970). Portfolio theory and capital markets. McGraw-Hill College.
- Shiralkar, P., Flammini, A., Menczer, F., & Ciampaglia, G. L. (2017, November). Finding streams in knowledge graphs to support fact checking. In 2017 IEEE International Conference on Data Mining (ICDM) (pp. 859-864). IEEE.
- Stix, G. (1998). Calculus of Risk. Scientific American, 278, 92-97.
- Udomsak, N. (2015). How do the naive Bayes classifier and the Support Vector Machine compare in their ability to forecast the Stock Exchange of Thailand? arXiv preprint arXiv:1511.08987.
- Young, M. (1989). The Technical Writer’s Handbook. Mill Valley, CA: University Science.
- Zhang, L. (2005). The value premium. Journal of finance, 67-103.
Copyright information

This work is licensed under a Creative Commons Attribution-NonCommercial-NoDerivatives 4.0 International License.
About this article
Publication Date
08 March 2021
Article Doi
eBook ISBN
978-1-80296-102-7
Publisher
European Publisher
Volume
103
Print ISBN (optional)
-
Edition Number
1st Edition
Pages
1-644
Subjects
Digital economy, cybersecurity, entrepreneurship, business models, organizational behavior, entrepreneurial behavior, behavioral finance, personnel competencies
Cite this article as:
Lomakin, N., Rybanov, A., Zarudneva, A., Dubova, J., Mishchuk, O., & Trunina, V. (2021). Accuracy Of Price Prediction For Siu9 Futures Contract Based On Ai System. In N. Lomakin (Ed.), Finance, Entrepreneurship and Technologies in Digital Economy, vol 103. European Proceedings of Social and Behavioural Sciences (pp. 319-325). European Publisher. https://doi.org/10.15405/epsbs.2021.03.40