
Accounting Quality In Albania (International Accounting Standard Entities)


Abstract
The information is one of the most important parts of our life. Every time we have to take a decision, we look for information in different ways. The same thing happens with the economic unit too. Every time managers have to take a decision, the first thing they do is controlling the accounting information. In order the decision to be correct, the accounting information of the financial statement should be qualitative. The main purpose of this paper is to see how was the evolution of the quality of accounting information in Albania after the implementation of international accounting standards in different economic units. To fulfil this purpose we reviewed a wide literature that link with the accounting quality and the factors that influence it. This paper bases in published financial data of 22 economic units during nine years of activity from 2006 – 2014, taken from the National Business Centre web page and from the web pages of these units, despite they are incomplete. To process the above data we use Barth model, which is the appropriate model for our information. From data processing, we conclude that the accounting quality, measured by earnings management, improved during the years. Finally, we list some conclusions and recommendations to improve the quality of accounting information in the future;
Keywords: Accounting informationfinancial reportqualityinternational accounting standards
Introduction
The economy globalization increases during the last years. This fact increased the need for a real and clear information about their position and performance. To compare this information between different types of units is essential that financial information has the same format. Accounting standards assure this format.
From 2008 and after, Albania is a country that uses two types of standards, national and international accounting standards, to register the activities that happen in an economic unit. The small and medium enterprises and NGO-s use national accounting standards while the others use international accounting standards. Here we mention listed and public interest companies, financial companies and other companies that fulfil in the same time two criteria: they have sales about 10 million € and their employees number is over 100 for the last two years.
Despite the format, the standards emphasize the real situation of a company in their financial statements. This links with the quality of financial information. In Albania, we use standards for eleven years, so we need to evaluate the quality of accounting after their implementation.
Many foreign scientists evaluate accounting information quality based on databases of economic units before and after the standards implementation. They define the factors that influence the quality of accounting information and financial reporting like earning management, timely loss recognition and cost of capital. In the same way, Albanians tried to evaluate it too.
Foreign studies and Albanian studies too, mention that big companies and financial units has higher quality of reporting than the others. This is a result of their activities and their auditing reports.
Problem Statement
In this paper, we study the accounting information quality in entities that use international accounting standards in Albania. Therefore, we read many papers about this purpose and tried to find the best model to evaluate it.
Many different researchers has defined the accounting information quality beginning from the implementation of IAS voluntary or mandatory. They gave their definitions about accounting quality and the factors that influenced it.
One of the most complete definition is: “Accounting information quality is the scale in which the accounting information reflects current operating performance, it will be a good indicator of future operating performance and it will accurately annuitize intrinsic value of the company”, according to Dechow and Schrand (2004, p. 5).
According Penman, (2003), they define accounting information quality from shareholders interest and their right evaluation. It is based in the use of information from shareholders and the unit’s perspective in the future. He linked the accounting information quality with the earnings quality. He said that earnings quality is an important characteristic of financial reporting as the shareholders buy their future earnings. The definition earnings quality has different interpretations from different researchers but one of the best is that: earnings quality linked with the connection of net cash flow from the operations with the financial indicator LNEG that is the ratio between net incomes with total assets.
According Lang et al. (2003), they compare the accounting information quality between listed companies in USA stock exchange and unlisted companies. They studied 413 listed and unlisted companies from different countries in this stock exchange during the years 1990 – 2001. To evaluate the accounting information quality they studied these variables: earning management, timely loss recognition and the link between market prices and book values for shares. They discovered that listed companies indicated low earnings management, short timely loss recognition and more compliance between market prices and book values for shares than unlisted companies did. Therefore, they present high quality characteristics.
According to Bharath et al. (2004), they link accounting information quality with loan cost that banks determine for their clients. They end up that it was a negative connection between accounting quality and loan cost, that mean that as high the quality of accounting information as low the loan cost.
Mary Barth is one of the researchers that studied more than others did the quality of accounting information and IAS (IFRS).
In one of her studies with Barth et al. (2006) she determined that implementation of IAS (IFRS) is accompanied with high accounting information quality and low cost of capital. They studied 1885 observations in 319 companies from 21 different countries that implemented IAS from 1994. They studied years 1990 – 2003 (published from World scope); four of them were before IAS adoption and other post adoption. During their study they defined that post adoption period had higher quality of accounting information and lower timely loss recognition and more compliance between market prices and book values for shares and lower cost of capital than implementation of GAAP.
In September (2007), the same researchers applied the same model in 1896 observations of 327 companies from 21 countries that implemented IAS (IFRS). Period and variables were the same as above. They finally define that companies with IAS adoption have higher accounting information quality than the companies without IAS. This was a result of interaction of financial reporting characteristics as IAS, their interpretation, their obligation of implementation and law cases. As they involved in their study the effect of economic environment intervention, they were not sure that the accounting quality was from the intervention or from IAS adoption. Finally, they conclude that accounting information quality was higher in post adoption IAS period.
In another study of November Barth et al. (2007), the researchers conclude that the accounting information quality was higher in IAS companies than in GAAP companies. The model applied in other 2212 companies from 24 countries during the period 1995 – 2006. They compared some IAS companies in different countries in world with some IAS companies in different countries in USA and some GAAP companies in different countries in USA. They conclude that the IAS companies in world differ from IAS companies in USA from regulations and law cases. They conclude that accounting information quality was higher in IAS companies in USA than in IAS companies from other countries of the world. They conclude that IAS companies in USA did not have many changes in their quality in pre and post adoption period. Finally, they conclude that the accounting information quality in IAS companies of USA is higher than that of GAAP companies.
According Beatty et al. (2007), they studied the effect of confidential information and monitoring in accounting information quality in investment decisions. They studied 2251 companies that bought debt securities from the state or other institutions. From these 886 companies bought debt securities from the state, 1836 from private institutions and 471 from joint ventures state – private institutions. They conclude that accounting information quality effects the investments in debt securities from private institutions. They conclude that funding source effects investment decisions and the role of banks in decreasing disagreements.
According Morais and Curto (2008), they applied Barth model in 34 Portuguese listed companies to evaluate accounting information quality before and after IAS implementation. They studied these companies during 10 years of their activity 1995 – 2005, where 1995 – 2004 was before IAS period and 2004 – 2005 was the period after IAS. They conclude that the companies has lower their earnings management evaluation compliance during IAS period. They explain this with the low number of observations in the period after IAS implementation (72 observations) and with the short time after IAS implementation (only one year).
According Paiva and Lourenço (2009), they studied accounting quality in listed companies in Great Britain and France. To evaluate this at the beginning they used Dechow model, which based on the short-term assets and liabilities quality. They divided them in to discrete and indiscrete elements. The first link with the earnings management and the second with the company’s performance. As higher the discrete elements of short-term assets and liabilities, higher the earnings management so lower the accounting quality. However, from the other part they saw that discrete elements of short – term assets and liabilities were effected from other factors from business environment such as the size of company, financial leverage, increasing incomes, auditing etc. After this, they decided to apply Barth model that included these factors. After applying Barth model, they conclude that accounting quality is higher in big and listed companies in France and Great Britain. The companies with higher ratio of debt had lower accounting quality. In addition, auditing from four big companies did not play any role in accounting quality of these companies.
According Hilary (2009), he concluded that the value of companies with high accounting quality is more stable than the value of companies with low accounting quality. He studied the connection between accounting information quality and liquidity indicator, turn and price variation in ten days during the years 1981 – 2006, in which catastrophic market events happened (immediate decline of prices). He studied the connection between accounting information quality and return on equity. He conclude that companies with high accounting quality had a return rate more stable during catastrophic days. The indicators that he used to evaluate accounting quality were total of short – term assets and liabilities during the year, net income, and net cash flow from operating activities, depreciation expenses and total average assets during the year.
According Dechow et al. (2010), beginning from the Statement of Financial Accounting Concepts no 1 in GAAP they defined the accounting quality saying that: Higher quality earnings provide more information about the features of a firm’s financial performance that are relevant to a specific decision made by a decision maker. They studied the concepts of earnings quality examining more than 300 papers of this field.
According Hribar et al. (2013), they studied the evaluation of accounting information quality with auditing fee. They concluded that as low the accounting information quality the higher the auditing fees for it. They compared this with the connection between the number of police and the rate of crimes in economy.
According Schiller and Vegt (2010), they studied the connection of accounting information quality with interim reporting. During the years 1923 – 1973, listed companies in New York stock exchange had interim reporting for 3 months. After this period, they had interim reporting for six months. They studied accounting information quality in two dimensions: its credibility and information just in time. When they saw that if these two dimensions were positive they said that interim reporting is improved, if not they did not say the same thing for interim reporting.
According Jackson (2011), he studied that a financial reporting of high quality lead to a right evidence of product prices in the future. According him accounting information quality is specific for all the users of financial statements because they use it for different purposes. He used three approximations to evaluate accounting information quality: (1) the probability of material errors of accounting, (2) the quality of deferred accounting and (3) hammered earnings. He concluded that higher the quality of deferred accounting and hammered earnings higher the accounting information quality. The opposite happened with the probability of material errors of accounting so the lower it, the higher the quality of the accounting information.
According Ma and Martin (2012), they studied that the accounting information quality effects capital costs, debt costs, the choice between public or private debt and the loans offered by loans syndicate. They concluded a negative connection between accounting information quality of big clients with the money level of the suppliers.
According Christensen et al. (2015), they applied Barth model in German companies. They studied 310 companies, divided in 177 that did not adopt IAS until 2005 and 133 that voluntarily adopt IAS from1998. They studied these companies in the period 1993 – 2006. They concluded that the earnings management lowered in the companies which voluntary adopted IAS, so the accounting information quality increased. The opposite happened with the other companies. The earnings management increased after the adoption, so the accounting information quality decreased. According authors this was effect of three factors: the variables change with the time, statistical observations were a few and the time was short. (Only two years) So they concluded that not always the adoption of IAS lead in an increased quality of accounting information. It depends in the incentive of the accountants to approve or not the new IAS, despite their quality.
According Yurt and Ergun (2015), they studied the adoption of IAS and the accounting quality in Turkey. They studied 19 listed companies in the Istanbul stock exchange. This study included 133 observations during the years 2005 – 2011. Using Barth model they saw that accounting information quality was low despite IAS implementation. This effect was result of the high level of liabilities that companies use to finance their activities. They recommend that all companies in Turkey use IAS in their financial statements to avoid the information asymmetry and its effects in the economy.
According Legenzova (2016), she studied the accounting quality in Lithuania. She realized interviews with experts to evaluate the accounting quality in Lithuania. She concluded that the quality of accounting information is poor and the EU has to do much work to improve the accounting of the small and medium entities because they have importance for the development of European economy.
Research Questions
The research question of this study is:
Is there earning management in the financial statements prepared from the accountants after the IAS implementation?
Purpose of the Study
The purpose of this study is to give answer to the research question. Therefore to evaluate if the financial statements have or not earnings management.
If there is earnings management in the financial statements, we conclude that the accounting information quality is low, if there is not we conclude that the accounting information quality is high.
Research Methods
Sample and Data Collection
Our sample consist of 22 entities that operate in Albania and use IAS/IFRS to prepare their financial statement. It is a random sample. We take the financial statement of these companies from our National Centre of Business and from their websites. Depending in their activity, these companies divided into four groups: 13 banks, 3 microcredit unions, 4 assurance companies and two other companies that accomplish the two above criteria (See Figure
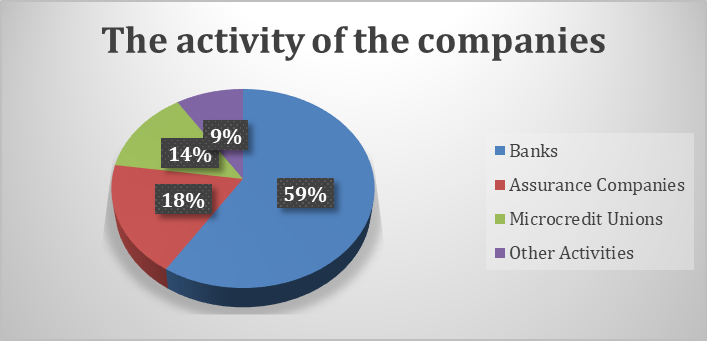
For these sample companies we have 121 observations during the years 2006 – 2014, because we have some missing data during years. We delete the outlier data and we hold data that are in the interval [-200%; 200%], because they worsened the regression.
Analyses
As the review of the literature gives us different methods to evaluate the accounting information quality, we choose to apply in Albania, Barth model, as it is more suitable for the companies that operate here. We choose to evaluate the quality based on the earnings management. The purpose of this paper is to give answer to the research question below:
Is there earning management in the financial statements prepared from the accountants after the IAS implementation?
If there is earnings management in the financial statements, we conclude that the accounting information quality is low, if there is not we conclude that the accounting information quality is high.
The first measure of earnings management relies on the variability of the change in net income scaled by total assets, ΔNI (Barth et al., 2006). The second measure of earnings management relies on the ratio of the variability of the change in net income, ΔNI, to the variability of the change in operating cash flows ΔCF. The third measure relies on the connection between accruals and operating cash flows (Barth et al., 2007).
According the above information, we raise three hypotheses that link with research question.
We foresee that a higher accounting information quality comes from a lower earning management. Therefore, the first hypothesis is as below:
H1: The implementation of IAS/IFRS links with a high variability of change in net income.
The second hypothesis on earning management relies on the ratio of the variability of the change in net income with the variability of the change in operating cash flows. We foresee that a higher accounting information quality comes from a higher ratio. Moreover, the second hypothesis is as below:
H2: The implementation of IAS/IFRS brings a higher ratio between the variability of change in net income to the variability of change in cash flows.
The third hypothesis on earning management relies in the correlation between accruals and operating cash flows. We foresee that a weak correlation between them leads to a high accounting information quality. Moreover, the third hypothesis is as below:
H3: The implementation of IAS/IFRS relies on a low management of accruals from the company.
We implement these three hypotheses in 22 companies that uses IAS/IFRS in Albania during the period 2006 - 2014.
After we create the hypotheses, we follow these steps to complete the database analysis:
We evaluate four models of regression: the variability of the change in net income, the variability of the change in operating cash flows, accruals and operating cash flows.
After this, we took the residuals of every model of regression.
Then we use FISHER and ANOVA analysis to analyse the residuals of the regressions. We use FISHER analysis to compare the accounting information quality before and after the standards. While we use ANOVA analysis to evaluate the variance of the residuals.
Then we approve or reject the hypotheses.
We use Gretl programme and Excel Megastat to analyse the data.
Findings
To analyse the link between dependent and independent variable we use the multiple linear regression analysis with ordinary least squares model.
Beginning from Barth model, we define the dependent and independent variable for every hypothesis. Then we use the correlation matrix to see if there is auto correlation between the variables. Then we prepare the equations of multiple regression. To evaluate the variance of independent variable we evaluate the variance of the residuals of every regression. We use ANOVA analysis to evaluate the hypothesis.
Let us begin with the first hypothesis. We prepare the first equation of the multiple linear regression where the dependent variable is the variability of the change in net income scaled by total assets, ΔNI, meanwhile independent variables are size, growth, financial leverage, change of total liabilities, turn of assets and operating cash flow. Other independent variables such as issue, exchange, listing and close are not object of our regression, because we do not have a stock exchange in Albania where we can take these data. The indicator variable of audit is not in this regression because one of four big audit companies audit all the companies that we consider. The independent variable of size will be the natural logarithm of total assets, because we do not have a stock exchange to evaluate the market value of the equity. From the matrix of the correlation between independent variables, we see that we do not have problems of correlation between them, because the coefficients are out of the interval [-0.7; 0.7].
The multiple regression is as follows:
ΔNIit = α0 + α1SIZEit + α2GROWTHit + α3LEVit + α4ΔDISSUEit + α5TURNit + α6CFit + Ԑit
Where:
ΔNI = the change in annual earnings, where earnings is scaled by end of year total assets
SIZE = natural logarithm of end of year of total assets
GROWTH = percentage change in sales
LEV = end of year total liabilities divided by end of year equity book value
ΔDISSUE = percentage change in total liabilities
TURN = sales divided by end of year total assets
CF = annual net cash flow from operating activities divided by end of year total assets
After the evaluation of linear regression the results tell us that the model is statistically significant (p = 0.000) but the independent variables like TURN and CF are not statistically significant. After that, we do another time the evaluation of linear regression and we see that it was statistically significant with ((F (2,118) = 16.32, p = 0.000) and adjusted R2 is 20.3%. The significant variables in the final regression model are SIZE (p = 0.0061) and ΔDISSUE (p = 0.0048). Below is the final linear regression model:
ΔNI = -0.04 + 0.12SIZEit + 0.13ΔDISSUEit + Ԑit
As we see from the linear regression these variables has positive relation with ΔNI and the adjusted R2 is low. This means that the independent variables justify 20.3% of the dependent one. This means that other variables indicate the change in net income such as fiscal and trade law, economic environment etc. Otherwise this does not worsen analyse quality because we are interested in the variance of the residuals of the regression and not in regression especially. We see this in the original model, because Barth does not mention the adjusted R2 nowhere.
The variability of ΔNI is the cross sectional variance of residuals of the IAS data companies. Therefore, we proceed with evaluating of the variance of the residuals of the regression that is the same with the variance of the change of net income. To do this, we know that IAS entities use them from 2005 and later. Therefore, we use ANOVA analysis and we have two hypotheses:
H0,1: During the years the average of the residuals don’t change
Ha,1: During the years the average of the residuals change
Below is ANOVA table
From the table
Our second hypothesis based on the ratio of the variability of the change in net income, ΔNI, to the variability of the change of operating cash flow ΔCF. The first variance is ready from the first equation. Now we have to evaluate the same equation for ΔCF. We prepare the equation of the multiple linear regression where the dependent variable is the variability of the change of operating cash flow, ΔCF, meanwhile independent variables are size, growth, financial leverage, change of total liabilities, turn of assets and operating cash flow. From the matrix of the correlation between independent variables, we see that we do not have problems of correlation between them, because the coefficients are out of the interval [-0.7; 0.7].
The multiple regression is as follows:
ΔCFIit = α0 + α1SIZEit + α2GROWTHit + α3LEVit + α4ΔDISSUEit + α5TURNit + α6CFit + Ԑit
After the evaluation of linear regression the results tell us that the model is statistically significant (p = 0.000), but the variables TURN and CF are not statistically significant. After that, we do another time the evaluation of linear regression and we see that it was statistically significant with ((F (2,118) = 15.41, p = 0.000) and adjusted R2 is 19.4%. The significant variables in the final regression model are SIZE (p = 0.0008) and ΔDISSUE (p = 0.0000). Below is the final linear regression model:
ΔCF = 4.28 – 10.8SIZEit – 14.8ΔDISSUEit + Ԑit
As we see from the linear regression these variables has negative relation with ΔCF and the adjusted R2 is low. This means that the companies realize sales with clients and not in cash. The same for the negative link of ΔCF with ΔDISSUE. The low adjusted R2 means that the independent variables justify 19.4% of the dependent one. This means that other variables indicate the change in net income such as fiscal and trade law, economic environment etc. Otherwise this does not worsen analyse quality because we are interested in the variance of the residuals of the regression and not in regression especially. We see this in the original model, because Barth does not mention the adjusted R2 nowhere.
The variability of ΔCF is the cross sectional variance of residuals of the IAS data companies. Therefore, we evaluate the variance of the residuals of the regression that is the same with the variance of the change in operating cash flow. Then we measure the ratio of the variance of ΔNI with ΔCF. In this case, we know that the ratio will be available for panel data, where we have data for both. We use ANOVA analysis to measure the variance of the ratio. Therefore, we have two other hypothesis:
H0,3: During the years the average of the residuals don’t change
Ha,3: During the years the average of the residuals change
Below is ANOVA table
From the table
Finally, we see our third hypothesis. Here we have to evaluate if in the companies we have low management of accruals after IAS/IFRS implementation. This means to see the correlation between accruals with operating cash flows. To measure this correlation we use Spearman coefficient.
Now we prepare the equation of the multiple linear regression where the dependent variable in the first case is accruals, meanwhile the dependent variable in the second case is operating cash flow. The independent variables are the same for two cases; size, growth, financial leverage, change of total liabilities and turn of assets. From the matrix of the correlation between independent variables, we see that we do not have problems of correlation between them, because the coefficients are out of the interval [-0.7; 0.7].
The multiple regressions are as follows:
ACCit = α0 + α1SIZEit + α2GROWTHit + α3LEVit + α4ΔDISSUEit + α5TURNit + Ԑit
CFit = α0 + α1SIZEit + α2GROWTHit + α3LEVit + α4ΔDISSUEit + α5TURNit + Ԑit
After the evaluation of the first linear regression the results tell us that the model is statistically significant (p = 0.000) but independent variables like SIZE and LEV are not statistically significant. After that, we do another time the evaluation of linear regression and we see that it was statistically significant with ((F (3,117) = 7.67, p = 0.003) and adjusted R2 is 14%. The significant variables in the final regression model are ΔDISSUE (p = 0.0001) and TURN (p = 0.0253). Below is the final linear regression model:
ACC = 0.11 – 0.12ΔDISSUEit – 0.07TURNit + Ԑit
As we see from the linear regression these variables has negative relation with ACC and the adjusted R2 is low. The low adjusted R2 means that the independent variables justify 14% of the dependent one. This means that other variables indicate the change in net income such as fiscal and trade law, economic environment etc. Otherwise this does not worsen analyse quality because we are interested in the variance of the residuals of the regression and not in regression especially. We see this in the original model, because Barth does not mention the adjusted R2 nowhere.
Then we evaluate the second linear regression. After the evaluation of the second linear regression the results tell us that the model is marginally significant (p = 0.053), but the independent variables like SIZE, ΔDISSUE and TURN are not statistically significant. After that, we do another time the evaluation of linear regression and we see that it was marginally significant with ((F (2.114) = 4.13, p = 0.018) and adjusted R2 is 5%. The marginally significant variables in the final regression model are GROWTH (p = 0.0222) and LEV (p = 0.0331). Below is the final linear regression model:
CF = -1.14 x 10¹⁰ – 5.63 x 10¹⁰ GROWTH it + 3 x 10⁹ LEV it + Ԑit
As we see from the linear regression, GROWTH has negative relation with CF, LEV has a positive one, and the adjusted R2 is low. The low adjusted R2 means that the independent variables justify 5% of the dependent one, but this does not worsen our analyses.
Then we evaluate the residuals of every equation and we use Spearman coefficient to evaluate the correlation between the residuals of these two equations. Below in the table
From data processing, we see that this coefficient is -0.334, which means that between accruals and operating cash flows exists a weak negative correlation. (Figure
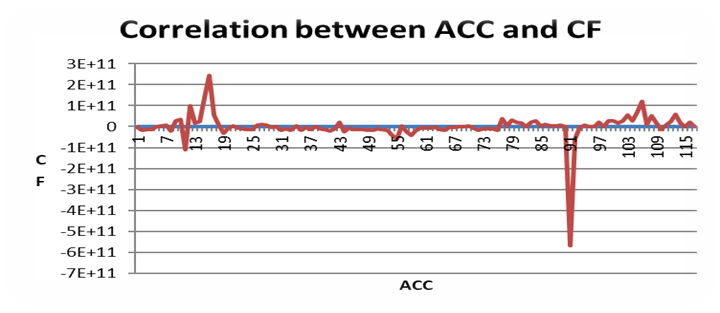
Finally, we conclude that the accounting information quality after the implementation of IAS/IFRS is high, because the first and the third hypothesis approved. The second rejected. We explain this with the small number of observations.
Table
Conclusion
As we see from our study, the full definition for accounting quality is “Accounting information quality is the scale in which the accounting information reflects current operating performance, it will be a good indicator of future operating performance and it will accurately annuitize intrinsic value of the company”.
We studied the accounting information quality of 22 entities that use IAS/IFRS in Albania. This is a small number of companies, but it is about 17% of all entities that use these standards. We see that the accounting quality, measured by earnings management, improved during the years. In our paper, we use only quantitative methods to measure accounting quality, but we can say that qualitative methods will be effective too. We will use them in the other studies of this field.
Finally, we hope to do another study of accounting quality for all Western Balkan Countries, so we can compare Albania with other countries of the same level.
References
- Barth, M., Landsman, W., & Lang, M. (2006). International Accounting Standards and Accounting Quality. http://citeseerx.ist.psu.edu/
- Barth, M., Landsman, W., Lang, M., & Williams, C. (2007). Accounting Quality: International Accounting Standards and US GAAP. www.foxtemple.edu/conferences
- Beatty, A., Liao, S., & Weber, J. (2007). The effect of private information and monitoring on the role of accounting quality in investment decisions. www.gsb.stanford.edu/
- Bharath, S., Sunder, J., & Sunder, S. (2004). Do sophisticated investors understand accounting quality? Evidence from banks loan. from www.bis.org
- Christensen, H., Lee, E., Walker, M., & Zeng, C. (2015). Incentives or standards: What determines accounting quality changes around IFRS adoption? European Accounting Review, 31 – 61.
- Dechow, P., & Schrand, C. (2004). Earnings quality: The Research Foundation of CFA Institute.
- Dechow, P., & Ge, W., & Schrand, C. (2010). Understanding earnings quality: A review of the proxies, their determinants and their consequences. Journal of accounting and economics 50, 344 – 401.
- Hilary, G. (2009). Accounting quality and catastrophic market events. www.kellogg.northwestern.edu/accounting/papers/hilary.pdf
- Hribar, P., Kravet, T., & Wilson, R. (2013). A new measure of accounting quality. Review of Accounting studies, 19, 506 – 538.
- Jackson, A. (2011). Does accounting quality enhance the timeliness of price discovery? https://www2.aaahq.org/AM2011/abstract.cfm?submissionID=545 (June 2011)
- Lang, M., Raedy, J., & Yetman, M. (2003). How representative are firms that are cross-listed in the United States? An analysis of accounting quality. Journal of Accounting Research, 363 - 386.
- Legenzova, R. (2016). A concept of accounting quality from accounting harmonization perspective. https://www.researchgate.net/publication/301571283_A_Concept_of_Accounting_Quality_from_Accounting_Harmonisation_Perspective
- Ma, T., & Martin, X. (2012). The real effect of customer accounting quality – trade credit and suppliers cash holdings. dwsm.xmu.edu.cn/UploadFiles/2014610164753356.pdf
- Morais, A., & Curto, J. (2008). IASB standards and portugese evidence. Revista Contabilidade & Financas 19(48), 103 – 111.
- Paiva, I., & Lourenço, I. (2009). Determinants of accounting quality. Empirical evidence from the European Union after IFRS adoption. www.aeca1.org/pub/on_line
- Penman, S. (2003). The quality of financial statements: Perspectives from the Recent Stock Market Bubble. Accounting Horizon Supplement, 77 – 96.
- Schiller, U., & Vegt, M. (2010). Interim reporting and accounting quality. http://papers.ssrn.com/sol3/papers.cfm?abstract_id=1661592
- Yurt, C., & Ergun, U. (2015). “The IFRS adoption and Accounting quality: A comprehensive trend analysis”. International Journal of Academic Research in Economics and Management Sciences, 4(2), Quarterly, 405-421.
Copyright information

This work is licensed under a Creative Commons Attribution-NonCommercial-NoDerivatives 4.0 International License.
About this article
Publication Date
13 February 2021
Article Doi
eBook ISBN
978-1-80296-100-3
Publisher
European Publisher
Volume
101
Print ISBN (optional)
-
Edition Number
1st Edition
Pages
1-224
Subjects
National interest, national identity, national security, national consciousness, social relations, public relation, public organizations, linguocultural identity, linguistics
Cite this article as:
Kastrati, A., & Kinka, A. (2021). Accounting Quality In Albania (International Accounting Standard Entities). In C. Zehir, A. Kutlu, & T. Karaboğa (Eds.), Leadership, Innovation, Media and Communication, vol 101. European Proceedings of Social and Behavioural Sciences (pp. 14-26). European Publisher. https://doi.org/10.15405/epsbs.2021.02.2