
Modern Bayesian Leadership Analytics In High-Performance Business And Sport


Abstract
In this era of team-based organizations and data-driven Human Resource, people management is, as never before, involved in analytics and modelling of data with multilevel structure. In recent years, this has become especially true for leadership analytics, a relevant applied research topic in high-performance business and sport. In these fields, every last insight out of people data certainly help in winning the game at the top international level. Since the data to be analysed are often related to individuals grouped into teams, when fitting statistical models to them, multilevel regression methods should be preferred to their one-level ordinary least squares counterpart. Although in leadership research a frequentist approach has historically been used in addressing multilevel modelling, in this paper we suggest a Bayesian approach. Besides matching our intuitions from everyday reasoning and research, the Bayesian approach has several advantages. Among them, a lower sample size required when proper informed prior for the parameters of interest are available, a more intuitive interpretability of estimates, and the flexibility of fitting increasingly complex models. Inspired by recent literature in leadership analytics, we have simulated a concrete data set with an intrinsic two-levels structure. In order to show how the availability of modern intuitive, user-friendly and open-source statistical packages facilitates mathematical computation and results exploration, we have fitted a Bayesian hierarchical linear model to our data.
Keywords: Leadership analyticsmultilevel modelBayesian statistics
Introduction
Since the impressive explosion in data measurability and availability we are witnessing in our fast- changing world, the way Human Resources (HR) operates is being transformed. We are in the era of data-driven, or intelligent, HR rise. It means that modern HR teams is taking advantage in the decision-making process by turning data into insights with several analytics techniques: text analytics, predictive analytics voice or speech analytics, video analytics, image analytics, sentiment analysis (Marr, 2018). This is especially true in the high performance (or elite) sport and business world, where the goal is to win world competition at the highest possible level, and the strategic management of the human asset certainly have extraordinary impact on performance. Today business is discovering all the potential of data analytics, putting on it a great emphasis as a new source of innovation and competitive advantage (Karaboga et al., 2019). Analytics techniques are now used in specific type of people analytics available to HR teams. Among others: capability analytics, competency acquisition analytics, capacity analytics, churn analytics, culture analytics, recruitment analytics, talent identification and tracking, injury prevention and wellness of athletes and employees, leadership analytics, performance analytics (Marr, 2018). All these people analytics have their counterparts and applications in the wisdom of high-performance sport. This is particularly true for rowing, which is intrinsically a data-rich and analytics-friendly sport as almost everything athletes do is measurable and analytically linkable to their performances. However, the technical skills needed to build data-driven organizations are not native to the world of elite sport and business. Analytics partnerships are of vital importance. Just to give an example from elite sport, SAS, the giant of analytics, is the official analytics partner of British Rowing and is working with GB Rowing Team to drive improved performance through advanced analytics.
In modern team-based sport or business organizations, leaders are asked to motivate not only individuals but also teams as a whole. Leadership performance plays a key role in empowering and engaging employees or athletes to improve performance, with impact on global results, productivity and profit. Data for leadership performance analytics can also be easily gained through the use of traditional surveys, focus groups, employees or athletes’ interviews. Models considered in the statistical data analysis should reflect which leadership characteristics are valuable for the organization goals, based on other analytics, such as performance analytics, or on the particular corporate culture. Since individuals are usually nested in teams, teams are nested in departments, and so on, leadership analytics often involves data with a at least two levels in the hierarchical structure. This is also true with more general scientific research on Human Resource Management (HRM) in business and sport. In this setting, using statistical approaches such as ordinary least squares regression, that are designed to analyse data at one single level, may lead to severe prediction errors. Multilevel regression models are more suitable in the general context of HRM (Shen, 2016) or specifically in leadership analytics (Chen et al., 2007), because they account for variance among variables at different levels, handling source of errors more appropriately (Rowe & Hill, 1998). Multilevel regression models are also named hierarchical linear models (Raudenbush & Bryk, 2002), mixed effects or mixed models (Littell et al., 1996), random coefficient models (Kreft & de Leeuw, 1998), variance component models (Longford, 1986).
While in leadership analytics single level and multilevel model are usually estimated with a frequentist statistical approach, we propose here the Bayesian statistical approach. The foundational ideas of the Bayesian methods match our intuitions from everyday reasoning and research (Kruschke & Liddell, 2018). Furthermore, the Bayesian framework offers several advantages in term of interpretability of estimates and flexibility of fitting increasingly complex models (Korner-Nievergelt et al., 2015; McElreath, 2016). Bayesian methods are also especially convenient for analysing multilevel models (Rouder & Lu, 2005; Shiffrin et al., 2008).
In this paper, in order to show the advantages of the Bayesian approach and ease researchers in the field of leadership analytics into Bayesian statistical methods, we have considered an example concerning the estimation of a simple hierarchical model with two levels. Inspired by Chen et al. (2007) we have simulated a typical data set centring on the relationship between self-reported scores of Leader-Member Exchange (LMX) and Individual Empowerment (IE). LMX, an individual-level construct, should be intended as the quality of the social exchange between leaders and followers, characterized by mutual trust, respect, and obligation (Gerstener & Day, 1997) and a stimulus that exerts a direct influence on individual motivation in teams (Chen & Kanfer, 2006). Individual Empowerment should be conceptualized as a multidimensional construct consisting of impact, competence, meaningfulness, choice (Chen et al., 2007; Kirkman & Rosen, 1997, 1999; Thomas & Velthouse, 1990). The data set refers to 40 individuals grouped in 4 teams. We have fitted a simple linear model and a two-levels model to our data.
In data simulation, model fitting procedures, and results exploration and presentation we have intensively used the Stan (Stan Development Team, 2017) and R (R Core Team, 2018) software via the R packages rstanarm (Gabry & Goodrich, 2018), shinystan (Gabry, 2017), ggplot2 (Wickham, 2016), bayesplot (Gabry et al., 2018).
For state of art, wide and exhaustive introductions to multilevel thinking and modelling in HRM research, we have referred to Bliese (2002); Bliese and Hanges (2004); Renkema et al. (2017); Shen et al., (2018); Shen (2016); Aguinis et al. (2013); and the references therein. For more mathematical treatments of multilevel modelling: Snijders and Bosker (2012); Hox et al. (2018); Bates et al. (2015). Kruschke and Liddell (2018) and Kruschke and Vanpaemel (2015) are short and friendly introductions to Bayesian data analysis and hierarchical linear modeling. Kruschke (2015) is a more complete presentation of the subject. Gelman and Hill (2007) is a good, perhaps dated from a computational point of view, introduction to general Bayesian statistical methods. Gelman et al. (2013) is a quite complete, but mathematically and technically demanding, presentation of modern Bayesian methods with an appendix on using Stan and McElreath (2016) is a gentle introduction to Bayesian methods, including multilevel linear models, with R and Stan. Fox and Weisberg (2019) is a good reference for applied regression with R, including multilevel models, with a freely available web appendix on Bayesian estimation with Stan. For the Stan program, the state of art in Bayesian statistical software, we have manly referred to Carpenter et al. (2017). Gabry and Goodrich (2018) present rstanarm, a Stan based R package. Gabry et al. (2018) was the reference for the bayesplot package for plotting Bayesian models. Muth et al. (2018) is an excellent introduction to Bayesian hierarchical linear models fitting with rstanarm package and the user-friendly exploration of results with the shinystan package. References therein can guide the interested readers toward a deeper knowledge of the subject.
Problem Statement
In modern team-based business and elite sport organizations, leadership analytics is often involved in the statistical modelling of data with a multilevel structure. The Bayesian approach is considered, for several reasons, the natural approach to this kind of problems. In this paper we have faced the problem of fitting a Bayesian hierarchical linear model to a typical multilevel data set by taking advantage of the use of the statistical software R and some of its recent packages.
Research Questions
The main purpose of this paper was to introduce the Bayesian approach to multilevel modelling into the field of leadership analytics and more generally into HRM research. We have focused on the advantage of a Bayesian statistical approach with respect to the traditional frequentist one, rather than on the multilevel modelling itself. The main question was:
Purpose of the Study
The purpose of this study was to show how a modern Bayesian approach to the modelling problem of a leadership analytics typical multilevel data set can become an easy task when using recent and well-designed packages of the open source R software.
Research Methods
In this section we briefly introduce the Bayesian estimation process, the data used in the paper and the statistical models considered.
Bayesian modelling
Here we give just a hint of the Bayesian estimation process. The main idea behind it is simple and intuitive. Parameters to be estimated are random variables. Bayesian estimation is based on learning about the posterior distribution of the model parameters. The posterior distribution consists in a reallocation of the credibility across the possible values of a parameter. It is obtained starting from a
Data and Statistical Models
Inspired by Chen et al; (2007) and Aguinis et al. (2013) we have simulated a data set composed of 40 individual observations of three variables: quality of
The main purpose of this paper is to introduce the Bayesian approach to multilevel modelling into the field of leadership analytics and more generally into HRM research. We focus on the advantage of a Bayesian statistical approach with respect to the traditional frequentist one, rather than on the multilevel modelling itself. For the sake of simplicity, we consider two simple statistical models to be fitted to our data. The first considered model is a simple linear model explaining the relationship between the level-1 variables
We will refer to this model as
where
and
denote the
As for the computational aspects, we have used the Stan (Carpenter et al., 2017; Stan Development Team, 2017) based
Findings
After model estimation, the shinystan package allows to show results and check sampling quality in a user-friendly way. It provides all the needed tools to visualize the posterior distribution and diagnose any problems with the Markov chains. A web browser drives the visualizations. The Posterior summary statistics in the ESTIMATE menu (see Figure
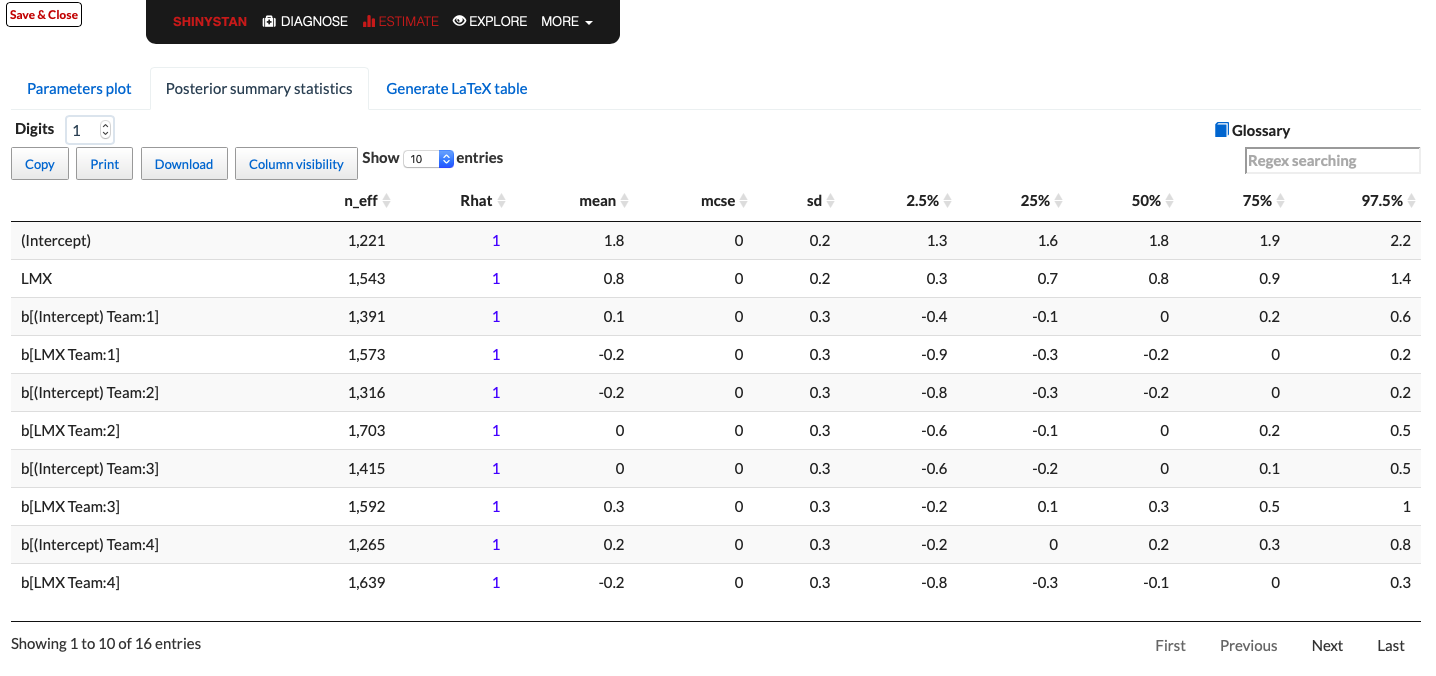
The
statistics is based on comparing the variation between the chains to the variations within the chains. A commonly used heuristic is that
for all parameters is a strong indicator of convergence. In our case, results are fine. The output table in Figure
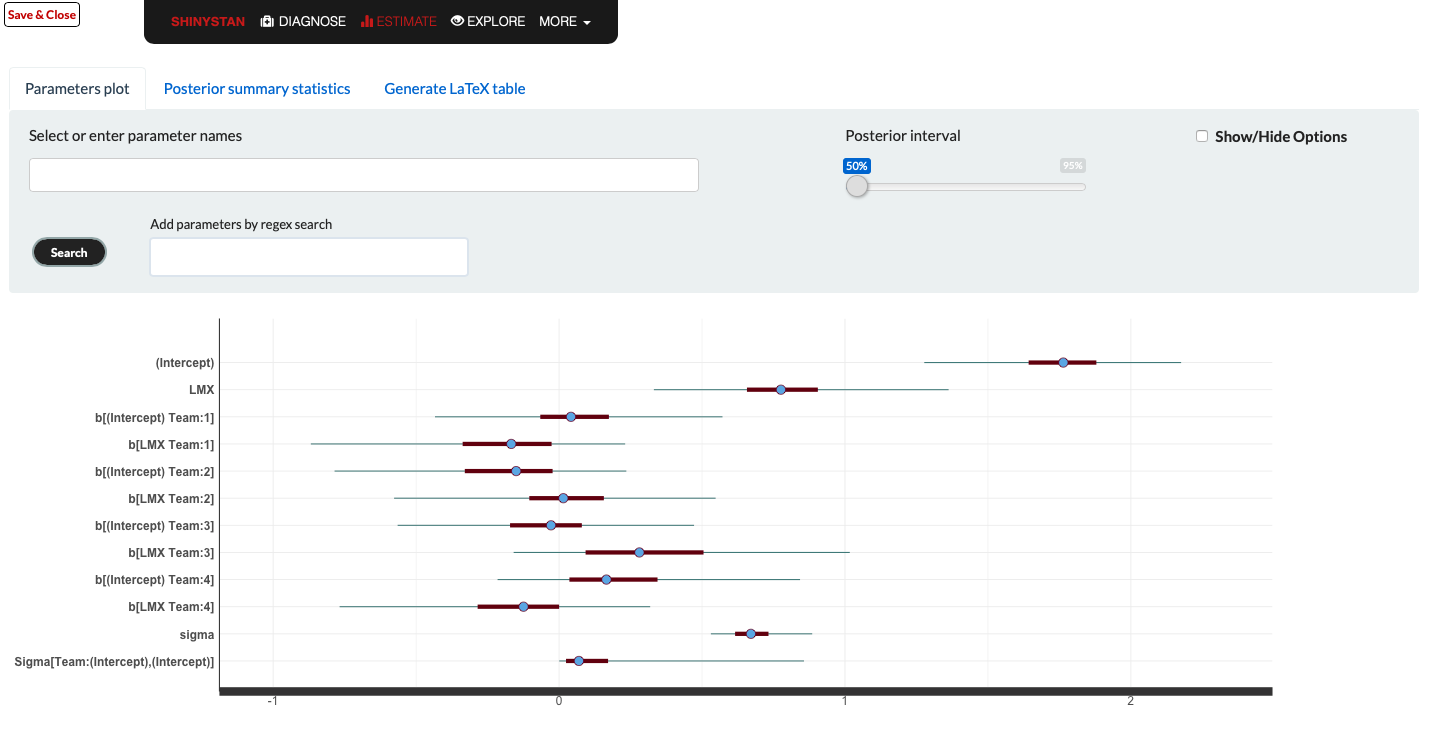
By clicking on the Parameters plot button, by default, the posterior distributions with medians and 80% intervals graph (see Figure
Conclusion
Leadership analytics is a relevant topic of applied research in high-performance business and sport. Since the organizational nature of modern business and sport involves individuals organized in teams or groups at different levels, leadership analytics usually analyses and interprets hierarchically structured data. The interplay between variables at different levels of analysis plays a key role in applied research. This is especially true in the high-performance wisdom, where people work in strongly interdependent environments and leadership performance has a certain impact on winning the game at the top level. Thus, there is an increased interest in multilevel modelling, the natural statistical environment to address models including variables at more than one level of analysis (Bliese, 2000).
In today high-performance sport and business, leadership analytics, as well as other people analytics used by modern data-driven HR, is taking advantage, as never before, of the more recent advances in technologies for data measurability and data analysis methods.
Multilevel models are usually estimated in the frequentist statistical framework. In this paper, we have suggested a Bayesian approach instead, for several reasons. The Bayesian approach to data analysis matches our intuition from everyday reasoning and research. It offers also unique advantages in terms of interpretability of results and extension to more complex models (Kruschke & Liddell, 2018; Kruschke, 2015).
Presenting the results of fitting a two-levels hierarchical model to a typical data set in leadership analytics, we have shown the increased accessibility and efficiency of the Bayesian estimation process due to recent advances in statistical software, estimation engine, and user-friendly interface.
We hope that this paper will encourage applied researchers in leadership analytics for high-performance business and sport, and more generally in Human Resource Management, to use Bayesian modelling in their future research activity.
References
- Aguinis, H., Gottfredson, R. K., & Culpepper, S. A. (2013). Best-practice recommendations for estimating cross-level interaction effects using multilevel modeling. Journal of Management, 39(6), 1490-1528.
- Bates, D., Mächler, M., Bolker, B., & Walker, S. (2015). Fitting linear mixed-effects models using lme4. Journal of Statistical Software, 67(1), 1-48. https://doi.org/.18637/jss.v067.i01
- Bliese, D. (2000). Within–group agreement, non-independence, and reliability: Implications for data aggregation and analysis. In K. J. Klein & S. W. Kozowski (Eds.), Multilevel theory, research, and methods in organizations: Foundations, extensions, and new directions: 349-381. Jossey-Bass.
- Bliese, P. D. (2002). Multilevel random coefficient modeling in organizational research: Examples using SAS and S-PLUS. In F. Drasgow & N. Schmitt (Eds.), Measuring and analyzing behavior in organizations: Advances in measurement and data analysis: 401-445. Jossey-Bass.
- Bliese, P. D., & Hanges, P. J. (2004). Being both too liberal and too conservative: The perils of treating grouped data as though they were independent. Organizational Research Methods, 7, 400-417.
- Carpenter, B., Gelman, A., Hoffman, M., Lee, D., Goodrich, B., Betancourt, M., Brubaker, M. A., Guo, J., Li, P., & Riddell, A. (2017). Stan: A probabilistic programming language. Journal of Statistical Software, Article, 76(1), 1-32.
- Chen, G., Kirkman, B. L., Kanfer, R., Allen, D., & Rosen, B. (2007). A multilevel study of leadership, empowerment, and performance in teams. Journal of Applied Psychology, 92, 331-346.
- Chen, G., & Kanfer, R. (2006). Toward a systems theory of motivated behaviour in work teams. Research on Organizational Behaviour, 27, 223-267.
- Fox, J., & Weisberg, S. (2019). An R Companion to Applied Regression. (3rd Edition). Sage, Thousand Oaks.
- Gabry, J. (2017). Shinystan: interactive visual and numerical diagnostics and posterior analysis for Bayesian models. R package version 2.4.0. http://mc-stan.org/shinystan/
- Gabry, J., & Goodrich, B. (2018). Rstanarm: Bayesian Applied Regression Modeling via Stan. R package version 2.17.4. http://mc.stan.org/rstanarm
- Gabry, J., Mahr, T., Bürkner, P. C., Modrák, M., & Barret, M. (2018). Bayesplot: plotting for Bayesian models. R package version 1.6.0. http://mc-stan.org/bayesplot
- Gelman, A., Carlin, J. B., Stern, H. S., Dunson, D. B., Vehtari, A., & Rubin, D. B. (2013). Bayesian data analysis. (3rd Edition). Boca Raton (FL): Chapman & Hall/CRC.
- Gelman, A., & Hill, J. (2007). Data analysis using regression and multilevel/hierarchical models. Cambridge University Press.
- Gerstener, C. R., & Day, D. V. (1997). Meta-analytic review of leader-member exchange theory: Correlates and construct issues. Journal of Applied Psychology, 82, 827-844.
- Hox, J. J., Moerbeek, M., & van de Schoot, R. (2018). Multilevel Analysis. Techniques and Applications. Routledge.
- Karaboga, T., Zehir, C., & Karaboga, H. A. (2019). Big Data Analytics and Firm Innovativeness: the Moderating Effect of Data-Driven Culture. The European Proceedings of Social & Behavioural Science, Joint Conference: ISMC 2018-ICLTIBM 2018, (LIV), 526-535.
- Kirkman, B. L., & Rosen, B. (1997). A model of work team empowerment. Research in Organizational Change and Development, 10, 131-167.
- Kirkman, B. L., & Rosen, B. (1999). Beyond self-management: Antecedents and consequences of team empowerment. Academy of Management Journal, 42, 58-74.
- Korner-Nievergelt, F., Roth, T., von Felten, S., Guélat, J., Almasi, B., & Korner-Nievergelt, P. (2015). Bayesian data analysis in ecology using linear models with R, BUGS, and Stan. Academic Press.
- Kreft, I., & de Leeuw, J. (1998). Introducing statistical methods. Introducing multilevel modelling. Thousand Oaks, Sage Publications, Inc.
- Kruschke, J. K. (2015). Doing Bayesian data analysis: A tutorial with R, JAGS, and Stan. Academic Press.
- Kruschke, J. K., & Liddell, T. M. (2018). Bayesian data analysis for newcomers. Psychonomic bulletin & review, 25(1), 155-177.
- Kruschke, J. K., & Vanpaemel, W. (2015). Bayesian estimation in hierarchical models. In: J. R. Busemeyer, Z. Wang, J. T. Townsend, & A. Eidels (Eds.), The Oxford Handbook of Computational and Mathematical Psychology, (pp. 279-299). Oxford University Press.
- Littell, R. C., Milliken, G. A., Stroup, W. W., Wolfinger, R. D., & Schabenberger, O. (1996). SAS System for Mixed Models. SAS Institute Inc.
- Longford, N. (1986). VARCL-Interactive Software for Variance Component Analysis. The Professional Statistician, 5, 28-32.
- McElreath, R. (2016). Statistical rethinking: a Bayesian course with examples in R and Stan. CRC Press.
- Marr, B. (2018). Data-driven HR: how to use analytics and metrics to drive performance. KoganPage.
- Muth, C., Oravecz, Z., & Gabry, J. (2018). User-friendly Bayesian regression modeling: A tutorial with rstanarm and shinystan. The Quantitative Methods for Psychology, 14(2), 99-119. https://doi.org/1020982/tqmp.14.2.p099
- R Core Team. (2018). R: A language and environment for statistical computing. R Foundation for Statistical Computing, Vienna, Austria. https://www.r-project.org
- Raudenbush, S. W., & Bryk, A. S. (2002). Hierarchical linear models: Applications and data analysis methods. (2nd Ed). Sage.
- Renkema, M., Meijerink, J., & Bondarouk, T. (2017). Advancing multilevel thinking in human resource management research: Application and guidelines. Human Resource Management Review, 27(3), 397-415.
- Rouder, J. N., & Lu, J. (2005). An introduction to Bayesian hierarchical models with an application in the theory of signal detection. Psychonomic Bulletin & Review, 12(4), 573-604.
- Rowe, K. J., & Hill, P. W. (1998). Modelling educational effectiveness in classrooms: the use of multi-level structural equations to model students’ progress. Educational Research and Evaluation, 4, 307-347.
- Shen, J. (2016). Principle and application of Multilevel Modeling in Human Resource Management Research. Human Resource Management, 55, 951-965.
- Shen, J., Messersmith, J. G., & Jiang, K. (2018). Advancing human resource management scholarship through multilevel modeling. The International Journal of Human Resource Management, 29(2), 227-238.
- Shiffrin, R. M., Lee, M. D., Kim, W., & Wagenmakers, E. J. (2008). A survey of model evaluation approaches with a tutorial on hierarchical Bayesian methods. Cognitive Science, 32(8), 1248-1284.
- Snijders, T. A., & Bosker, R. J. (2012). Multilevel Analysis: An introduction to basic and advanced multilevel modeling. (2nd Ed.). Sage.
- Stan Development Team. (2017). Stan modeling language users guide and reference manual, version 2.17.0. http://mc-stan.org/
- Thomas, K. W., & Velthouse, B. A. (1990). Cognitive elements of empowerment. An “interpretive” model of intrinsic task motivation. Academy of Management Review, 15, 666-681.
- Wickham, H. (2016). ggplot2: Elegant Graphics for Data Analysis. Springer-Verlag.
Copyright information

This work is licensed under a Creative Commons Attribution-NonCommercial-NoDerivatives 4.0 International License.
About this article
Publication Date
13 February 2021
Article Doi
eBook ISBN
978-1-80296-100-3
Publisher
European Publisher
Volume
101
Print ISBN (optional)
-
Edition Number
1st Edition
Pages
1-224
Subjects
National interest, national identity, national security, national consciousness, social relations, public relation, public organizations, linguocultural identity, linguistics
Cite this article as:
De Giosa, M., & Maurogiovanni, A. (2021). Modern Bayesian Leadership Analytics In High-Performance Business And Sport. In C. Zehir, A. Kutlu, & T. Karaboğa (Eds.), Leadership, Innovation, Media and Communication, vol 101. European Proceedings of Social and Behavioural Sciences (pp. 152-161). European Publisher. https://doi.org/10.15405/epsbs.2021.02.14