
Demographic And Economic Peculiarities Of Migration From Tajikistan And Uzbekistan To Russia


Abstract
Analysis of the reasons for forced labour migration within the framework of the structure of migration flows is a burning issue. The research is concerned with migration flows from Tajikistan and Uzbekistan as migration from these countries results in stable population growth in Russia. Analysis of up-to-date statistics on the peculiarities of economic and demographic transformation of Tajik and Uzbek societies as well as analysis of factors influencing the formation of labour migration and structure of migration flows. This analysis allows revealing the dynamic of population growth resulting from migration, age and gender of migration flows, to assess the consequences of migration for demographic and economic stability for countries of origin and countries of residence. The conclusion that migration has led to a decrease in the male population in the countries of origin was proved a misconception. The data provided shows that labour migration from Tajikistan and Uzbekistan is caused by stable population growth, while economic growth rate and level of income remain low. The revealed peculiarities of the modern development of the countries of origin allow clarifying economic and demographic guidelines of migrants, both men and women, coming to Russia in order to earn money and to get an education.
Keywords: Demographymigrationmigration flowspopulationsecurity
Introduction
The relevance of the research on the migration process is determined by the fact that migration for the Russian Federation is inevitable and has long-term economic, social and demographic consequences. Russia is a host country for many migrants. The government of Russia considers population growth resulting from migration as a decisive factor because it is an opportunity to improve demographic indicators after the demographic crisis of the 1990s and to cope with the consequences of the low birth rate that has decreased since 2017. Migration also helps to deal with the problem of regions with low population density and low birth rate. From this point of view, the analysis of the reasons for labour migration is an essential task as it allows finding out the peculiarities of migration flows and their structure.
Problem Statement
Migration factor is reflected in the Concept of demographic security for the period until 2025. It is noted there that migration flow to Russia should not be more than 300000 migrants a year. According to the data provided about 50 % of migrants from the Commonwealth of Independent States (CIS) come from the countries of Central Asia which are relatively “young” sates and nowadays demonstrate significant rates of population growth. Migrants exert influence on demography, birth rate, death rate, marriage rate, gender stereotypes, reproduction and family traditions not only in the countries of origin but also in host countries. It is vital to understand the complexity and overall scope of this process, to carry out a joint international study of portrait of a migrant, male and female peculiarities of migration flows, dynamic and risks of the migration process. It will help to stabilize demographic and socio-economic processes in Russia and Central Asia region. The scientific issue dealt with in this research can be defined as analyzing data of national statistical agencies of Russia, Tajikistan and Uzbekistan in order to understand the reasons for forced labour migration and to forecast demographic and socio-economic consequences for the countries-participants of the migration process. The analyzed data reveals dynamic of demographic growth and peculiarities of demographic development.
Research Questions
Analysis of such demographic indicators as migration balance, number of migrants, age and gender characteristics of migrants is based on the data provided by the State Statistics Services of Russia and Uzbekistan, Statistics Agency of the Republic of Tajikistan (2018a), reports of the World Bank and research of demographers. The study deals with two main tasks: to define structural characteristics of migration flows from Tajikistan and Uzbekistan to Russia and reveal the peculiarities of the demographic situation in the countries of origin.
In order to define structural characteristics of migration flows from Tajikistan and Uzbekistan such indicators were analyzed as the structure of a migration flow, many migrants, age and gender characteristics of migrants, stereotypes related to marriage, the aim of migration, the role of migration in the economy of native countries.
Peculiarities of the demographic situation in Tajikistan and Uzbekistan were analyzed for the period of the last 15 years based on such indicators as population growth, number of working-age people, number of economically active people, the age structure of the population in Tajikistan and Uzbekistan.
Purpose of the Study
The purpose of study is to clear up the features of the demographic situation in Tajikistan and Uzbekistan based on up-to-date statistics. It allows defining the reasons for labour migration, aims of migrants, the structure of migration flows, its age and gender characteristics and demographic peculiarities.
Research Methods
The main methods are the sociological analysis of statistical information as well as specific methods within the framework of the gender approach, which helps to democratize the study and reveal the problems of labour migration that have not been discussed so far. These problems are connected with bigamy, the feminization of migration flows, abandoned families and reproduction guidelines of migrants in the host country. It allowed giving a detailed characterization of a modern migrant from Tajikistan and Uzbekistan. The research is based on the data obtained from official statistical services of Russia, Tajikistan and Uzbekistan as well as from such databases as Google Scholar, E-library, Web of Science. The following information was taken into consideration: date of issue, country of issue, official statistical data. The information was analyzed following the problem in question of the study. The research contains original charts and graphs.
Findings
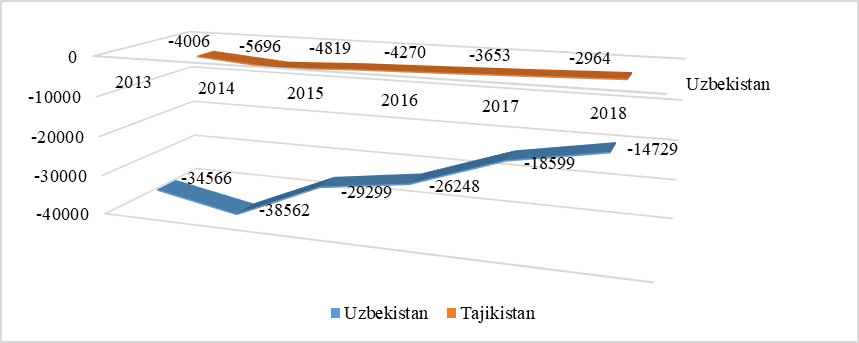
Peculiarities of migration from Tajikistan and Uzbekistan. This part is the research of data from statistical services of Tajikistan and Uzbekistan that reveal a number of important demographic indicators. Balance of migration is a key statistical parameter for demographic monitoring (Figure
The analysis of selected data helped to conclude that 50 % of Uzbeks and 90 % of Tajiks come to Russia to earn money. The second major host country for migrants from Tajikistan and Uzbekistan in Kazakhstan.
It’s shown that the majority of migrants belong to economically active population and are of the male gender. According to the deputy minister of Labor of Tajikistan Sanginzod, in 2018 men in the migration flow constituted 86.7 %, women – 13.3 %. In 2016, our port was published containing data on migrants age and gender features working on the territory of Russia. Women migrating from Tajikistan constituted 16 %, from Uzbekistan – 18 % of all foreigners in Russia (Rocheva, 2018).
Figure
We have revealed that labour migrants from Central Asian countries influence the dynamic of economic growth of their native countries, money transfers constituted 31 % of Tajikistan GDP. Russia is the significant countries-sources of money transfers – in 2017 about $20, 6 billion was transferred abroad (Ratha et al., 2019).
Negative migration balance theoretically poses a threat to the demographic situation in Uzbekistan and Tajikistan, and this issue is widely discussed in scientific circles. However, as our data show, there is a high population growth rate in Uzbekistan and Tajikistan, and it compensates for the migration population loss.
There are peculiarities of the demographic situation in Uzbekistan and Tajikistan. The rate of natural population growth in Uzbekistan has increased for the last 15 years. Table
It is clear from Table
This stable population growth becomes a problem for the economic development of Uzbekistan as the number of working-age citizens exceeds the number of job vacancies available. The minister of Economy of Uzbekistan Botir Khodjaev noted in 2018 that the working-age population amounts to 60 %. However, job creation rates lag behind the economic development of the country. Migration of economically active population has become a logical outcome of the existing situation.
The age features of the population of Uzbekistan from 2009 to 2019 also shows that economically active population constitutes about 66–67 % (the age that was taken into consideration is from 15 to 64 years old). People over 65 years old at that period amounted to 4 % (SCS of the Republic of Uzbekistan, 2018).
The data show that ageing of the population is almost unnoticeable. Rejuvenation of the population is quite intensive – around 30 % of the population are children and teenagers aged from 0 to 15. It is important to note that “young” age groups (from 0 to 4, from 5 to 9, from 10 to 14) are presented in 2009–2019 time period quite evenly, each group amounted every year to about 10 %. According to the international classification, Uzbekistan refers to “young” states – the average age of people is 25–26 years old (Maksakova, 2016).
Our study shows that the demographic situation in Tajikistan for the last 20 years is also characterized by a high rate of natural population growth. The table (Table
Table
We believe that economic conditions influence the process of formation and intensification of migration flows significantly. The most crucial economic condition is income level. A large part of the population in Tajikistan and Uzbekistan has below-average income. In Tajikistan in 2016 population with below-average income constituted 30.3 % according to the data provided by Monitoring of Sustainable Developments Goals Indicators in the CIS. In 2016 14 % lived below the poverty line (Interstate Statistical Committee of the CIS, 2019). According to the data of the WB the level of poverty in Tajikistan in 2017 decreased to 29.5 % (in 2000 it constituted 83 % of the total population), in 2018 the level of poverty was 27.4 %. According to the data obtained from the Interstate Statistical Committee of the CIS the average monthly salary in Tajikistan in 2005–2017 was the lowest in comparison with Azerbaijan, Armenia, Moldova, Belarus, Kazakhstan, Kirgizstan, Russia and Ukraine. In 2017 it was $134, it is two times lower than in Azerbaijan, Armenia, Moldova and Ukraine: three times lower than in Belarus and Kazakhstan; five times lower than in Russia (Interstate Statistical Committee of the CIS, 2019).
Poor population in Uzbekistan in 2003 amounted to 26.8 % (The World Bank Group, 2018a). According to the data of the World Atlas, the number of poor people, decreased to 15 % in 2012 and 14.1 % in 2013. Despite this, a high level of poverty remains a burning socio-economic problem. According to the state statistics of Uzbekistan, the needy population (to the needy we refer those who receive less than 2100 kcal a day) decreased from 19.5 to 11.4 % (SCS of the Republic of Uzbekistan, 2018). Besides, the number of people who live below the poverty line (under the methodology of the World Bank we refer to such people those who live on less than $1.9 a day) is quite high, and it is a significant problem. According to the statistic, 62.1 % live below the poverty line in Uzbekistan constituted in 2011(The World Bank Group, 2018c). It is important to note that poor people and those who live below the poverty line live mainly in the countryside.
There is one more crucial demographic aspect related to migration. Uzbekistan has problems with the provision of drinking water. Uzbekistan occupies the 25th place (Tajikistan – 51st) among countries having the problem of drinking water shortage (The World Bank Group, 2018b). According to the official statistical data of Uzbekistan people who have access to clean and safe drinking water constitute a bit more than half of the population (51.2 %), the majority of them live in urban areas (86.5 %) (State Committee on Statistics of the Republic of Uzbekistan, 2019).
It becomes evident that the population of Tajikistan and Uzbekistan depends very much on money transfers from relatives who have left the countries as labour migrants. This is the consequences of the outflow of the labour force from these countries. Tajikistan being the “leader” in the outflow of the labour force, its economy depends a lot on transfers money of migrants that are working in foreign countries (30–40 % of the GDP: 2017 – 36 %, 2018 – 35 %) (Statistics Agency of the Republic of Tajikistan, 2018d). Even though the dependence of the economy of Tajikistan on transfers from migrants is decreasing (in 2013 it was 49 %), it is still quite high.
Thus, the analysis of the data showed that high Percentage of sparse population, income polarization lead to inequality gap in society. It poses a threat to security, creates social tensions and hinders the economic development of a state, resulting in a further increase in migration.
Conclusion
The analysis of statistical data in our study showed that the portrait of a typical migrant has not changed for a long time. The majority of migrants are men of working age. There is an increase in female labour migration, but for now, it does not have a severe impact on the demographic situation in Russia. Feminization of migration flows is connected with the problem of “bigamy”, in order to keep families women frequently accompany their husbands leaving the country to earn money. The number of unmarried women leaving for Russia to get an education and improve living standards is growing. It leads to the transformation of reproduction policies connected with postponing marriage and procreation.
However, the majority of migrants stick to traditional reproduction norms connected with giving birth to a large number of children. Our study shows that Russia is a priority country for migrants from Tajikistan and Uzbekistan. It is remarkable, though, that the number of migrants from Uzbekistan decreased two times in 2018 in comparison with 2015. We assume that it is connected with the economic stabilization in native country and with the emergence of alternative regions for migration, for example, European countries, Turkey. Statistical data proved that labour migrants contribute a lot to the economies of their countries, for instance, transactions to Tajikistan in 2018 amounted to 31 % of GDP of the state. However, even this fact we cannot consider positive as migrants often need legal support, they lack financial literacy and usually do not know how to handle money, use it to satisfy the needs of their children, run household.
We have revealed a severe imbalance connected with considerable natural population growth and the number of job vacancies. We believe that these factors are the main reasons for labour migration growth. There is no danger that the gene pool of these countries will be undermined, as for Russia, migration, on the whole, has a positive impact on the demographic situation because of the existing gender disproportion. There are much more women of childbearing age than men.
It should be noted that migrants integrate easily into Russian society in comparison with other countries where it is necessary to learn the language and adopt local customs and traditions. Russia is a conservative country and has with the countries under consideration the common Soviet past and culture, and it is quite attractive for labour migrants. On the whole, it can be forecast that the number of migrants from Tajikistan and Uzbekistan to Russia will not decrease, there will be an increase in migrants who come to the country to study (academic mobility). We can also predict changes in the regional distribution of migrants. It will solve the problem of uneven distribution of migration flows.
References
- FSSS of RF. (2019). Demography. International migration. Federal State Statistics Service of the Russian Federation. https://www.gks.ru/folder/12781
- GTMarket (2020). Population Growth Rate. Humanitarian encyclopedia: Research. https://gtmarket.ru/ratings/population-growth-rate/info
- Interstate Statistical Committee of the CIS. (2019). Average monthly salary. http://www.cisstat.com/rus/macro/zp-2.pdf
- Maksakova, L. (2016). Demographic and migration potential of Uzbekistan. Population, 1(1), 83–89. https://elibrary.ru/download/elibrary_25964642_10564095.pdf
- Ratha, D., De, S., Kim, E., Seshan, G., & Yameogo, N. (2019). Migration and Development Brief. World Bank Group, 2(10). https://www.knomad.org/sites/default/files/2019-04/Migrationanddevelopmentbrief31.pdf
- Rocheva, А. (2018). Migration, development, gender. Research on migration and ethnicity RANEPA. https://www.unescap.org/sites/default/files/Day%201.3%20-%20Migration%2C%20Development%20and%20Gender%20%28RUS%29.pdf
- SCS of the Republic of Uzbekistan. (2018). Demographic indicator. State Committee on Statistics of the Republic of Uzbekistan. https://stat.uz/ru/164-ofytsyalnaia-statystyka-ru/6569-demografiya2
- Statistics Agency of the Republic of Tajikistan. (2018a). Socio-demographic sector. Migration of the population, 1998–2018. https://www.stat.tj/ru/database-socio-demographic-sector
- Statistics Agency of the Republic of Tajikistan. (2018b). Socio-demographic sector. Number of people born, 1998–2018. https://www.stat.tj/ru/database-socio-demographic-sector
- Statistics Agency of the Republic of Tajikistan. (2018c). Socio-demographic sector. Population growth rates, 1998–2018. https://www.stat.tj/ru/database-socio-demographic-sectorfrom https://www.stat.tj/ru/database-socio-demographic-sector
- Statistics Agency of the Republic of Tajikistan. (2018d). Correlation between money transfers from migrants and GDP of Tajikistan for the last 10 years. https://drive.google.com/file/d/1cqyQoKbqx9JfokuR5ZpUOIOD4g09c6Fv/view?usp=sharing
- State Committee on Statistics of the Republic of Uzbekistan. (2019). Demography. Age distribution of the population. https://stat.uz/ru/164-ofytsyalnaia-statystyka-ru/6569-demografiya2
- The World Bank Group. (2018a). Aqueduct. Country rankings. https://www.wri.org/applications/aqueduct/country-rankings/
- The World Bank Group. (2018b). Poverty and shared prosperity-2018. Piecing together the poverty puzzle. https://openknowledge.worldbank.org/bitstream/handle/10986/30418/ 9781464813306.pdf
- The World Bank Group. (2018c). Mapping Extreme Poverty Around the World. https://howmuch.net/articles/people-living-in-extreme-poverty-2018
Copyright information

This work is licensed under a Creative Commons Attribution-NonCommercial-NoDerivatives 4.0 International License.
About this article
Publication Date
27 February 2021
Article Doi
eBook ISBN
978-1-80296-101-0
Publisher
European Publisher
Volume
102
Print ISBN (optional)
-
Edition Number
1st Edition
Pages
1-1235
Subjects
National interest, national identity, national security, public organizations, linguocultural identity, linguistic worldview
Cite this article as:
Morozova, N. M., Rudakova, E. K., & Lukashenko, E. S. (2021). Demographic And Economic Peculiarities Of Migration From Tajikistan And Uzbekistan To Russia. In I. Savchenko (Ed.), National Interest, National Identity and National Security, vol 102. European Proceedings of Social and Behavioural Sciences (pp. 641-648). European Publisher. https://doi.org/10.15405/epsbs.2021.02.02.80