
Global Oil Price Crisis Effect On Malaysia Oil And Gas Firms


Abstract
This study determines the effect of financial leverage towards financial performance of Malaysia’s public listed oil and gas firms before and after global oil price crisis, from the period of 2012 until 2018. This study was conducted on the data of 25 companies of oil and gas firms that are listed in Bursa Malaysia derived from Thomson Reuters. Multiple regression analysis has been used to analyze the financial leverage; asset to equity ratio, debt to equity ratio, and long term debt to total capital, and the financial performance; Return on Assets (ROA), Return on Equity (ROE), and Return on Investment Capital (ROIC). Based on the findings, only asset to equity ratio was positively and significantly impact towards financial performance. Furthermore, debt to equity ratio shows negatively significant impact towards financial performance. On the other hand, long-term debt to total capital claimed negatively significant impact towards ROA and ROIC. However, long-term debt to total capital was found to be negatively and insignificant related to the ROE. It can be concluded that, there are negative relationship between financial leverage and financial performance of public listed oil and gas firms in Malaysia. This study recommend that public listed oil and gas firms in Malaysia should improve on their leverage to perform better their financial performance. As a conclusion, investors and mana
Keywords: Financial leveragefinancial performanceglobal oil price crisisoil and gas firms
Introduction
Firms’ financial performance had been a major concern of the stakeholders which includes the managements, shareholders, and employees as the firm’s performance to ensure the continuity and the longevity of the firm. Therefore, the firm’s financial performance is commonly measured by their profitability as any decision made need to consider the profitability of the firm. Since a long time, it had been a major concern towards the firms’ management team as well as business researcher to study the factors that can affect the profitability of a firm (Alarussi & Alhaderi, 2018; Farooq & Masood, 2016). This is because any decision made must take into account to the risk of the firm’s profitability. Hence, by identifying the factor that affect the profitability or financial performance of the firm, managers may emphasize a thorough decision in regards of the firm. Several finance researchers had asserted that financial leverage is the topmost factors that can affect the firm’s profitability such as Alarussi and Alhaderi (2018), Farooq and Masood (2016).
Moreover, financial leverage had been treated as one of the method for firms in order to finance their operation. In economic boom period, higher financial leverage gives benefits to the firm but on the other hand, in economic recession, financial leverage have incompatible effect on firms profitability. This is because, economic recession period may bring cash flow problems to the firm and firm might not be able to meet its interest charges. In order to enhance returns of the firms, financial management need to make capital structure decisions which include a combination of financial tools of debt and equity (Raza, 2013). Next, financial managers need to make choices on how far extent to use debt or how far extent in acquiring equity in financing the firms’ assets. Making the right choices by balancing these two is important to the managers in order to ensure the continuity of the firm. Thus, it is vital for the managers to know how far the extent the financial leverage affecting the profitability of the firms.
Furthermore, the relationship between financial leverage and financial performance had been studied by several researchers, but there are limited studies that focused on oil and gas firms in Malaysia. Below are several studies that had been done on the relationship between financial leverage and financial performance (Refer Table
Problem Statement
Oil and gas sector plays a vital role in Malaysia economic situation. It was remained as one of the most contributor which had contribute 20 to 30 percent of Malaysia’s Gross Domestic Product (GDP) (Export Government, 2019). With the current crude oil price shock (Export Government, 2019) and the fluctuating economy situation in Malaysia due to currency depreciation, it is important for management of oil and gas firms in Malaysia to put proper concern on their financial performance in order to ensure that their firm is profitable.
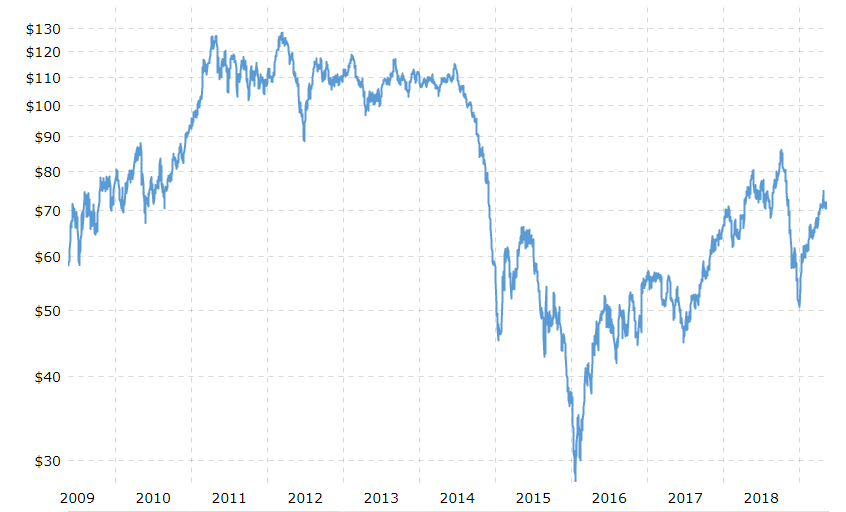
Currently, the crude oil prices fluctuated heavily globally in the past three decades and become more volatile than they were over the period from World War II to the early 1970s. In 2014, the world had watched the steep drop in the price of crude oil (Refer Figure
Firms Profitability
Alarussi and Alhaderi (2018) defined profitability as the earnings of a company that are generated from revenue after deducting all expenses incurred during a given period. Over the years, the determinant of firms’ profitability had been a focus of numerous studies (Alarussi & Alhaderi, 2018; Isik & Tasgin, 2017; Malik, 2011; Sivathaasan et al., 2013; Škuflić et al., 2016). According to Malik (2011), profitability can be measured using Return on Assets (ROA), Return on Investment (ROI), and Return on Equity (ROE).
Malik (2011) identified that size of company, volume of capital, loss ratio, and leverage ratios have significant impact on the ROA. In addition, Sivathaasan et al. (2013) was found that capital structure and non-debt tax shield have statistically significant impact on profitability. However, working capital, growth rate and firm size have no significant effect on the profitability. Their study is focusing on the factors that determine the profitability of public listed manufacturing company in Sri Lanka using ROA and ROE as measurement of profitability.
Moreover, Devi and Devi (2014) found that financial leverage, capital structure and firm size have a significant relationship with corporate profitability. Their study is focusing on identifying the determinants of firm’s profitability of public listed firms in Pakistan using ROA as a measurement of profitability. Besides, Alarussi and Alhaderi (2018), study on factors affecting profitability of public listed firms in Malaysia. The result shows a strong positive relationship between firm size, working capital, company efficiency and profitability. On the other hand, debt equity ratio and leverage ratio shown significant but negative relationship with profitability.
Financial Leverage and Profitability
Financial leverage is a measure on how much firm uses equity and debt to finance its assets (Abubakar, 2015). Financial leverage takes the form of loan or other borrowing, the proceeds of which are re-invested with the intent to earn a greater rate of return than cost of interest. While leverage may allow the investors to have greater potential return, nonetheless, the potential loss is also greater if the investment failed as the loan principal and accrued interest on the loan still need to be repaid (Chui et al., 2002). Thus, as debt increases, financial leverage also increases. Besides, the impact of financial leverage on profitability of firms had been studied by numerous researchers (Abubakar, 2015; Banafa et al., 2015; Nissim and Penman, 2003). For instance, financial leverage can be measured by asset to equity ratio, debt to equity ratio, and long term debt to total capital (Malik, 2011).
In the study done by Akinlo and Asaolu (2012), the impact of leverage on profitability for the period 1999 to 2007 of firms in Nigeria, they were found that leverage has significantly brought negative impact on the profitability of the firms. They argued that firms need to reduce their debt ratio to boost their profit level as the used of debt by firms in Nigeria decreases profitability. This study was supported by Javed et al. (2015) as their result also indicate that financial leverage has negatively and significantly impact towards profitability of textile firms in Pakistan. They proposed that organizations will in general acquire debt less on the ground that organizations keep up the adequate measure of assets internally. In addition, Banafa et al. (2015) also identified that financial leverage has negatively and significantly impact the profitability of public listed non-financial firms in Kenya. The data of study used from the period of 2009 to 2013. These results also claimed by Alarussi and Alhaderi (2018); Devi and Devi (2014); Farooq and Masood (2016); Kumar Singh and Bansal (2016); Malik (2011); and Mule and Mukras (2015).
However, Abor (2005) was reported a significantly positive relationship between total debt, total assets and profitability measured by ROE. He focused on data of public listed firms in Ghana during a five-year period. From the findings, he was suggested that firms are able to maximize their profits if they employ more debt. It was consistent with Chandrakumarmangalam and Govindasamy (2010), financial leverage is positively related to profitability of cement firms in India. They also proposed that when firms are able to employ more debt, it will be resulted to maximize in shareholders’ wealth. On the other hand, Abubakar (2015) found that financial leverage proxy by debt ratio has insignificant relationship with financial performance surrogated by ROE. In conclusion, most of the studies illustrated that financial leverage as a prominent factor of firms’ profitability (Alarussi & Alhaderi, 2018; Farooq & Masood, 2016).
Research Questions
Is there any significant effect of financial leverage towards financial performance of Malaysia’s oil and gas firms before and after global oil price crisis?
Purpose of the Study
Thus, this study aims to investigate the effect of financial leverage towards financial performance of Malaysia’s oil and gas firms before and after global oil price crisis
Research Methods
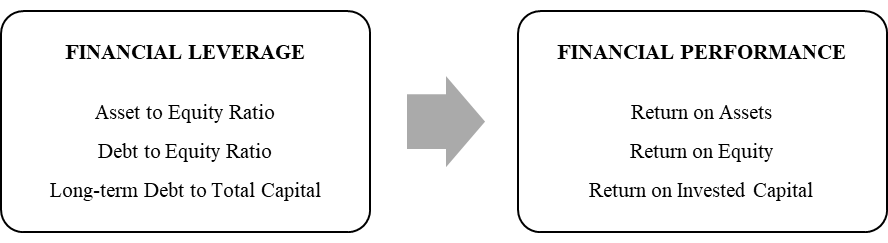
In this study, financial leverage was presented by asset to equity ratio, debt to equity ratio, and long-term debt to total capital. On the other hand, financial performance was presented by Return on Assets (ROA), Return on Equity (ROE), and Return on Invested Capital (ROIC). Data were collected from Thomson Reuters of 25 oil and gas firms listed in Bursa Malaysia from year 2012 until 2018. Multiple regression analysis was conducted to measure the relationship between the variables. The findings of analysis have been generated using IBM SPSS Statistics 24. Figure
Multiple regression model:
β1,2,3 = Regression coefficient; χ1 = Asset to equity ratio; χ2 = Debt to equity ratio; χ3 = Long-term debt to total capital; ε = Error term
Findings
Financial Leverage towards Return on Assets (ROA)
Table
Financial Leverage towards Return on Equity (ROE)
Table
Financial Leverage towards Return on Invested Capital (ROIC)
Table
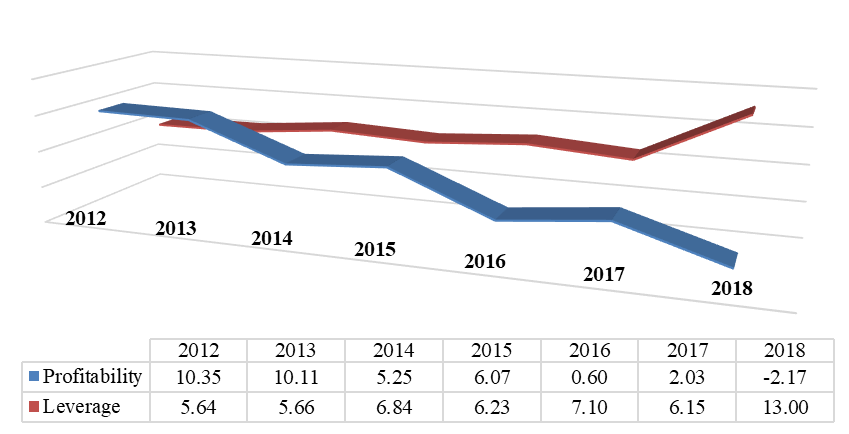
Financial Leverage towards Financial Performance
Figure
Acknowledgments
This project is financially supported by Human Resource Grant (RJO10436492) from Universiti Tenaga Nasional (UNITEN).
References
- Abdur Rouf, M. (2015). Capital Structure and Firm Performance of Listed Non-Financial Companies in Bangladesh. International Journal of Applied Economics and Finance, 9(1), 25–32.
- Abor, J. (2005). The Effect of Capital Structure on Profitability: An Empirical Analysis of Listed Firms in Ghana. The Journal of Risk Finance, 6(5),438–445.
- Abubakar, A. (2015). Relationship between Financial Leverage and Financial Performance of Deposit. International Journal of Economics, Commerce and Management, 3(10),759–778.
- Akinlo, O., & Asaolu, T. (2012). Profitability and Leverage: Evidence from Nigerian Firms. Journal of Business Research, 6(1),17–26.
- Alarussi, A. S., & Alhaderi, S. M. (2018). Factors Affecting Profitability in Malaysia. Journal of Economic Studies, 45(3), 442–458.
- Banafa, A. S. A., Muturi, W., & Ngugi, K. (2015). The Impact of Leverage on Financial Performance of Listed Non-Financial Firm in Kenya. International Journal of Finance and Accounting, 4(7),1–20.
- Chandrakumarmangalam, S., & Govindasamy, P. (2010). Leverage: An Analysis and Its Impact on Profitability with Reference to Selected Cement Companies in India. European Journal of Economics, Finance and Administrative Sciences, 5(27),53–66.
- Chui, A. C. W., Lloyd, A. E., & Kwok, C. C. Y. (2002). The Determination of Capital Structure: Is National Culture a Missing Piece to the Puzzle? Journal of International Business Studies, 33(1),99–127.
- Cortez, M. A. (2012). The Determinants of Corporate Capital Structure: Evidence from Japanese Manufacturing Companies. Journal of International Business Research, 11(3),121–135.
- Darko, G., & Kruger, J. (2017). Determinants of oil price influence on profitability performance measure of oil and gas companies: A panel data perspective. International Journal of Economics, Commerce and Management, 5(12), 993-1006.
- Devi, A., & Devi, S. (2014). Determinants of firms’ profitability in Pakistan. Research Journal of Finance and Accounting, 5(19), 87-91.
- Export Government. (2019). Exporting to Malaysia - Market Overview. Retrieved on 24 October, 2020, from https://www.export.gov/article?series=a0pt0000000PAuNAAW
- Farooq, M. A., & Masood, A. (2016). Impact of Financial Leverage on Value of Firms: Evidence from Cement Sector of Pakistan. Research Journal of Finance and Accounting, 7(9),73–77.
- Gill, A., & Biger, N. (2011). The Effect of Capital Structure on Profitability: Evidence from the United States. International Journal of Management, 28(4),1–3.
- Isik, O., & Tasgin, U. F. (2017). Profitability and Its Determinants in Turkish Manufacturing Industry: Evidence from a Dynamic Panel Model. International Journal of Economics and Finance, 9(8), 66.
- Javed, B., Ali, M., & Ali, S. A. M. (2012). Interrelationships between capital structure and financial performance, firm size and growth: comparison of industrial sector in KSE. European Journal of Business and Management, 4(15), 2222–2839.
- Javed, Z. H., Rao, H. H., Akram, B., & Nazir, M. F. (2015). Effect of financial leverage on performance of the firms: Empirical evidence from Pakistan. SPOUDAI-Journal of Economics and Business, 65(1-2), 87-95.
- Kumar Singh, A., & Bansal, P. (2016). Impact of Financial Leverage on Firm’S Performance and Valuation: A Panel Data Analysis. Indian Journal of Accounting, 73(2), 972–1479.
- Macrotrends. (2019). Crude Oil Futures - Price & Chart. https://www.macrotrends.net/futures/crude-oil
- Malik, H. (2011). Determinants of Insurance Companies Profitability: An Analysis of Insurance Sector of Pakistan. Academi Research International, 1(3), 315–321.
- Mule, R. K., & Mukras, M. S. (2015). Financial Leverage and Performance of Listed Firms in a Frontier Market: Panel Evidence from Kenya. European Scientific Journal, 11(7), 547–563.
- Nissim, D., & Penman, S. H. (2003). Financial Statement Analysis of Leverage and How It Informs about Profitability and Price-to-Book Ratios. Review of Accounting Studies, 8(4), 531–560.
- Raza, M. W. (2013). Affect of financial leverage on firm performance. Empirical evidence from Karachi Stock Exchange.
- Singapurwoko, A., & El-Wahid, M. S. M. (2011). The Impact of Financial Leverage to Profitability Study of Non-Financial Companies Listed in Indonesia Stock Exchange. European Journal of Economics, Finance and Administrative Sciences, 12(32), 136–148.
- Sivathaasan, N., Librarian, A., Tharanika, R., Sinthuja, M., & Hanitha, V. (2013). Factors Determining Profitability: A Study of Selected Manufacturing Companies Listed on Colombo Stock Exchange in Sri Lanka. European Journal of Business and Management, 5(27), 2222–2839.
- Škuflić, L., Mlinarić, D., & Družić, M. (2016). Determinants of Firm Profitability in Croatias’ Manufacturing Sector. International Conference on Economic and Social Studies, 269–282.
- Ulzanah, A. A., & Murtaqi, I. (2015). The Impact of Earnings per Share, Debt to Equity Ratio, and Current Ratio towards the Profitability of Companies Listed in Lq45. Journal of Business and Management, 4(15),18–20.
Copyright information

This work is licensed under a Creative Commons Attribution-NonCommercial-NoDerivatives 4.0 International License.
About this article
Publication Date
30 December 2020
Article Doi
eBook ISBN
978-1-80296-099-0
Publisher
European Publisher
Volume
100
Print ISBN (optional)
-
Edition Number
1st Edition
Pages
1-905
Subjects
Multi-disciplinary, accounting, finance, economics, business, management, marketing, entrepreneurship, social studies
Cite this article as:
Ismail, N., & Mazlan, N. (2020). Global Oil Price Crisis Effect On Malaysia Oil And Gas Firms. In N. S. Othman, A. H. B. Jaaffar, N. H. B. Harun, S. B. Buniamin, N. E. A. B. Mohamad, I. B. M. Ali, N. H. B. A. Razali, & S. L. B. M. Hashim (Eds.), Driving Sustainability through Business-Technology Synergy, vol 100. European Proceedings of Social and Behavioural Sciences (pp. 541-549). European Publisher. https://doi.org/10.15405/epsbs.2020.12.05.58