
Discomfort, Uncertaınty and Fear Surroundıng The Social Inclusıivity Of PWDs at Work


Abstract
The main aim of this study is to identify factors that may affect the quality of interaction and attitude of the public towards PWDs in Malaysia utilizing Interactions with Disabled Person’s Scale (IDP). It is an analysis instrument with 20-item scale, which were then divided into six correlated dimensions (Discomfort, Sympathy, Uncertainty, Fear, Coping and Vulnerability) tapping different aspects of discomfort during contact with PWDs. In this research, subscales representing 3 dimensions (Discomfort, Uncertainty and Fear) out of the 6 IDP dimensions were utilized to measure interaction and, 3 variables (gender, level of education and level of income) were further engaged in order to understand their influence to the measured interaction. Employee from a huge listed organization with branches all over the country were chosen as the respondent of this study. Descriptive analysis method was utilized to analyse accumulated data. Frequencies, percentages and Crosstabulation methods were used to produce results of data that were then compared between categories of respondents. Next, the results were further tested with Chi-Square Test for evidence of relationship before finally tested with Gamma Coefficient for the strength of relationship. Female respondents have higher tolerance to reject the feeling of discomfort, hinted a higher level of confidence and indicated a higher level of openness in communicating with PWDs as compared to male respondents. Respondents with higher level of education have higher capacity to overcome the feeling of discomfort, possess higher capability to communicate with confidence and were more ready to communicate openly with PWDs.
Keywords: People with disabilitiessocial inclusionIDP
Introduction
An attitude is a feeling toward a person or thing. In medicine, a physician’s attitude toward a patient (i.e., a disabled person) or situation is important because prevailing attitudes and misconceptions can be potential barriers to successful diagnosis and treatment. More alarming than that, negative attitudes of peers may adversely influence the beliefs of other physicians, compounding the adverse outcomes of the negative attitudes (Tervo et al., 2002). Numbers of research to understand the attitude of public towards People with Disabilities (PWDs) were conducted. The results show that attitudes towards disabled people have improved. Prejudice towards disabled people, however, is still widespread. Respondents (the public) from a conducted research expressed views that suggest they see disabled people as less capable than non-disabled people (Stanlland, 2010). A research that was done in British indicated that 43% of the British public say they do not know anyone who is disabled. Many are worried that they will do or say the wrong thing when talking to disabled people (Aiden & McCarthy, 2014). Prejudice that people have against PWDs may originate from lack of communication with them, thus, creating misunderstanding. Hence, understanding the perception and interaction pattern of the public toward PWDs would be utmost important prior to deciding measures that may effectively counter such negative attitude. Interactions with Disabled Person's Scale (IDP) is one of the well-known and reliable instruments to measure attitudes towards PWDs. Invented by Gething in the year 1991, IDP was designed for such purpose. It is an analysis instrument with 20-item scale which were then divided into six correlated dimensions (Discomfort, Sympathy, Uncertainty, Fear, Coping and Vulnerability) tapping different aspects of discomfort during contact with PWDs (Forlin et al., 1999). This research attempted to look into the measuring of public attitudes towards PWDs in Malaysia utilizing IDP.
Problem Statement
Study on the changes of the attitudes and treatment towards PWDs was done by Edmonds (2005) and Opoku-Boadi (2015). They both categorized the period of transformation into three stages/models that are the Charity Model (principal up to WWII), the Medical Model (after WWII) and the Social Model (from 70s onwards). According to the Charity Model, PWDs were viewed by the society as dependent and with no capacity to contribute to their communities. Basic survival rather than empowerment was the priority in the context of aid. Extreme opinion even suggested PWDs as dangerous, weird, and scary and need to be “institutionalized” for the “good and protection of society”. During the period of Medical Model, PWDs were perceived as “sick” and empowerment was limited to achieving functional independence through rehabilitation. This allowed medical professional to control the lives of PWDs. They were institutionalized and isolated from the community. Input by PWDs or even their family members were not normally viewed as a necessary in decision-making process. The Social Model emerged as a result of a political movement led by PWDs to deconstruct the medical model of disability. The rights of persons with disabilities and the importance of overcoming economic, social, and environmental barriers that impede their ability to participate in community life fully were highlighted.
The harder part of being disabled is that being regarded as disabled which focuses less on the extent of an individual’s actual impairment and more on how others perceive the individual, as well as the effect of those perceptions on the attitudes toward, and assumptions about, the individual’s abilities (Merckerson, 2017). Such understanding influences attitudes towards disability. Though compared to decades ago the level of understandings and consciousness towards PWDs has increased to a significant positive degree in various dimensions and manifestations, differences in terms of culture-to-culture and countries do exist (Singh, 2010). Inclusive measures for the disabled typically include the integration of people with special needs in normalized social groups which lacking that specific need or difficulty. This is seen as the only way to achieve inclusive cohabitation and thus an improved quality of life for everyone. People with special needs are forced to fit in societies that are too busy to focus on such needs. If those who are considered “normal” do not show a favorable attitude toward the inclusion of those who do not have their characteristics, they will not be able to help them reach this goal and inclusion will be doomed (Novo-Corti, 2010). The creating of such favorable attitude is a huge challenging task and yet it (the attitude) is the most important factor that may bring lasting positive change on public’s view and understanding about disability.
The relationship between the attitudes and the behaviour can better be understood if we accept the assumption that human beings are rational enough to take into account any implication that may result from their actions. In other words, a person learns from experience how the social environment reacts to his/her reactions and behaves accordingly (Gonen & Grinberg, 2016). The problems were the prevailing social norms, environmental barriers, and negative attitudes constructed and held by other members of society towards disability. Social inclusion helps decrease attitudinal barriers against them and it is society that has to adapt to impairment, not the individual to society. Study conducted by Kornélia Lazányi (2014) noted that those who have some experience in living/working with PWDs are far more understanding, accepting and willing to engage in interactions, than those, who do not have such experience. Hence, analysing history of past interactions, the quality of interactions and factors that influence both are key in understanding public attitude towards PWDs.
Research Questions
The research attempted to look into factors or variables that influences the quality of interaction of the public towards PWDs in Malaysian context. Subscales representing 3 dimensions (Discomfort, Uncertainty and Fear) out of the 6 IDP dimensions were utilized to measure interaction and, 3 variables (gender, level of education and level of income) were further engaged in order to understand their influence to the measured interaction. The main question for the research is, “Do gender, level of education and level of income affect the quality of interaction and attitude of the public towards PWDs (hence their social inclusivity) in Malaysia?”
Purpose of the Study
The main aim of this study is to look into factors or variables that may affect the quality of interaction and attitude of the public towards PWDs (hence, their social inclusivity) in Malaysia. This paper is divided into seven parts. The “Introduction” discussed in brief about the attitude and behavior towards disability, misconception about disability and the need to employ reliable instrument to measure public’s attitude towards PWDs in Malaysia. Second, third and fourth part stated the Problem Statement, Research Questions and Purpose of Study for the research. Fifth, the “Research Methods” provided explanation about the research design, instrument, data collection process and analyzing style utilized in this research. Sixth, the “Findings” provided data and analysis summary on demographic trend of respondents, statistical data on the pattern of interaction of the public towards PWDs in Malaysia (measured through IDP), and the effect of age, education and income variables to such interaction. The final part, the “Conclusion”, summarized and concluded the whole findings and issues highlighted in this paper.
Research Methods
The main aim of this research was to identity the public trend toward the social inclusivity of persons with disabilities (PWDs) at work place. Descriptive analysis method was utilized to analyze accumulated data. Frequencies, percentages and cross tabulation methods were used to produce results of data that were then compared between categories of respondents. Next, the results were further tested with Chi-Square Test for evidence of relationship before finally tested with Gamma Coefficient for the strength of relationship. Employees from a huge listed organization with branches all over the country were chosen as the respondent of this study. Along with the staffs form the head quarter (both male and female regardless of age), staffs from 11 branches and 1 subsidiary (all located in Kelang Valley) were involved in this research. 4 categories of staff (Executive Management, Executive Technical, Non-Executive Management and Non-Executive Technical) were included in this research. In order to minimize answering errors, researchers went to all the branches and personally briefed the structure of the questionnaire to the appointed person-in-charge prior to distributing them.1200 questionnaires were distributed and 700 were returned (58.4%). 671 questionnaires (55.9%) were valid with information and utilized in this research.
The study utilized a questionnaire that was partially developed by the researchers combined with the Interaction with Disabled Persons Scale (IDP). The Interactions with Disabled Person's Scale (IDP) was designed by Gething in 1991 to measure attitudes towards people with a disability. IDP was developed due to the fact that there were a limited number of scales assessing attitudes towards people with disabilities that are suitable for use outside of United States (Gething, 1991). The instrument was then further refined by Forlin et al. (1999) who re-cluster the 20 original subscales into 6 correlated dimensions (Discomfort, Sympathy, Uncertainty, Fear, Coping and Vulnerability) and tested in other countries. Her study confirmed that IDP is equally valid to be used elsewhere than the ground where it was originally designed and meant to be used. All the dimensions from IDP were tested in this research and 3 (Discomfort, Uncertainty and Fear) will be presented in this paper. The dimension of Discomfort, Uncertainty and Fear was then crosstabulated with Gender, Level of Education and Level of Income variables for correlation identification. The data analysis for this study was done using SPSS software (version 22).
Findings
Demographic Trend of Respondents
A total of 671 valid questionnaires were used as a source of data for this study (see Table
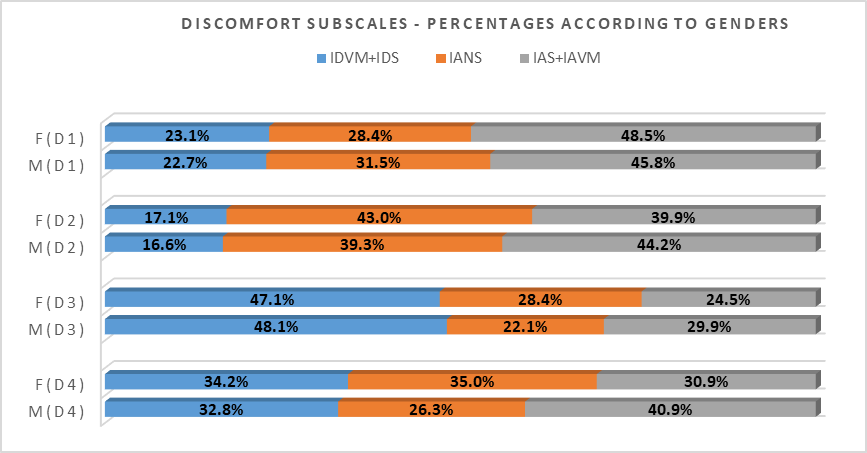
Discomfort of Contact with PWDs
The dimension of Discomfort for IDP is represented by 4 subscales as listed below:
Discomfort Subscale 1 (D1): Item11 - I cannot help staring at them.
Discomfort Subscale 2 (D2): Item16 - I feel overwhelmed with the discomfort about my lack of disability.
Discomfort Subscale 3 (D3): Item17 - I am afraid to look at them straight in the face.
Discomfort Subscale 4 (D4): Item18 - I tend to make contacts with them only in brief and finish them as quickly as possible.
In term of “Gender”, it was noted from Figure
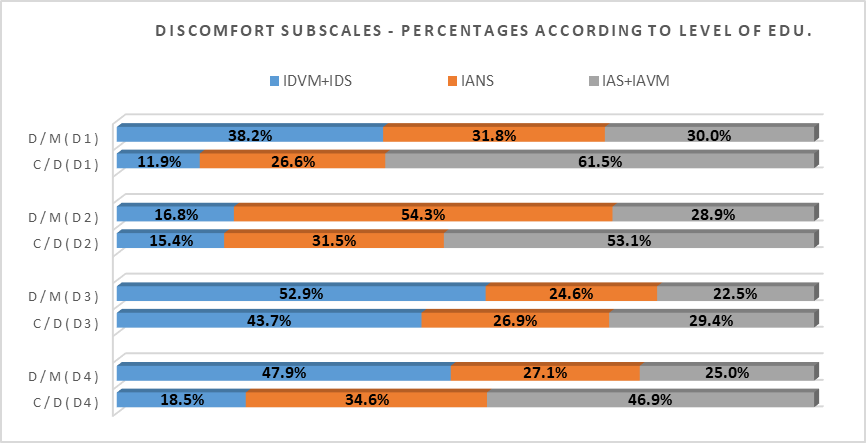
Two categories of data (C/D: Certificate & Diploma holder and D/M: Degree & Master holder) were compared to understand the trend of discomfort in communication (with PWDs) based on the “Level of Education” possess by respondents. Figure
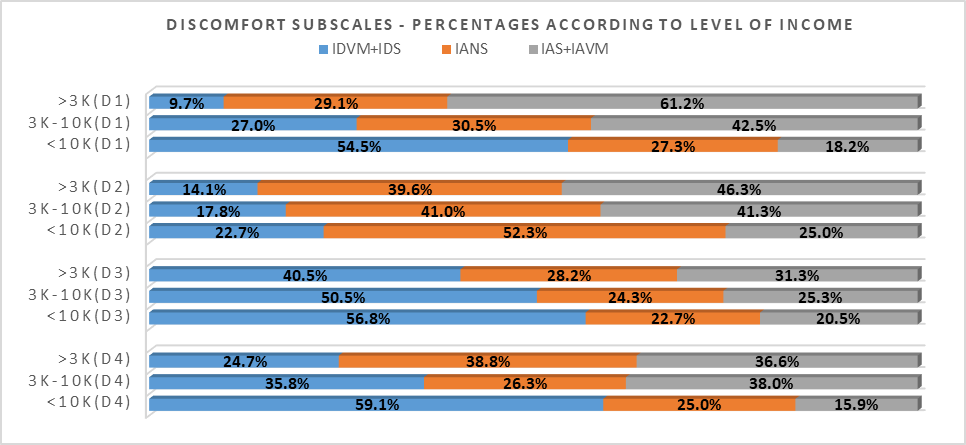
Figure
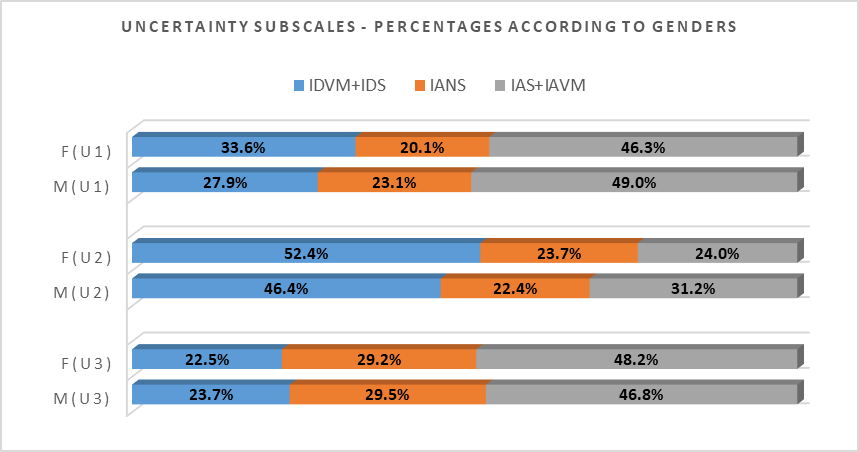
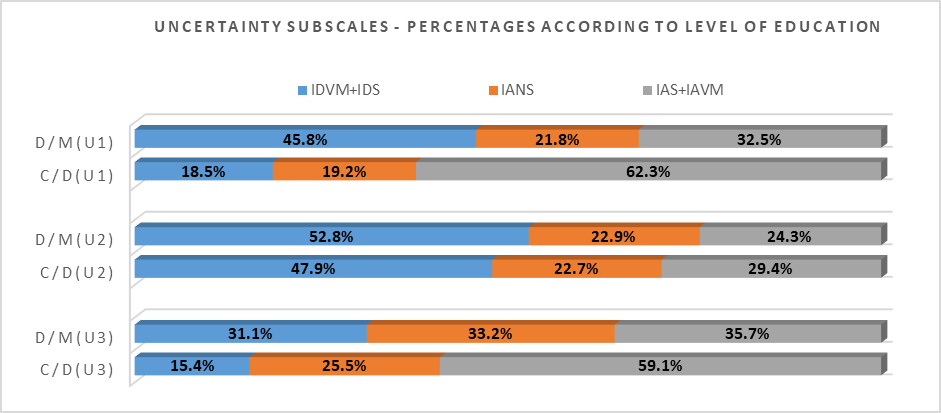
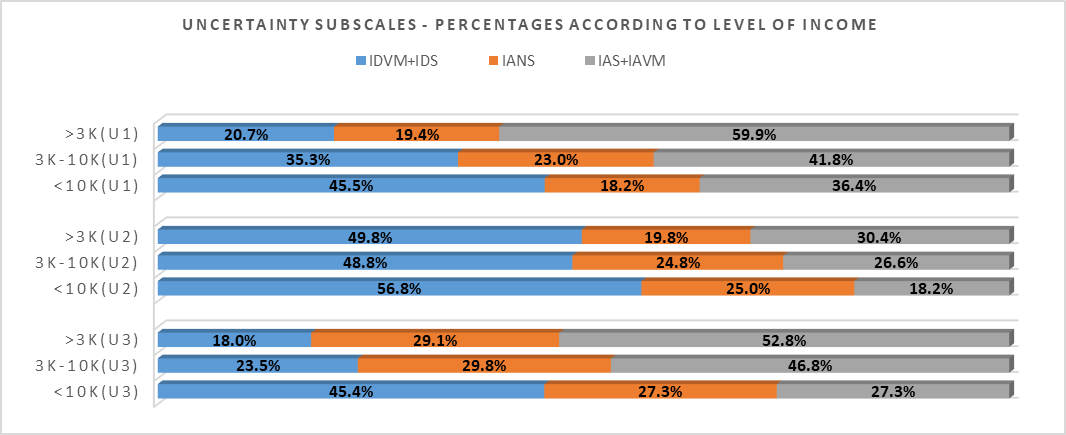
Uncertainty in terms of contact with PWDs
The dimension of Uncertainty for IDP in this study is represented by 3 subscales as listed below:
Uncertainty Subscale 1 (U1): Item 6 - I feel ignorant about disabled people.
Uncertainty Subscale 2 (U2): Item 9 - I feel uncomfortable and find it hard to relax when communicating with them.
Uncertainty Subscale 3 (U3): Item 12 - I feel unsure because I don’t know how to behave.
In term of “Gender”, it was observable from Figure
Figure
Figure
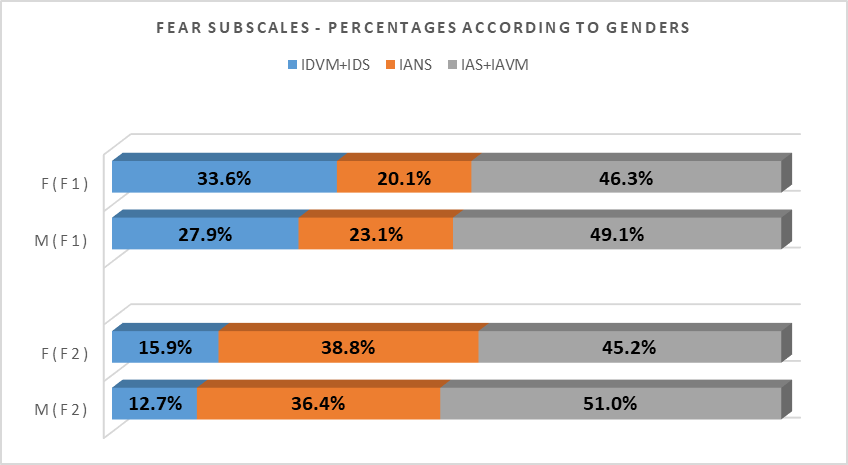
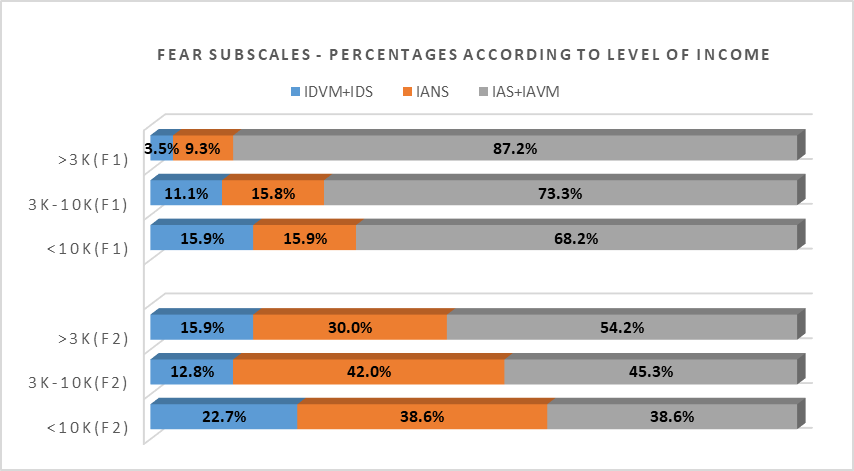
Fear in terms of contact with PWDs
The dimension of Fear for IDP is represented by 2 subscales as listed below:
Fear Subscale 1 (F1): Item 7 - I am grateful that I do not have such a burden.
Fear Subscale 2 (F2): Item 20 - I dread the thought that I could eventually end up like them.
Figure
Figure
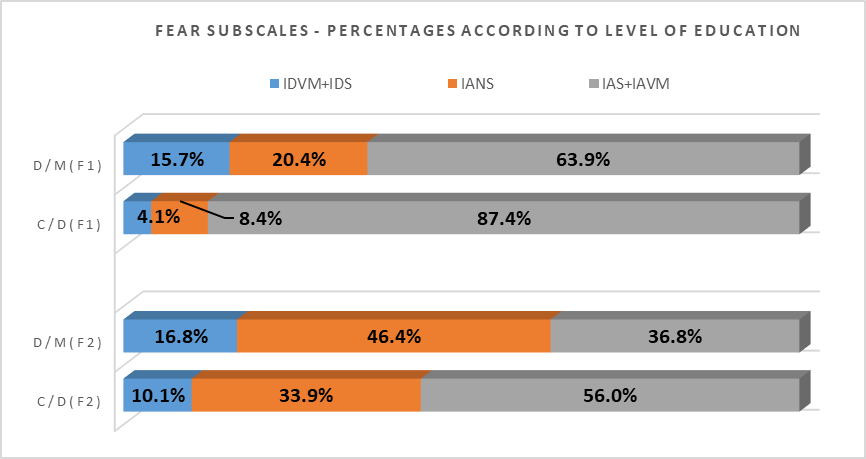
Figure
Conclusion
Discomfort people feel about disability may stem from a lack of communication and understanding. Everyday interactions and greater public education about disability may increase understanding and acceptance of disabled people (Aiden & McCarthy, 2014). Interactions with Disabled Person's Scale (IDP) was designed to measure attitudes towards people with a disability. In this study, 3 out of 6 of its dimensions were engaged to understand the interaction attitudes of Malaysian toward PWDs. The 3 dimesions (Discomfort, Uncertainty and Fear) were then further crosstabulated with variables such as Gender, Level of Education and Level of Income. Statistical data for the study were purposely clustered into 3 large groups (IDVM+IDS, IANS and IAS+IAVM) for easier identification of the general trend of respondents’ interaction attitude toward PWDs.
Statistical data for “Gender” indicated that female respondents exhibited slightly lower percentages of agreeing (IAS+IAVM) to subscales representing all tested dimensions. In other words, female respondents have higher tolerance to reject the feeling of discomfort while communicating with PWDs, exhibit a higher level of confidence in communicating with PWDs and indicated a higher level of openness (without fear or prejudice) and readiness in communicating with PWDs as compared to male respondents. The result of these findings is aligned with earlier conducted research by Stanlland (2010) who noted, “Women are more likely than men to express positive attitudes towards disabled people”. These findings also reconfirmed result attained by Forlin et al. (1999) who discovered, “female undergraduates students have more positive attitudes towards people with disabilities” compared to male undergraduate students. Tervo et al. (2002) also noted that “Gender and background in disability influenced attitudes. Male medical students were more likely to hold negative attitudes”. However, the difference of percentages between male and female respondents from this research were minimal that they failed to be reflected through the correlation analysis conducted.
Statistical data for “Level of Education” from this study were constantly indicating a clear trend that a higher level of education incline to exhibit a lower percentage of agreement to the subscales representing all the tested dimensions. Respondents with higher level of education have higher capability to overcome the feeling of discomfort when communicating with PWDs, possess higher capability to communicate with confidence to PWDs and were more ready to communicate openly (without fear and prejudice) with PWDs. Findings by Stanlland (2010) too indicated that, “respondents with higher levels of education and those with higher incomes had more positive attitudes towards disabled people”. Findings by Forlin et al. (1999) further suggested that, “those having lower levels of education in the normative sample showing greater discomfort in their interactions with people with a disability” further support the findings from this research. Results from correlation test using Crosstabulation method yielded partial results on the existence of evidence of relationship between “Level of Education” and tested subfactors. Though most of the subfactors indicated the existence of evidence of relationship with “Level of Education”, results from conducted relationship strength test using Gamma coefficient suggested either the existing relationship were “weak” or “no association”.
Statistical data for “Level of Income”, identical to “Level of Education”, showed a consistent trend indicating that respondents with a higher level of income tend to agree less with subscales representing all the tested dimensions. They may have higher tendency to be able to communicate well and in comfort with PWDs if compared to respondents with lower level of income. As stated above, this finding too was supported by earlier findings done by Stanlland (2010) who indicated, “a higher proportion of people in the top income band were very comfortable in all situations with regard to interacting with people with physical or sensory impairments”. Results from correlation test using Crosstabulation method yielded partial results on the existence of evidence of relationship between “Level of Income” and tested subfactors. One very notable difference was that, upon tested with Gamma coefficient, among all subscale only 1 (D1) indicated the existence of a (weak) relationship. The other subscales were all indicating the score of less than 0.2 and hence categorized as “no association”. The “Level of Income” therefore, is not a strong indicator that can be utilized to understand the pattern of behavior and interaction with PWDs in Malaysian context.
The problems of social exclusion of disabled people are viewed with different lenses for different societies, and for this reason it is expected that people's attitudes towards inclusion are different depending on the environment they are in (Novo-Corti, 2010). Changing attitudes towards particular groups of people with disability requires additional information for the public to understand the specific experiences associated with these disabilities. Initiatives to support must include education, contact, information and family support so that they learn to understand the social experience of PWDs (Thompson et al., 2011). Interactions between the public with PWDs are utmost important because researches indicated that individuals who met a person with a disability tended to have more significant changes in personal attitude than those who had no contact. Constant reinforcement and refreshers are needed if attitude change is to become internalized and persistent (Daruwalla & Darcy, 2005). Further, the results of study conducted by Gonen and Grinberg (2016) also indicated the necessity to encourage individuals (i.e., students) to socialize with PWDs in order to strengthen the positive and favorable attitudes that will positively have impact on the success of the integration of PWDs into the community and society.
References
- Aiden, H., & McCarthy, A. (2014). Current Attitude towards Disabled People. www.scope.org.uk
- Baidi, N., & Ilias, A. (2019). The Acceptability towards PWDs at Work Place – Perceptions and Awareness. International Journal for Studies on Children, Women, Elderly and Disabled, 6, (January), 10-18.
- Daruwalla, P., & Darcy, S. (2005). Public Sympathy: Private Antipathy: Personal and Societal Attitudes towards People with Disabilities. Annals of Tourism Research, 32(3), 549-570
- Edmonds, L. J. (2005). Disabled people and development’; Poverty and social development papers No. 12. Poverty Reduction and Social Development Division Regional and Sustainable Development Department Asian Development Bank.
- Forlin, C., Fogarty, G., & Caroll, A. M. (1999). Validation of the factor structure of the Interactions with Disabled Persons Scale. Australian Journal of Psychology, 51(1), 50-55.
- Gething, L. (1991). Interaction with Disabled Persons Scale: Manual and kit. Sydney: University of Sydney.
- Gonen, A., & Grinberg, K. (2016). Academic Students' Attitudes toward Students with Learning Disabilities. Journal of Education and Training Studies, 4(9), 2324-8068.
- Lazányi, K. (2014). People with Disabilities – Perception and Labour Market Opportunities: FIKUSZ ’14 Symposium for Young Researchers (pp. 171-186). Hungary: Óbuda University.
- Merckerson, C. D. (2017). Employer Perceptions toward Hiring People with Disabilities. Auburn University.
- Novo-Corti, M. I. (2010). Attitudes toward Disability and Social Inclusion: An Exploratory Analysis. European Research Studies, 13(3), 83-106.
- Opoku-Boadi, D. (2015). Employers’ Perception about Capabilities of Persons with Disabilities in the Asante Mampong Municipality in the Ashanti Region of Ghana. Kwame Nkrumah University of Science and Technology.
- Singh, J. P. (2010). Changing Attitude a paradigm shift in perception: Focus on Disability Studies. Delhi Psychiatry Journal, 13(1), 101-108.
- Stanlland, L. (2010). Public Perceptions of Disabled People – Evidence from the British Social Attitudes Survey 2009. Britain. www.odi.gov.uk
- Tervo, R. C., Azuma, S., Palmer, G., & Redinius, P. (2002). Medical students’ attitudes toward persons with disability: a comparative study. Arch Phys Med Rehabil, 83, 1537-42
- Thompson, D., Fisher, K. R., Purcal, C., Deeming, C., & Sawrikar, P. (2011). Community attitudes to people with disability: scoping project (Occasional Paper No. 39). Australia: University of New South Wales. https://doi.org/10.2139/ssrn.2014423
Copyright information

This work is licensed under a Creative Commons Attribution-NonCommercial-NoDerivatives 4.0 International License.
About this article
Publication Date
30 December 2020
Article Doi
eBook ISBN
978-1-80296-099-0
Publisher
European Publisher
Volume
100
Print ISBN (optional)
-
Edition Number
1st Edition
Pages
1-905
Subjects
Multi-disciplinary, accounting, finance, economics, business, management, marketing, entrepreneurship, social studies
Cite this article as:
Baidi, N., & Ilias, A. (2020). Discomfort, Uncertaınty and Fear Surroundıng The Social Inclusıivity Of PWDs at Work. In N. S. Othman, A. H. B. Jaaffar, N. H. B. Harun, S. B. Buniamin, N. E. A. B. Mohamad, I. B. M. Ali, N. H. B. A. Razali, & S. L. B. M. Hashim (Eds.), Driving Sustainability through Business-Technology Synergy, vol 100. European Proceedings of Social and Behavioural Sciences (pp. 468-483). European Publisher. https://doi.org/10.15405/epsbs.2020.12.05.51