Study Of Hardiness Of Rural And Urban Adolescents
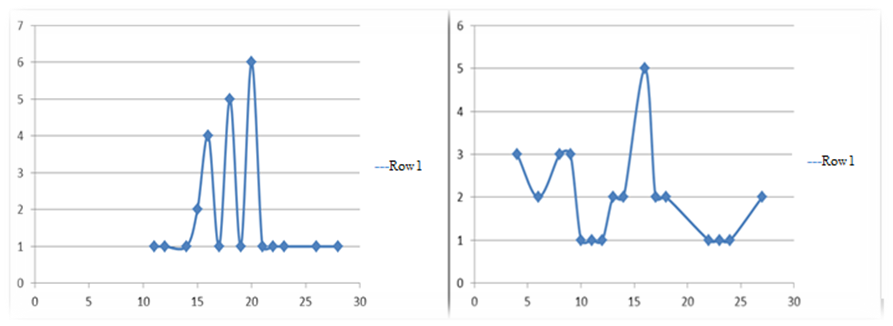
Figure 4: (left side) The curve of distribution data on the scale of "risk taking" of urban adolescents, (right side) The curve of distribution data on the scale of "risk taking" of rural adolescents. (Row 1 - «Risk taking»)