Study Of Hardiness Of Rural And Urban Adolescents
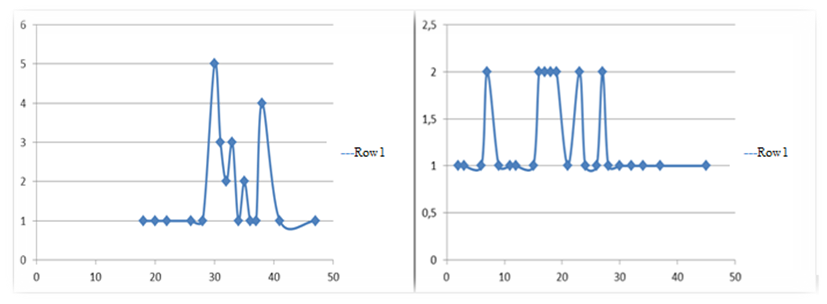
Figure 3: (left side) The curve of distribution data on the "control" scale of urban adolescents, (right side) The curve of distribution data on the "control" scale of rural adolescents. (Row 1 - «Control»)