
Influence Of Perceived Value On Satisfaction And Continuance Usage Intention: E-Hailing Services


Abstract
Customer loyalty is always an agenda that organisations would like to achieve. However, it is not an easy agenda to be achieved. This is not an exceptional agenda for collaborative consumption services particularly in e-hailing services. Therefore, to ensure customer loyalty particularly in continuance usage intention, e-hailing organisations need to focus on users’ perceived value because literature states that perceived value influences users’ satisfaction, and this will lead to customer loyalty. The Partial Least Squares (SmartPLS version 3.2.8) analysis revealed that the customer perceived value which consists of economic value, convenience value, sustainability value and hedonic value positively influence users’ satisfaction and subsequently, users’ satisfaction positively influence users’ continuance usage intention. As a result, e-hailing organisations need to improve and concentrate on their services especially those related to providing economic value, convenience value, sustainability value and hedonic value. Managerial implications as well as the future research directions are duly discussed.
Keywords: E-hailingcollaborative consumptionperceived valuesatisfactioncontinuance usage intentioncognitive-affective-conative
Introduction
The advancement in mobile technologies such as fourth generation (4G), GPS navigation as well as online payment has provided users with a new way of commuting from one destination to another. Organisations have taken the advantage of mobile technologies and offered users a platform to get their transportation. Instead of hailing a transport at a bus stop or by the roadside, users can now hail at a place convenience to them and wait for their ride to arrive at their doorstep. In other word, through smartphone, internet connection and the application (app) platform users can enjoy getting transportation in a convenient way. This service is known as e-hailing. Today, e-hailing services in Southeast Asia is forecasted to reach $20.1 billion in revenue by 2025 (Newcomer & Lee, 2018). This figure does not only show how profitable e-hailing services are but also show the rapid adoption of e-hailing services in both developed or developing countries in Southeast Asia.
Problem Statement
As more and more e-hailing services are offered in the transportation industry, retaining the current e-hailing users’ have become difficult than acquiring new users. Although e-hailing has attracted a diverse group of consumers, especially the Millennials who are born between 1980 to 2000 (Gurau, 2012) this generation has its own characteristics which make them a challenge to marketers. For example, they tend to be less loyal when compared to the previous generation (Reisenwitz & Iyer, 2009). Furthermore, they want products or services that match their personality and lifestyle (Caplan, 2005). They also have high expectations for brands and they accept the services and products that provide them the best value (Solomon, 2018). To satisfy and retain them as compared to other generations will be more difficult. Due to this, e-hailing organisations need to identify what are the values that could contribute to their satisfaction and lead to continuance usage intention.
Research Questions
To fill in this gap, the present research questions are:
Does perceived value (economic value, convenience value, symbolic value, sustainability value and hedonic value) lead to users’ satisfaction with e-hailing services among the Millennials?
Does satisfaction result in continuous usage intention in e-hailing services among the Millennials?
Purpose of the Study
Focusing on e-hailing services among the Millennials is crucial given that e-hailing is a new industry especially in Malaysia. This is obvious because e-hailing is one of the sectors that could play a role in realising the action plans set out in the National policy on Industry 4.0 and the National e-Commerce Strategic Roadmap (Zakariah, 2019). For example, Grab has invested about US$6.8 billion in acquisitions since April 2014. Furthermore, e-hailing also unlocks greater economic gains by creating jobs for Malaysian. Therefore, there is a need for e-hailing to sustain and stay competitive in the market through an understanding of the important values that users seek when they use e-hailing services. Understand this will lead to users’ satisfaction as well as result in continuance usage intention.
Theoretical foundation
The theoretical foundation for this research is based on Oliver's (1980, 1993) four-stage-loyalty model. According to this model, loyalty does not emerge simultaneously but rather consecutively over time. It involves cognitive loyalty, affective loyalty, conative loyalty and action loyalty. As a result, each of these phases involved different elements of attitude. Although this model has been applied in several context such as tourism, (Ahn & Back, 2018; Han et al., 2011) DIY market (Evanschitzky & Wunderlich, 2006) but this model has yet to be introduced and applied in e-hailing services. Based on this theory, it is suggested that users’ perceived value which is cognitive loyalty will influence customer satisfaction (affective loyalty). Affective loyalty will then result in conative loyalty which is the continuance usage intention.
Development of Research Framework and Hypotheses
Economic value
One of the main reasons why users are attracted to use e-hailing services is due to the economic value. According to Hamari et al. (2016) and Mohlmann (2015), they had identified that economic value is one of the motivation and benefits that consumers gain while using collaborative consumption services as compared to other traditional services. In addition, economic value is also one of the key determinants towards users’ satisfaction especially among the Millennials users (Mohlmann, 2015). Therefore, economic value has a positive influence on satisfaction.
Convenience value
Convenience value has become a major attractor especially for mobile technology-related services because technology, helps to fulfil users’ tasks efficiently (Anderson & Sullivan, 2008). As e-hailing services are technology-based, it allows users to hail a car at their convenience as long as they are linked to the internet and they have the app downloaded in their smartphone. As a result, services are delivered conveniently to users and this convenience value will contribute towards customers’ satisfaction.
Symbolic value
Symbolic value reflects desires for products that fulfil internally-generated needs associated with self-image or role (Park et al., 1986). Symbolic value is one of the positive outcomes in collaborative consumption services (Hwang & Griffiths, 2017). As collaborative consumption services are technology-based, Millennials would perceive that there is symbolic value in the usage of collaborative consumption services because they will regard themselves as ‘technology-savvy consumers hailing a car in style’. According to Mohlmann (2015), users who seek for symbolic value are more likely to be satisfied with collaborative consumption services. Therefore, symbolic value will have a positive influence on satisfaction.
Sustainability Value
E-hailing services are expected to be an ecologically sustainable service. According to Phipps et al. (2013) the development of collaborative consumption services especially the collaborative consumption platforms such Airbnb are used to foster more sustainable market place. Researchers such as Hamari et al. (2016) included sustainability value in their study because they found that users who use collaborative consumption services such as accommodation services (Airbnb) are environmentally concerned about ecology issues. Nevertheless, the more users believed that using e-hailing services brings about sustainability value, the more satisfied they will be with e-hailing services. Thus, sustainability value will have a positive influence on satisfaction.
Hedonic Value
Hedonic value are value received from the “multisensory, fantasy and emotive” aspect particularly on e-hailing experiences (Jones et al., 2006). Hedonic value can be found as user experience the services as they uses them (Babin & Attaway, 2000). In e-hailing services context, users can enjoy the car ride with their family and friends. They could experience riding in different types of car from one destination to another. Furthermore, they feel more relaxed when they use e-hailing services especially during heavy traffic. These pleasurable and fun experiences evoke favourable and positive feelings. Through these experiences and positive feeling, higher degree of satisfaction will occur (Hsiao et al., 2016). Therefore, hedonic value has a positive influence on satisfaction.
Satisfaction and Continuance Usage Intention
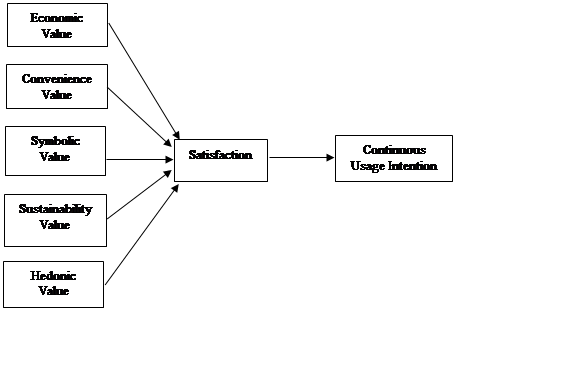
Previous empirical studies such as Bhattacherjee (2001), Hsiao et al. (2016) and Kaewkitipong et al. (2016) have found that customer satisfaction leads to continuance usage. Furthermore, customers’ continuance intention is determined by their satisfaction. According to Bhattacherjee (2001) the higher the levels of satisfaction the stronger the reuse intention particular in online context. In the collaborative consumption context, Arteaga-Sánchez et al. (2018) and Mohlmann (2015) have also found that customers who are satisfied with collaborative consumption services will result in their continuance usage. Therefore, satisfaction has a positive influence on continuance usage intention.
The research framework is shown as Figure
Research Methods
Population and Sample
This study consists of Malaysians who have experience using e-hailing services particularly GrabCar. A purposive sampling method was employed because this study focused only on users’ post purchase experiences. GrabCar users are in the best position to provide the required information for this study because GrabCar has been the longest in operation compared to other e-hailing services in Malaysia. The sample for this study was among the Millennial users who are born between 1980 to 2000 (Gurau, 2012) and are aged between 19-39 years old as of 2019. Millennial users were chosen for this research because this generation has always being linked to mobile technology and are being described as the “first high-tech generation” (Eastman et al., 2014). More importantly, Millennials are the segment that is most drawn towards collaborative consumption (Hwang & Griffiths, 2017). Furthermore, public university students were recruited for this study because public university students have limited resource of transportations as compare to the private university students. More importantly students are the early adopters of technology and are familiar with a wide range of Internet-related products. Therefore, Millennial’s experience in using GrabCar make them far more interesting subjects to be student compared to other generations.
Measurement
The items/measures of this study were adapted from several resources – perceived value: economic value (Tussyadiah, 2015); convenience value (Sigala, 2006); symbolic value (Teo & Pok, 2003); sustainability value (Hamari et al., 2016); hedonic value (Sweeney & Soutar, 2001); satisfaction (Ruiz et al., 2008) and continuance usage intention (Tsai et al., 2014). 5-point Likert scale ranging from 1=strongly disagree and 5=strongly agree were used to measure perceived value and satisfaction. Two analysis software were used for the data analysis. SPSS version 23 was used to compute the descriptive statistics for the demographic profile. SmartPLS version 3.2.8 was used for the partial least squares analysis (Ringle et al., 2015).
Findings
Demographic
A total of usable responses was 493 out of 500 responses received. Out of 493 respondents, 64.3% of the respondents are female and 35.7% percent are male. Most of the respondents are Malay (66.5%), Chinese (19.1%), other ethnic ties in Malaysia such as Dusun, Bajau, Kadazan, Rungus (9.3%) and followed by Indian (5.1%). In term of respondents’ current education background, 76.1% are doing their undergraduate, 18.5% are postgraduate student while 5.5% are diploma students.
Common method bias
As data was collected from a single source (experienced users of e-hailing services), there is a need to identify whether common method bias has occurred (Tehseen et al., 2017). Due to this, several questions about users’ cognitive rigidity (Oreg, 2003) were collected. To identify whether common method bias occurred, the method of partialling out a marker variable was implemented Podsakoff et al. (2003) by observing the R² values of the endogenous constructs before and after adding the marker variable. Table
Measurement Model
The construct validity measurement model was assessed through convergent and discriminant validity. Table
To ascertain discriminant validity of the measurement model, Heterotrait-Monotrait Ratio of Correlations (HTMT) was used. Table
Structural Model
After assessing the measurement model, the analysis then continued towards the structural model assessment. To obtain the path coefficients and the corresponding t-values, a bootstrapping procedure of 5000 samples was used. Table
According to (Falk & Miller, 1992), the threshold for R2 values should be at least surpass 0.10 in order for the variance explained of a particular endogenous construct to be deemed adequate. In this study, 50.5% of variance in satisfaction (R2=0.505) and 39.3% of variance in continuance usage intention (R2=0.393) can be explained by the model. The variables that are significant and have a positive effect on satisfaction were convenience value (β=0.197; t=5.688), economic value (β=0.146; t=3.993), hedonic value (β=0.533; t=13.865) and sustainability value (β=0.078; t=1.978). Although symbolic value (β=-0.092; t=2.169) was found to be significant, nevertheless, the relationship turned out to be an inverse one due to the negative sign, thus rendering the effect of symbolic value on satisfaction as not significant in this study. Due to this, symbolic value is not significant in this study. On the other hand, satisfaction has a positive effect on continuance usage intention (β=0.627; t=18.06). As for the lower and upper confidence limits, all of the variables did not straddle a ‘0’ rendering the abovementioned paths as significant except for symbolic value. Furthermore, it is also important to assess whether the exogenous constructs which consist of convenience value, economic value, hedonic value and sustainability value have a substantive impact on the endogenous constructs. To assess this, Cohen (1988) criteria for the effect sizes (f2) was referred where 0.02 equals to a small effect, 0.15 as a medium effect and 0.35 as a large effect. In this study, it was found that hedonic value has a medium effect (f2=0.332) on satisfaction while convenience value (f2=0.063) and economic value (f2=0.032) have a small effect. However, sustainability value has no effect (f2=0.009) on satisfaction. Besides that, the Q2 values of 0.295 and 0.269 were larger than 0, indicating the exogenous constructs have predictive relevance for their endogenous constructs (Hair et al., 2017).
Conclusion
Hedonic value has the highest impact on satisfaction. This relationship indicates that the users really experience the enjoyment and pleasure when riding on the GrabCar especially with their friends and family. As for convenience value, it has the second highest impact on satisfaction. Confirming findings of previous studies which have identified convenience value as one of the reasons why consumers participate in collaborative consumption particularly e-hailing services (Hamari et al., 2016; Milanova & Maas, 2017). As e-hailing services such as GrabCar enable users to hail a car at their convenience in terms of time and location, this convenience has led to their satisfaction. Economic value had the third most impact on satisfaction towards GrabCar. According to Möhlmann (2016), one of the reasons why users especially the Millennial use collaborative consumption services is due to cost saving. Sustainability value was found to be significant with users’ satisfaction. This finding is consistent with previous researcher Arteaga-Sánchez et al. (2018) where they also found that sustainability value led to users’ satisfaction. It is obvious that users are aware that e-hailing can contribute towards the sustainability of the environment. However, finding of symbolic value in this study contradicts findings of previous studies as symbolic value is negatively related to users’ satisfaction. Although e-hailing may be considered as a trendy way of commuting, the findings of this study suggest otherwise, indicating that perhaps Millennials have come to regard the usage of e-hailing as a standard why of commuting which is part and parcel of today’s modern lifestyle. In the early stages of the app’s diffusion, symbolic value of GrabCar usage may have been more prevalent given that the app has not reached mainstream and those who are early adopters of the app are accordingly regarded as smart, resourceful and technology-savvy. However, GrabCar usage has now become a standard way of commuting among the Millennials to the extent of eliminating any sense of novelty that can provide reduce symbolic value to the user.
From a theoretical standpoint, Oliver (1980, 1993) cognitive-affective-conative loyalty model can helped to understand the development among the Millennials’ loyalty formation process. Furthermore, this study has incorporated sustainability value that are better reflect the nature of collaborative consumption services and has validated sustainability value among the e-hailing Millennials could led to their satisfaction. From a managerial perspective, e-hailing organisation should pay attention towards the Millennials’ perception of value because it has been proven empirically that Millennial users’ perceived value will lead to satisfaction and this satisfaction could result in users’ continuance usage intention. In short, this study offers e-hailing organisations what are the important type of value that can build users’ satisfaction. The significant effect of perceived value on users’ satisfaction implies that service providers should take measures to develop user satisfaction by strengthening users’ perceived value. For example, e-hailing organisation can illustrate the convenience, relaxed and pleasure when using they use e-hailing services in their marketing communication strategies. In addition, e-hailing organisation can partner with the non-profit organisations on sustainability campaign beside offer some rebate and promotion to appreciate the users.
This study has a few limitations that should be borne in mind. As this study focused only on the Millennial generation cohort, future studies can consider other generation cohort and ascertain whether the same values that result in satisfaction and continuance usage intention among the millennials apply to other generation cohort. In addition, comparison studies can also be done between the generation cohort in the same country or in a different cultural context considering e-hailing is also growing rapidly in other countries. Future research could also explore similar research, but in different contexts of collaborative consumption such as accommodation to identify whether researchers will gain similar results. Next to that, changes in government policy should be taken into perspective. As of 29 March 2019, the Malaysian Government imposed a new regulation requiring all e-hailing drivers to undergo a test to prove the drivers fit to be e-hailing drivers as well as to apply for a public service vehicle (PSV) license should they intend to continue as GrabCar drivers. As a consequence, there will be less GrabCar drivers in the market causing supply of the services to be limited. When this happens, users’ perception of convenience as well as economic value will change. Thus, it would be interesting for scholars to examine how the perception of value in GrabCar services have changed in the near future.
References
- Ahn, J., & Back, K. J. (2018). Influence of brand relationship on customer attitude toward integrated resort brands: a cognitive, affective, and conative perspective. Journal of Travel and Tourism Marketing, 35(4), 449–460.
- Anderson, E. W., & Sullivan, M. W. (2008). The Antecedents and Consequences of Customer Satisfaction for Firms. Marketing Science, 12(2), 125–143.
- Arteaga-Sánchez, R., Belda-Ruiz, M., Ros-Galvez, A., & Rosa-Garcia, A. (2018). Why continue sharing : Determinants of behavior in ridesharing services. International Journal of Market Research, (September), 1–8.
- Babin, B. J., & Attaway, J. S. (2000). Atmospheric Affect as a Tool for Creating Value and Gaining Share of Customer. Journal of Business Research, 49(2), 91–99. https://doi.org/10.1016/S0148-2963(99)00011-9
- Bhattacherjee, A. (2001). Understanding Information Systems Continuance: An Expectation-Confirmation Model. MIS Quarterly, 25(3), 351.
- Byrne, B. M. (2016). Structural equation modeling with AMOS: Basic concepts, applications and programming (3rd editio). Routledge.
- Caplan, E. (2005, May). Brand Loyalty. Dealerscope, 60.
- Cohen, J. (1988). Statistical power analysis for the behavioural sciences. Lawrance Elrbaum.
- Eastman, J. K. ., Iyer, R. ., Liao-Troth, S. ., Williams, D. F. ., & Griffin, M. . (2014). The role of involvement on millennials’ mobile technology behaviors: The moderating impact of status consumption, innovation, and opinion leadership. Journal of Marketing Theory and Practice, 22(4), 455–470.
- Evanschitzky, H., & Wunderlich, M. (2006). An examination of moderator effects in the four-stage loyalty model. Journal of Service Research, 8(4), 330–345.
- Falk, R. F., & Miller, N. B. (1992). A primer for soft modeling. Akron, OH, US: University of Akron Press.
- Gurau, C. (2012). A life-stage analysis of consumer loyalty profile : comparing Generation X and Millennial consumers. Journal of Consumer Marketing, 29(2), 103–113.
- Hair, J. F., Hult, G. T. M., Ringle, C. M., & Sarstedt, M. (2017). A Primer On Partial Least Squares Structural Equation Modeling (PLS-SEM) (2nd Edition). Sage Publications.
- Hamari, J., Sjoklint, M., & Ukkonen, A. (2016). The sharing economy: Why people participate in collaborative consumption. Journal of the Association for Information Science and Technology, 67(9), 2047–2059.
- Han, H., Kim, Y., & Kim, E. K. (2011). Cognitive, affective, conative, and action loyalty: Testing the impact of inertia. International Journal of Hospitality Management, 30(4), 1008–1019.
- Henseler, J., Ringle, C. M., & Sinkovics, R. R. (2015). Ths use of Partial Least Squares path modeling in International Marketing. International Journal of Research in Marketing, 9(4), 319–323.
- Hsiao, C. H., Chang, J. J., & Tang, K. Y. (2016). Exploring the influential factors in continuance usage of mobile social Apps: Satisfaction, habit, and customer value perspectives. Telematics and Informatics, 33(2), 342–355.
- Hwang, J., & Griffiths, M. (2017). Share more, drive less : Millennials value perception and behavioral intent in using collaborative consumption services. Journal of Consumer Marketing, 34(2), 132–146.
- Jones, M. A., Reynolds, K. E., & Arnold, M. J. (2006). Hedonic and utilitarian shopping value: Investigating differential effects on retail outcomes. Journal of Business Research, 59(9), 974–981.
- Kaewkitipong, L., Chen, C. C., & Ractham, P. (2016). Using social media to enrich information systems field trip experiences: Students’ satisfaction and continuance intentions. Computers in Human Behavior, 63, 256–263.
- Milanova, V., & Maas, P. (2017). Sharing intangibles: Uncovering individual motives for engagement in a sharing service setting. Journal of Business Research, 75, 159–171.
- Mohlmann, M. (2015). Collaborative consumption: Determinants of satisfaction and the likelihood of using a sharing economy option again. Journal of Consumer Behaviour, 14, 193–207.
- Möhlmann, M. (2016). Digital Trust and Peer-to-Peer Collaborative Consumption Platforms: A Mediation Analysis. Ssrn, (January 2015), 1–38.
- Newcomer, E., & Lee, Y. (2018). Uber is said to reach agreement on Southeast Asia sale to Grab. https://www.bloombergquint.com/business/uber-is-said-to-reach-agreement-on-southeast-asian-sale-to-grab#gs.vbraBcI
- Oliver, R. L. (1980). A Cognitive Model of the Antecedents and Consequences of Satisfaction Decisions. Journal of Marketing Research, 17(4), 460.
- Oliver, R. L. (1993). Cognitive, Affective, and Attribute Bases of the Satisfaction Response. Journal of Consumer Research, 20(3), 418.
- Oreg, S. (2003). Resistance to change: Developing an individual differences measure. Journal of Applied Psychology, 88(4), 680–693.
- Park, W., Jaworski, B., & Maclnnis, D. (1986). Park Jaworski and Maclnnis 1986 Strategic brand conceppt image management.pdf. Journal of Marketing, 50(October), 135–145.
- Phipps, M., Ozanne, L. K., Luchs, M. G., Subrahmanyan, S., Kapitan, S., Catlin, J. R., Gau, R., Naylor, R. W., Rose, R. L., Simpson, B., & Weaver, T. (2013). Understanding the inherent complexity of sustainable consumption: A social cognitive framework. Journal of Business Research, 66(8), 1227–1234.
- Podsakoff, P. M., MacKenzie, S. B., Lee, J.-Y. Y., & Podsakoff, N. P. (2003). Common Method Biases in Behavioral Research: A Critical Review of the Literature and Recommended Remedies. Journal of Applied Psychology, 88(5), 879–903.
- Reisenwitz, T. H., & Iyer, R. (2009). Differences in Generation X and Generation Y: Implications for the organization and marketers. The Marketing Management Journal, 19(2), 91–103.
- Ringle, C., Wende, S., & & Becker, J. M. (2015). SmartPLS 3. SmartPLS GmbH.
- Ruiz, D. M., Gremler, D. D., Washburn, J. H., & Carrión, G. C. (2008). Service value revisited: Specifying a higher-order, formative measure. Journal of Business Research, 61(12), 1278–1291.
- Sigala, M. (2006). Mass customisation implementation models and customer value in mobile phones services: Preliminary findings from Greece. Managing Service Quality, 16(4), 395–420.
- Solomon, M. (2018). For small business week: All about millennial consumers and millennial - friendly customer experiences. Forbes. https://www.forbes.com/sites/micahsolomon/2018/05/03/for-small-business-week-all-about-millennial-consumers-and-millennial-friendly-customer-experiences/
- Sweeney, J. C., & Soutar, G. N. (2001). Consumer perceived value : The development of a multiple item scale. Journal of Retailing, 77, 203–220.
- Tehseen, S., Ramayah, T., & Sajilan, S. (2017). Testing and Controlling for Common Method Variance: A Review of Available Methods. Journal of Management Sciences, 4(2), 142–168.
- Teo, T. S. H., & Pok, S. H. (2003). Adoption of WAP-enabled mobile phones among Internet users. Omega, 31(6), 483–498.
- Tsai, H. T., Chien, J. L., & Tsai, M. T. (2014). The influences of system usability and user satisfaction on continued Internet banking services usage intention: Empirical evidence from Taiwan. Electronic Commerce Research, 14(2), 137–169.
- Tussyadiah, I. P. (2015). An Exploratory Study on Drivers and Deterrents of Collaborative Consumption in Travel. Information & Communication Technologies in Tourism 2015, 1070–1082.
- Zakariah, Z. (2019). Grab Ready to Increase Investment into Malaysia. New Straits Times. https://www.nst.com.my/business/2019/01/455270/grab-ready-increase-investments-malaysia
Copyright information

This work is licensed under a Creative Commons Attribution-NonCommercial-NoDerivatives 4.0 International License.
About this article
Publication Date
06 October 2020
Article Doi
eBook ISBN
978-1-80296-087-7
Publisher
European Publisher
Volume
88
Print ISBN (optional)
-
Edition Number
1st Edition
Pages
1-1099
Subjects
Finance, business, innovation, entrepreneurship, sustainability, environment, green business, environmental issues
Cite this article as:
Yapp, E. H. T., & Yeap, J. A. L. (2020). Influence Of Perceived Value On Satisfaction And Continuance Usage Intention: E-Hailing Services. In Z. Ahmad (Ed.), Progressing Beyond and Better: Leading Businesses for a Sustainable Future, vol 88. European Proceedings of Social and Behavioural Sciences (pp. 527-537). European Publisher. https://doi.org/10.15405/epsbs.2020.10.47