
Henomenon Of Russian Poverty


Abstract
The paper deals with the phenomenon of rich Russia that implies an abnormally large proportion of the poor including the so-called employed poor. This group does not have any stable socio-economic characteristics, and needs constant scientific monitoring of their lifestyle, a set of values, behavior strategy, etc. The object of the study is the indigent of the Russian Federation. The subject of the study is the progress of the main indicators to constitute the standard of living, in particular of the ‘employed’ poor. Such indicators include
Keywords: Povertycost of livingliving wagethe employed poor
Introduction
The phenomenon of rich and powerful Russia implies an abnormally large proportion of the poor, including the so-called employed poor. The social significance of poverty is an extremely relevant issue for both modern Russia and the world at large. The UN Act on Sustainable Development Goals 2015–2030 envisages the measures to eradicate poverty not only globally, but also in individual countries and regions. Fighting poverty is a necessary condition for a stable and sustainable growth of society. It is based on its social structure that meets some vital needs of the main social stratums. This principle was acknowledged in National projects to cover 12 strategic areas approved in 2018.
The study of the phenomenon is associated with the search for social technologies to prevent destructive processes that induce an increase in the scale of socioeconomic ill-being (Abrahamson, 2001). Some leading economists discuss the attempts to help poor developing countries underway towards the wealth (Easterly, 2001); the use of an institutional approach to analyze the origins of power; prosperity of some countries and poverty of others (Acemoglu & Robinson, 2012). They explore the mechanism of a market economy that creates the wealth and evens out opportunities solely in the absence of corruption. Other economists analyze the challenges of the modern US model of capitalism (Zingales, 2012), proclaim technological progress and globalization to cause a rising inequality, growth of political populism in developed countries, and, consequently, polarization of the labor market (Cowen, 2013). The Prize in Economic Sciences 2019 was awarded to A. Banerjee, E. Duflo and M. Kremer “for their experimental approach to alleviating global poverty”.
Russian economists actively address the issue of poverty, exploring the current socio-economic and mental characteristics of the country. Russian inactive population is at the center of studies (Warsaw & Denisenko, 2015), as well as the features of poverty in Moscow and the comparison of regional data with all-Russian indicators (Rzhanitsyna, 2018), the issues of the relative poverty threshold and the edge of high poverty risks (Slobodenyuk & Anikin, 2018), the tools for assessing inequality, and the neglect of a subjective component of inequality reception (Telin, 2019).
Humankind is unable to solve the problem of poverty that remains an integral feature of any society.
Problem Statement
Due to the rapid transition to a market economy in the post-Soviet era, poverty in Russia became widespread. In 2007, the share of the population with a strong paternalistic attachment to the interaction with the state amounted to three quarters of Russian residents, in 2014 – 70 %, in 2019 – 2.5 times higher than the share of those whose attitude to Soviet times was indifferent. Transformation of the Russian economy led to the emergence of able-bodied citizens that, due to their basic characteristics, can be attributed to the employed poor. This group does not have any stable socio-economic features and needs constant scientific monitoring. It is necessary to study their lifestyle, a set of values, behavioral strategies in order to make a state social policy more effective.
Low-paid Russians in a non-state sphere receive 13.9 times less salary than their high-paid fellow countrymen. This gap is 10.4 times at state and municipal enterprises. ‘Employed poverty’, a unique phenomenon in the social sphere, was addresses by the Deputy Prime Minister O. Golodets in 2017. However, studies of this phenomenon remain at the periphery of interest. The message of the President of the Russian Federation to the Federal Assembly emphasizes the issue of fighting poverty: “In 2000, more than 40 million people lived below the poverty line. Now, it is about 19 million. But this is too much”.
Research Questions
The subject of the study is the progress of the main indicators of the standard of living, in particular the
The growth of the number and proportion of poor people employed in the economy is examined in the context of ownership patterns in 2011–2018.
Purpose of the Study
The study aims to identify signs, scale and depth of poverty in the Russian Federation. The following tasks are solved, namely: the features of Russian poverty are identified, and the major poverty indicators for the period 2005–2018 are monitored. The residents with cash incomes below the CL in the federal districts of the Russian Federation, as well as the districts themselves, were differentiated based on the level of economic growth.
Research Methods
An array of empirical data is generated in the Statistica SP. The paper provides a multidimensional classification of the constituent entities of the Russian Federation through the clustering method. It presents a multivariate regression model based on a step-by-step regression analysis to identify and quantify the factors determining the distinctions in the poverty rate of the RF population. The study involves the analytical and statistical analysis of the phenomenon referred to as the employed poor in Russia.
Findings
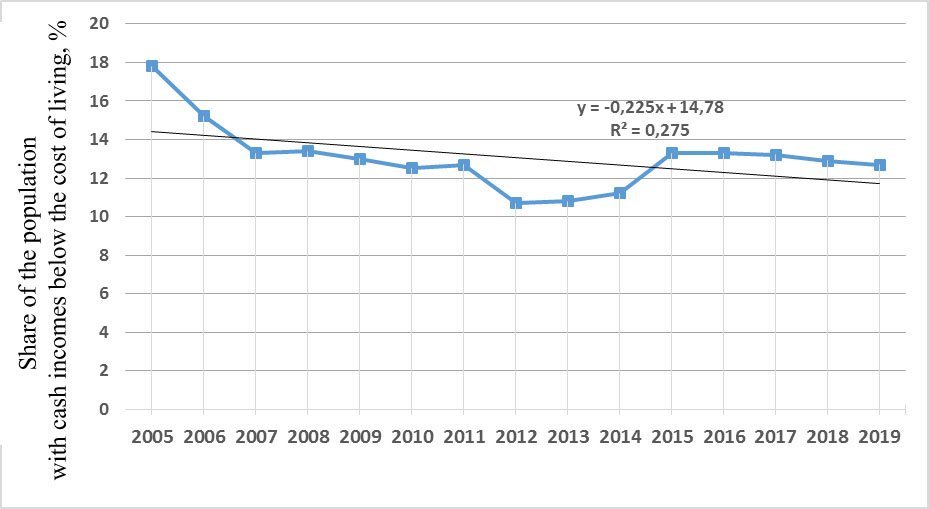
An analysis of the dynamics of the Russian poverty rate highlighted a tendency to decrease from 17.8 % in 2005 to 12.76 % in 2019 (Figure
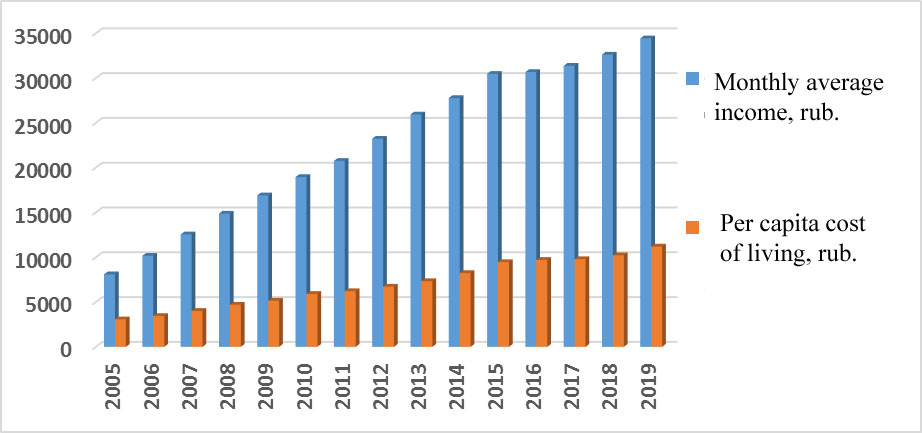
One of the poverty indicators is the average income–cost of living ratio, which is also a characteristic of the quality of life. Cost of living is a state standard that is made up of a consumer basket and the amount of mandatory payments and fees. The consumer basket includes a minimum set of goods and services necessary to maintain human life. The progress of average income of the population and the value of CL as a whole for the Russian Federation are presented in Figure
The constituent entities of the Russian Federation were classified through the Statistica SP to characterize a socio-economic differentiation based on the poverty rate in the regions with different levels of economic development in 2018. The first cluster with the lowest poverty rate of 13.58 % consists of 5 entities, namely: Chukotka Autonomous Okrug, Moscow, Magadan Oblast, Nenets Autonomous Okrug, and Yamalo-Nenets Autonomous Okrug, with the highest population (X1), average annual employment (X5), per capita income (X7), average monthly nominal salary (X9), the lowest number of deaths (X3) and unemployment rate (X6). The second cluster with a poverty rate above the average (14.15 %) includes 8 constituent entities of the Russian Federation, namely: Kamchatka Krai, Khanty-Mansi Autonomous Okrug – Ugra, Moscow Oblast, Murmansk Oblast, the Republic of Sakha (Yakutia), Sakhalin Oblast, St. Petersburg, and Tyumen Oblast, with the highest average monthly social support (X14). The third cluster with the highest poverty rate (15.93 %) embraces 34 subjects of the Russian Federation, namely: Amur Oblast, Arkhangelsk Oblast, Belgorod Oblast, Chelyabinsk Oblast, Irkutsk Oblast, Kaliningrad Oblast, Jewish Autonomous Oblast, Kaluga Oblast, Khabarovsk Krai, Krasnodar Krai, Krasnoyarsk Krai, Leningrad Oblast, Lipetsk Oblast, Nizhny Novgorod Oblast, Novgorod Oblast, Novosibirsk Oblast, Omsk Oblast, Perm Krai, Primorsky Krai, the Republic of Bashkortostan, the Republic of Buryatia, the Republic of Karelia, the Republic of Khakassia, the Republic of Komi, the Republic of Tatarstan, Rostov Oblast, Samara Oblast, Sverdlovsk Oblast, Tomsk Oblast, Tula Oblast, Vologda Oblast, Voronezh Oblast, Yaroslavl Oblast, and Zabaykalsky Krai, with the highest deaths per 1,000 people (X3), total living space (X13) and recorded crimes per 100,000 people (X15). The fourth cluster with a high poverty rate (15.85 %) includes 38 regions of the Russian Federation, namely: Altai Krai, the Altai Republic, Astrakhan Oblast, Bryansk Oblast, the Chechen Republic, Chuvashia, Ivanovo Oblast, the Kabardino-Balkar Republic, the Karachay-Cherkess Republic, Kemerovo Oblast, Kirov Oblast, Kostroma Oblast, Kurgan Oblast, Kursk Oblast, Orenburg Oblast, Oryol Oblast, Penza Oblast, Pskov Oblast, the Republic of Adygea, the Republic of Dagestan, the Republic of Crimea, the Republic of Ingushetia, the Republic of Kalmykia, the Republic of Mari El, the Republic of Mordovia, the Republic of North Ossetia-Alania, the Republic of Tuva, Ryazan Oblast, Saratov Oblast, Sevastopol Oblast, Smolensk Oblast, Stavropol Krai, Tambov Oblast, Tver Oblast, Vladimir Oblast, Volgograd Oblast, Udmurtia, Ulyanovsk Oblast, with the lowest population (X1), number of births (X2), average pensions (X10), average monthly social support (X14), the highest unemployment rates (X6), real incomes (X8 ), real pensions (X11) and the proportion of the population with cash incomes below the cost of living (X12).
To define and quantify the factors that determine the poverty distinctions in the regions of the Russian Federation, a multivariate regression model was designed using a step-by-step regression analysis:
Testing the hypothesis for the significance of the regression coefficients at a level of 0.05 proves that all the feature factors in the model, including the intercept, are statistically significant (the Student’s
The regression equation shows that with an increase in unemployment (X6) by 1 %, the population with cash incomes below the CL will increase by 0.1846 %. With an increase in per capita income (X7) by 1 ruble, the population with cash income below the CL will decrease by 0.2177 %. With an increase in the number of recorded crimes per 100,000 people (X15) by 1 unit, the number of people with cash incomes below the CL will increase by 0.3075 %.
The results of sample surveys at organizations conducted by Rosstat provide an idea of the poverty incidence among workforce and its dynamics in 2005–2017 (Figure
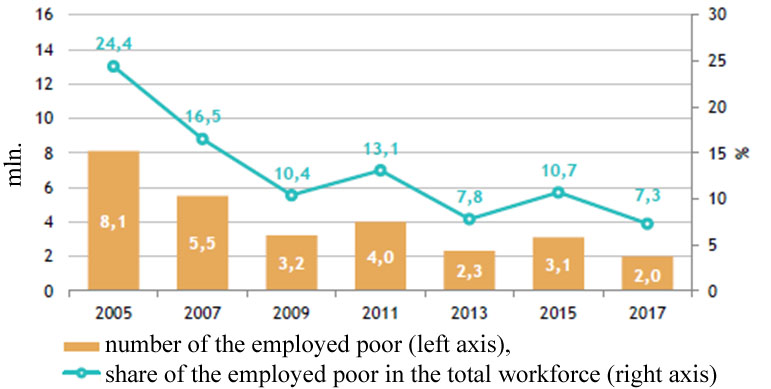
According to the Federal State Statistics Service, by 2017 the poverty rate among the employees in Russia significantly, more than three times, decreased compared to the same indicator in 2005, while the number of the employed poor decreased by four times over the target period. Both poverty indicators reached their minimum in 2017, however, the observed reduction was not even, including under the influence of the macroeconomic situation and due to a change in the CL and accounting technique.
The figures show that taking into account cash income, the number and proportion of poor people employed in the economy decreased in 2016 compared to 2005, but the indicators showed moderate volatility. The poverty incidence among the employed in Russia, estimated based on wages and cash incomes as such, exceeds the similar official figures calculated on the basis of wages and cost of living. However, over 10 million employees have incomes not enough to provide normal, decent living conditions not only for themselves but for their family as well. According to Rosstat, the living wage in 2005–2019 was substantially lower than the CL, although there was a dynamic gap between these indicators throughout the Russian Federation tended to decrease (Figure
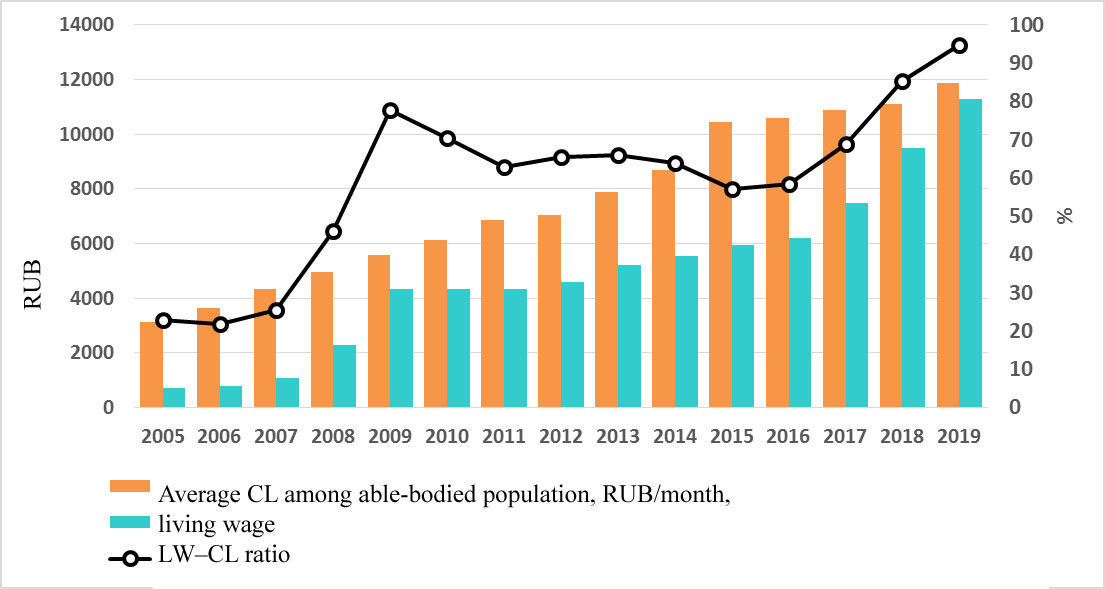
Hence, in the target period, the provision of article 133 of the Labor Code was not respected in Russia. As per the provision, the living wage shall not be lower than the CL of the able-bodied population. Likewise, the provision of article 421 of the Labor Code was not respected. It states that the procedure and terms for a phased increase in the living wage to the size stipulated in Article 133 shall be “established by federal law”. A federal law of that nature was not adopted in the target period. This phenomenon can be deemed as one of the main reasons for the issue of the employed poor to emerge and stay in the Russian Federation.
The rise in the living wage could not solve this problem. It exceeded the CL rate only in certain years of the target period. Starting from 2010, the living wage began to significantly correlate with the rise in the average monthly wages. The calculations indicate a significant differentiation of the poverty rates among the people employed by organizations of various ownerships (Figure
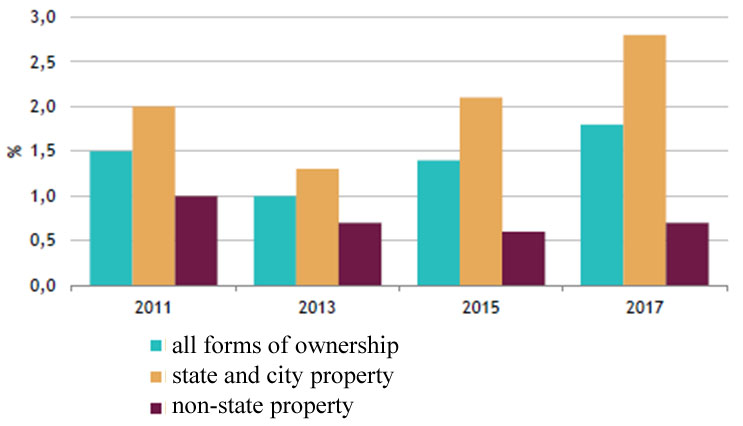
Thus, if in 2011 the proportion of the employed poor in state and municipal property organizations was two times higher than that in non-state property organizations, then in 2017 this gap increased already to four times. This situation may be due to the hectic state of the federal, regional and local budgets that are the sources of financing for state and municipal organizations, which brings about a necessity to reduce maintenance costs, including through savings made in wages of the employees.
The data indicate that in 2011–2017, there was a gap between the amount of wages among the employed poor and the average wages of employees both in the economy as a whole and in organizations of various ownerships in Russia. In non-governmental organizations the gap was on average 1.5 times higher than the state and municipal indicator, which also confirms that the wage policy in the private sector is greatly sustainable.
Conclusion
The transformation of the Russian economy led to some negative changes in the social structure of Russian society. A significant social group of the able-bodied population appeared, which based on its parameters can fall within the employed poor. This group does not have sustainable socio-economic characteristics and therefore needs constant scientific monitoring. It is necessary to study the lifestyle, a set of values and behavioral strategies of the employed poor so that the state social policy aimed at reducing poverty becomes more effective.
In the future, the share of the employed poor will decrease mainly due to the non-state sector of the economy. This is a consequence of overregulated conditions for specifying the wages of people employed by state and municipal institutions. In this case, further aggravation of personnel problems in sectors financed from budgetary funds is likely to happen.
References
- Abrahamson, P. (2001). Social Exclusion and Poverty. Social Sciences and Modernity, 2, 159–167.
- Acemoglu, D., & Robinson, J.A. (2012). Why Nations Fail: The Origins of Power, Prosperity, and Poverty. Crown Business.
- Cowen, T. (2013). Average is Over: Powering America Beyond the Age of the Great Stagnation. Dutton Adult.
- Easterly, W. (2001). The Elusive Quest for Growth: Economists’ Adventures and Misadventures in the Tropics. MIT Press.
- Rzhanitsyna, L. S. (2018). Poor in Moscow: methods of measurement, social policy measures. Sociolog. Res., 10, 77–89.
- Saveleva, T. S., & Orlik, L. K. (2018). Poverty in modern Russian society: statistical analysis, predictive models. In Modern Res. in the Field of Social and Human Sci. The Collection of Results of Scientific Research (pp. 454–459). MCITO.
- Slobodenyuk, E. D., & Anikin, V. A. (2018). Locating the “poverty threshold” in Russia. Vopr. Ekon., 1, 104–127.
- Telin, K. O. (2019). Divergence in mind: Why inequality devil is as black as he is painted. Vopr. Ekon., 4, 107–123.
- Warsaw, E. J., & Denisenko, M. B. (2015). Economically inactive population of Russia: number, dynamics, characteristics. Econ. Social., 42–51.
- Zingales, L. A. (2012). Capitalism for the People: Recapturing the Lost Genius of American Prosperity. Basic Books.
Copyright information

This work is licensed under a Creative Commons Attribution-NonCommercial-NoDerivatives 4.0 International License.
About this article
Publication Date
31 October 2020
Article Doi
eBook ISBN
978-1-80296-091-4
Publisher
European Publisher
Volume
92
Print ISBN (optional)
-
Edition Number
1st Edition
Pages
1-3929
Subjects
Sociolinguistics, linguistics, semantics, discourse analysis, translation, interpretation
Cite this article as:
Orlik, L. K., Zhukova, G. S., & Karmishin, A. M. (2020). Henomenon Of Russian Poverty. In D. K. Bataev (Ed.), Social and Cultural Transformations in the Context of Modern Globalism» Dedicated to the 80th Anniversary of Turkayev Hassan Vakhitovich, vol 92. European Proceedings of Social and Behavioural Sciences (pp. 820-827). European Publisher. https://doi.org/10.15405/epsbs.2020.10.05.110