
Representing Urban Space: Constructing Virtual Landscapes And Developing Competences

Abstract
Research realised on forming and developing university students’ competences to explore, present and represent the urban space, in connection to ICT, has become richer and diverse in Romania. While realising their projects, students attending the Geomatics Master’s Programme at the Faculty of Geography, Babeș-Bolyai University, Cluj-Napoca, Romania, use geoinformational software, cope with a series of difficulties, and engage with problem-solving situations. The aim of this research is to analyse the process of realising a 3D model of the urban space, the difficulties and challenges students face, their strategies, methods and procedures in analysing space and its modelling, and the features and advantages of a 3D representation of urban space. We collected research data through the interview method and through visual methods, and, overall, this research was a case study. Research results point out at students’ undergoing a rich learning process, structured in finished stages and visible intermediary results, effected in many forms of representing the urban space, the final one being the 3D Model of Calvaria-Mănăștur Area in Cluj-Napoca. Our analysis underlines students’ optimal motivation level, self-supervision and self-regulation of their learning process, by using a wide range of solving-problems strategies and perseverance in solving the task. During the research of this educational process, we identified features characteristic of several educational paradigms: behaviourist, cognitive, social-cognitive, and constructivist.
Keywords: Learning challenges3D modelGISgeomaticsgeography university education
Introduction
Research realised on forming and developing university students’ competences to explore, present and represent the urban space (Ursu, Dulamă, & Chiș, 2019), as well as the rural one, in connection to ICT, has become richer and diverse in Romania. It includes studies on using Facebook to learn about cultural landscapes (Dulamă, Ilovan, & Buș, 2016), on landscape analysis in university education (Ilovan et al., 2019a), on e-learning at geography (Dulamă, Ilovan, Ciascai, & Maroşi, 2015), on using the Internet as a resource for learning geography (Dulamă, Magdaș, & Osaci-Costache, 2015), on visual imagery from web sources for researching the urban landscape (Ilovan, 2019), on visual imagery from web sources and Regional Geography (Magdaș, Ilovan, Dulamă, & Ursu, 2018), on exploring the territorial identity of urban centres (Ilovan et al., 2018), on e-learning, digital mapping and urban landscapes (Ilovan et al., 2019c), and on online apps, web sources and electronic devices for studying the production of landscape in relation to Physical and Human Geography topics (Rus et al., 2019). All these topics have been approached in the context of an increasing number of generation Z students in Romania, which is enabling better learning of Geography using ICT (Dulamă, Ursu, Ilovan, & Voicu, 2019), and in the context of urban regeneration practices (Ilovan et al., 2019b), which trigger attention to this area.
As a rule, lately, research supported by online sources was paid much attention in Romanian geography university education (Ilovan, Dulamă, Ciascai, & Maroşi, 2015), taking into account a multitude of media, but favouring Facebook (with a special focus on territorial planning students’ competences) (Dulamă, Vana, & Ilovan, 2016), and online research methods and territorial planning students’ skills (Ilovan, Dulamă, Boţan, Magdaş, & Vana, 2016).
Considering this educational context, in this research, we took into account the modelling and representing of the urban space in geography university education, as realised during a “Geomatics” Master’s Programme, where students used GIS in spatial analysis and in 3D modelling of the urban landscape. In addition, our study relies on the results of two recent papers on research methodology in the Sciences of Education (Magdaș, 2018) and on the effectiveness of digital products in learning, in forming and developing competences (Magdaș, Vereș, & Dulamă, 2019).
Due to the growing trend to create and work with 3D models, a variety of their uses has been uncovered so far, underlining a multitude of applications: landscape management and planning based on 3D modelling and virtual representations of landscape (Dinkov & Vatseva, 2016), especially in the case of the urban landscape (Prechtel, 2015; Xie, Zhu, Du, Xu, & Zhang, 2013); development and management of tourism, both urban and rural (“spatial analysis, modelling and planning of tourist infrastructure and tourist routes” – Dinkov, 2016, p. 658), based on 3D modelling and mapping applications (Dinkov, 2016); urban and terrain 3D models are used for modelling their solar irradiation (Vartholomaios, 2019); 3D modelling of property boundaries and identifying their typology (Barzegar, Rajabifard, Kalantari, & Atazadeh, 2019); geological applications based on 3D subsurface models (MacCormack, Brodeur, & Eyles, 2013). Researchers also argue that 3D modelling should be employed to streamline better and low cost intervention in areas damaged by natural disasters (Eckert et al., 2020). Moreover, geomatic surveys and data processing in 3D models help to plan interventions, conservation and valorisation (touristic included) of heritage: to restore historic buildings (Pena-Villasenin, Gil-Docampo, & Ortiz-Sanz, 2020) and architectural complexes (Monego, Menin, Fabris, & Achilli, 2019). To sum up, geomatic approaches have proved to be relevant for research and education (Perez-Gomez & Aragon-Velasco, 2016) and for making efficient policies and finding solutions to problems in a variety of fields, due to the multitude of the delivered products (animations, thematic maps, virtual globes, 3D models, etc.) (Perez-Gomez & Aragon-Velasco, 2016).
The construction of 3D city models suitable for diverse uses brings up certain challenges, such as the availability of necessary data (i.e. elevation data) (Biljecki, Ledoux, & Stoter, 2017). However, 3D representations are created with the aim to render maximum clarity of objects in reality; they should be characterised by geometrical completeness, accuracy, correctness, reliability, usefulness, performance quality, and effectiveness.
The “Geomatics” Master’s Programme is an adequate feedback of geographical education within Babeș-Bolyai University, in Cluj-Napoca, Romania, especially to the fast development of ICT, of computing techniques, investigation and integrated analysis of space by means of geoinformational software. During this educational programme, students build the basis, at the theoretical and practical level, of the necessary digital competences in using proprietary commercial software and open-source geoinformational software, in the procurement and using of digital databases, and in implementing spatial analysis models. Students learn to use GIS in spatial analysis, in modelling natural, demographic, social and economic processes and phenomena, in diverse activity fields (local administration, urbanistic land registration, urbanism, and management). They learn to use WEB GIS and ArcGIS to process remote sensing images, to manage spatial databases, as well as diverse strategies for territorial arrangement. The new information technologies are being implemented within several courses (Cartography, Topography, Photogrammetry, and Remote Sensing).
Problem Statement
During the “Geomatics” Master’s Programme, students realise a wide range of projects and thus have the opportunity to engage with geoinformational software, to collect data directly, to use data from the geographical databases (demographic, economic, social, etc.), and to represent geographical space through a variety of ways and forms. These projects are optimal activities for forming and developing students’ digital competences, for space arrangement, project management, etc. While realising their projects, students are stimulated and motivated to learn, sometimes they have certain difficulties and face problem-solving situations. We pondered on how students solved those problems so that their projects met the requests/standards their professors had asked for.
Research Questions
In order to solve the problem that triggered our research, we need to answer a series of questions: Which is the learning process that students undergo during the 3D modelling of the urban area? Which are the challenges, difficulties, setbacks that students cope with when analysing and representing in diverse forms the urban area? Which are the strategies, methods and procedures that students use during 3D modelling? Which are the features and advantages of a 3D model for representing urban space?
Purpose of the Study
The aim of this study is to analyse the project that one student realised and the means of realising it. The analysis embraces an educational perspective that focuses on the process of forming and developing competences, on the strategies to solve problem-situations, on self-monitoring and self-regulation of the learning process. For achieving this aim, we analysed the project titled “3D Modelling of Calvaria-Mănăștur area in Cluj-Napoca City” and we interviewed the student who realised it and who is the second author of this paper.
Research Methods
Data collecting and processing
The data about the way of realising the project were collected through the interview method and through participatory observation. During the interview, the student presented the 3D model realised in her project, offered a detailed description of the working manner and, based on the respective information, we continued the series of question within the interview (i.e. semi-structured interview). We applied contents analysis of the data collected as a result of this interview. We analysed the 3D model using visual methodology. Overall, this ascertaining research has the characteristics of a case study.
Participants
In this research, the second author of the paper got involved on a voluntary basis, as a student attending the “Geomatics” Master’s educational programme, who realised the project, analysed her own activity and product, and answered to the interview questions. The other authors of this study, as professors and researchers, were involved in planning and organising the research, in processing, analysing, and interpreting results.
The research material
It consists of the project realised by the student, of the professors’ questions, of the information, answers and opinions provided by the interviewed student.
Findings
Task analysis
The students attending this Master’s programme received the task to realise a 3D model of a certain urban area in Cluj-Napoca, a square with the side of 500 m and with the surface of 250.000 m2/0.25 km2/25 ha. During this 3D modelling, the professor recommended the following: to observe the heights; to make sure that the building heights correspond to the ones in reality; to specify the location of buildings (address: street, number); the streets and crossroads to be represented correctly; for individual dwellings, the roofs should be modelled at least as a gable roof; the elements at the margins of the model should overlap the ones in the neighbouring square; to realise a “flight” using the software. The project was to be realised during one semester and to be presented at the end of it, in front of the professor and colleagues. During assessment, the student had to answer questions. The task to realise individually a 3D model offered the premises and optimum context for forming each students’ competences.
Analysis of the process to realise the project
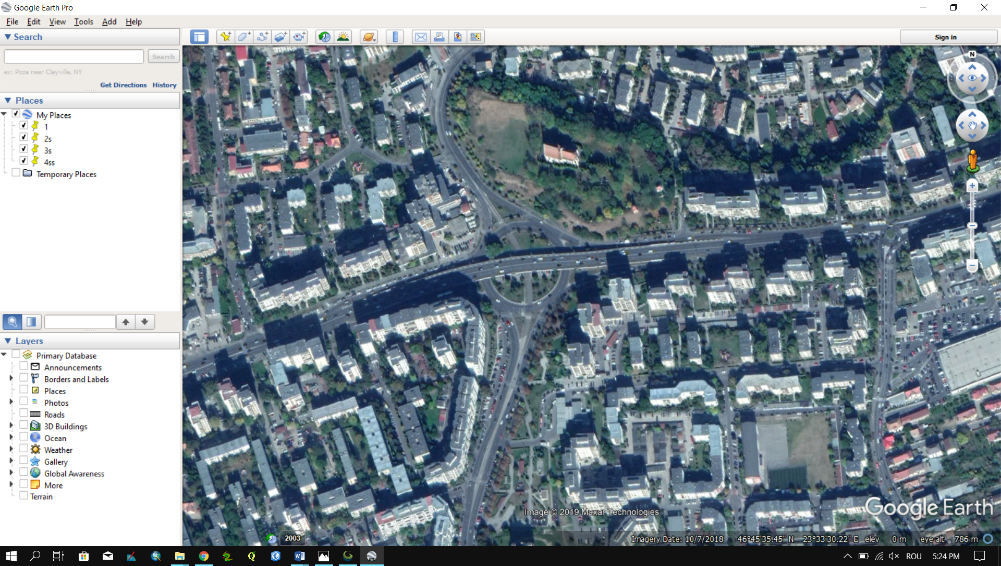
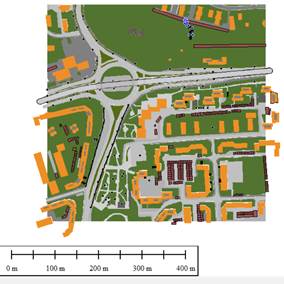
During lectures and seminars students received the needed theoretical and methodological information, as well as examples – all these to enable them solve the task. In both activities, they had opportunities to ask questions addressed to their professors and got answers. For realising the model of the area, the students undergone the following stages: (1) Analysis of the terrestrial surface representation on the orthophotoplan (Fig. 1); (2) Direct observation (in the field) of the surface meant to be modelled (3) Realising the terrestrial surface representation through vectorisation, on the basis of the orthophotoplan (Fig. 2); (4) Elevation of buildings (Fig. 2); (5) Elevation of streets, alleys and sidewalks (Fig. 2); (6) Placement of the imported objects (Fig. 2).
Concerning the difficulty degree of the task, the easiest ones were the first two stages, while the needed time to solve them was about six hours. Direct observation of the area to be modelled was realised through field trips. These observations were necessary to identify the spatial differences between the orthophotoplan and the real urban surface (for instance, new buildings and houses, arrangement of car parks and playgrounds for children). The elevation of buildings was the main objective of this project and had a higher difficulty degree. Students used Street View in Google Earth in order to estimate the height of the buildings, to visualise their form and placement. They downloaded the database for vectorisation in the implicit format of the software, namely .jpg. In order to establish the height of the buildings, they employed two procedures: they either numbered the floors and computed it according to these or they used the facility offered by the respective software, which gave the height by clicking two landmarks (the basis and the top of the building). For the students who had in their areas to be modelled individual dwellings, it was difficult to render the forms of roofs, therefore, at the beginning of the project, it was decided to render them all as gable roofs. To prove the correct overlapping with the neighbouring square (area), several buildings neighbouring the modelled square (area) were represented (Fig. 2). The duration of vectorising all elements in the respective squares (buildings, streets, sidewalks, and green areas) was about six-eight hours.
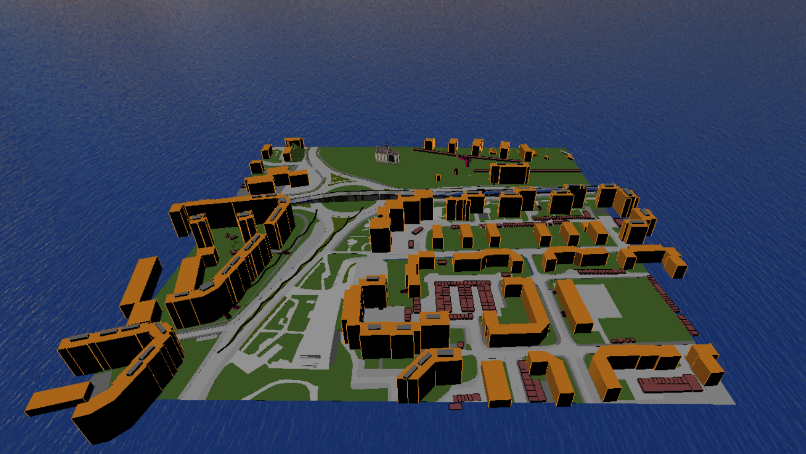
Elevation of streets, alleys and sidewalks had a lower degree of difficulty than the elevation of buildings. Students took into account their width, length and height in relation to the terrestrial surface. Representing a crossroads where there was a bridge had the maximum degree of difficulty because it contained many components (the superstructure with the driveway, the infrastructure, the area of the bridge, the area of connecting the bridge to the embankment) and, most of all, the student intended to realise a model with a high degree of similitude. After modelling the buildings, the students took into account the elevation of the ground. They downloaded an elevation model – SRTM (Shuttle Radar Topography Mission) – which was part of the software and imported it into their “stage”, and thus the ensemble that they represented in the respective area/square folded on the elevation model. To realise a 3D model (Fig. 3) for all the vectorised elements, the interviewed student spent about 15 hours, during seminars and at home.
The most difficult and most time-consuming stage consisted of placing objects. This situation was triggered by several causes: high number of objects, form diversity, and increase of the information quantity. The necessary objects (churches, blocks of flats, garages, a gas station, benches, apparatuses for the children’s playgrounds, trees, etc.) were downloaded from the 3D Warehouse that included layouts realised by diverse authors and that allowed for their free or paid import. The objects were imported in the programme used for modelling and were placed where needed. Many objects required that some details were executed (for instance, drawing the curved route of the wires between electrical energy poles; giving the orientation of the street lighting poles). Representing the exterior staircases had a high difficulty degree and was very time consuming, especially for the ones where the stairs were not uniform and the route of the staircase had no straight ramp.
Product analysis
The project result is a 3D dynamic model that allows for multiple interaction types between author/viewer and model: visualising certain detail aspects using the Zoom in or of the ensemble through the Zoom out; model rotation; movement in diverse directions in the modelled area; changing luminosity according to time and the degree of cloud coverage of the sky (sunset, cloudy, full moon). To ensure a pleasant visual impact and to create strong contrast within the landscape, the author used selected shades of green for green spaces, including for single trees, shades of grey for transport routes (roads, alleys, and sidewalks), and a warm colour (orange) for buildings.
Between the products realised by students, there were differences concerning the used colours, the number of imported objects for representing the area, and concerning the accuracy and precision in representing details. In the 3D model of Calvaria-Mănăștur area, the imported objects were used in a creative manner for urban design, when placing the urban furniture elements, when representing the playgrounds as these places could not be modelled exactly like in reality (for instance, modelling the playground slide). Using in the project very many imported objects had a pleasant visual impact but determined the increase of information quantity up to 1.49 GB and even blockages of the software.
For the self-assessment of the realised 3D model, the professors and researchers involved in writing this paper proposed a 5-criteria assessment grid (Table
During the project presentation, the professor addressed questions for checking student’s procedure: How did you realise the scales? How did you realise the curved lines for electrical energy transport? What attributes did you gave the scales? How did you import the urban design elements? In order to check the correspondence with the real space, students were asked if they introduced the address of each building in the Attribute Table.
Analysis of the methods used to analyse and the forms to represent urban space
When studying the urban space, the student used two methods – observation and modelling –, both of them being both research methods and didactic ones enabling the student’s learning as well as forming and developing her competences. Students observed space directly, by walking in the research area and, indirectly, by using photographs and the film available in Google Earth. Concerning the modelling, students realised two models of the targeted urban space: a plan model and a 3D one. The latter, in comparison to the first, had the following features: more represented components and details; a higher similitude to or precision in representation with the real space; it was real; it was dynamic; it enabled a series of interactions with the user (movement, zooming in and out, rotation, light variation, and flight).
Analysis of the student’s motivation and satisfaction
This project needed student’s use of large time resources and considerable focus on the task in order to complete it successfully. The student invested all the necessary physical, psychic and intellectual resources for realising the project because the task was challenging, it stimulated her curiosity and interest for learning a new geoinformational software, by using it. The process of realising the project, of learning, of forming and developing her competences was a difficult one, but the satisfaction of success during the entire activity ensured student’s granting the necessary energy to solve tasks. Students realised that the software was very useful in realising projects. If in this case, they represented a real urban space, in other contexts, they might model virtual spaces.
Conclusion
We underline several aspects of the researched educational process. Firstly, we would like to point out at the student’s capacity to analyse, during the interview, her own activity and to assess, with a high objectivity degree, her product – the 3D Model of Calvaria-Mănăștur area –, her capacity to describe, with many relevant details for research, the strategies, methods and procedures used in solving the task and the problem-situations, a fact that highlights the existence of knowledge and well developed metacognitive strategies, which favour solving tasks successfully, achieving new knowledge, forming and developing competences characteristic to the respective Master’s programme.
Secondly, student’s optimal motivation level, self-monitoring and self-regulation of the learning process, through the use of a large range of solving problems strategies, perseverance in solving the task contributed, as well, to obtaining success. Thirdly, an important role in the process of forming and developing the targeted competences during the modelling process is attributed to professors’ information, explanations, demonstrations, appropriate feedforward and constructive feedback, ensuring an optimal learning climate. Fourthly, concerning the realised 3D model, we consider relevant the fact that this model is the result of student’s undergoing an ample learning process, structured in several finished stages having visible intermediary results, each of these being another form of representing the urban space.
Finally, we conclude that in the investigated educational process there were visible aspects characteristic to several educational paradigms: behaviourist (using the exercise and being aware of effects), cognitive (processing information), social-cognitive (observational learning), and constructivist (producing and using knowledge.
References
- Barzegar, M., Rajabifard, A., Kalantari, M., & Atazadeh, B. (2019). 3D BIM-enabled spatial query for retrieving property boundaries: a case study in Victoria, Australia. International Journal of Geographical Information Science, 34(2), 251-271.
- Biljecki, F., Ledoux, H., & Stoter, J. (2017). Generating 3D city models without elevation data. Computers Environment and Urban Systems, 64, 1-18.
- Dinkov, D. (2016). Generation of 3D panoramic map for tourism management applications. 6th International Conference on Cartography and GIS, 1 and 2, Book Series: International Conference on Cartography and GIS, 658-667.
- Dinkov, D., & Vatseva, R. (2016). 3D modelling and visualization for landscape simulation. 6th International Conference on Cartography and GIS, 1 and 2, Book Series: International Conference on Cartography and GIS, 320-333.
- Dulamă, M. E., Ilovan, O.-R., & Buș, R. M. (2016). Cultural Landscapes and Geography University Students’ Learning on Facebook Discussion Groups. Proceedings of the 11th International Conference on Virtual Learning, 50-57.
- Dulamă, M. E., Ilovan, O.-R., Ciascai, L., & Maroşi, Z. (2015). E-learning Geography. How Powerful Is Facebook for Geography University Students? Proceedings of the 10th International Conference on Virtual Learning, 121-127.
- Dulamă, M. E., Magdaș, I., & Osaci-Costache, G. (2015). Study on Geography Students’ Internet Use. Romanian Review of Geographical Education, 4(1), 45-61.
- Dulamă, M. E., Ursu, C.-D., Ilovan, O.-R., & Voicu, C.-G. (2019). Increasing generation Z geography students’ learning through didactic films in university. Proceedings of the 14th International Conference on Virtual Learning, 79-85.
- Dulamă, M. E., Vana, V. M., & Ilovan, O.-R. (2016). Assessing Territorial Planning M.Sc. Students using Facebook. Proceedings of the 11th International Conference on Virtual Learning, 66-74.
- Eckert, G., Cassidy, S., Tian, N., & Shabana, M. E. (2020). Using Aerial Drone Photography to Construct 3D Models of Real-World Objects in an Effort to Decrease Response Time and Repair Costs Following Natural Disasters. Advances in Computer Vision, CVC, 1, Book Series: Advances in Intelligent Systems and Computing, 943, 317-325.
- Ilovan, O.-R. (2019). Studying the urban landscape at university: web-based research and visual imagery. Proceedings of the 14th International Conference on Virtual Learning, 70-78.
- Ilovan, O.-R., Dulamă, M. E., Andron, D., Bălan, P.-M., Muntean, D.-O., Toderaș, A., & Ciocan, M. (2019a). Developing students’ competence to analyse landscapes during geography university studies. European Proceedings of Social and Behavioural Sciences, LXIII, 398-408. https://doi.org/10.15405/epsbs.2019.06.49
- Ilovan, O.-R., Dulamă, M. E., Boțan, C. N., Ciascai, L., Fonogea, S.-F., & Rus, G. M. (2018). Meaningful learning: case studies on the territorial identity of historical urban centres. European Proceedings of Social and Behavioural Sciences, 41, 413-421. https://doi.org/10.15405/epsbs.2018.06.49
- Ilovan, O.-R., Dulamă, M. E., Boţan, C. N., Magdaş, I., & Vana, V. M. (2016). Quality in Geographical Research? Territorial Planning Students’ Online Research Methods. European Proceedings of Social and Behavioural Sciences, 18, 211-216.
- Ilovan, O.-R., Dulamă, M. E., Ciascai, L., & Maroşi, Z. (2015). Geography University Students’ Skills to Research Online Sources. An Empirical Study. Proceedings of the 10th International Conference on Virtual Learning, 201-134.
- Ilovan, O.-R., Havadi-Nagy, K. X., Dulamă, M. E., Mutică, P., Adorean, E.-C., Colcer, A.-M., & Cimpoieș, P.O. (2019b). Learning challenges and benefits during the International Workshop on Urban Regeneration. European Proceedings of Social and Behavioural Sciences, LXIII, 330-338. https://doi.org/10.15405/epsbs.2019.06.41
- Ilovan, O.-R., Maroși, Z., Adorean, E.-C., Ursu, C.-D., Kobulniczky, B., Dulamă, M. E., & Colcer, A.-M., (2019c). E-Learning urban landscape changes in post-socialist Romania using digital mapping. Proceedings of the 14th International Conference on Virtual Learning, 62-69.
- MacCormack, K. E., Brodeur, J. J., & Eyles, C. H. (2013). Evaluating the impact of data quantity, distribution and algorithm selection on the accuracy of 3D subsurface models using synthetic grid models of varying complexity. Journal of Geographical Systems, 15(1), 71-88.
- Magdaș, I. (2018). Prezentarea și prelucrarea datelor cercetării în științele educației. Ghid pentru studenți [Presenting and processing research data in the Sciences of Education. A students’ guide]. Cluj-Napoca: Presa Universitară Clujeană.
- Magdaș, I. C., Ilovan, O.-R., Dulamă, M. E., & Ursu, C. D. (2018). Visual materials from web sources in studying regional geography topics. Proceedings of the 13th International Conference on Virtual Learning, 278-284.
- Magdaș, I. C., Vereș, S., & Dulamă, M. E. (2019). The role and effectiveness of digital products in instruction at Mathematics and Environmental Exploration. Proceedings of the 14th International Conference on Virtual Learning, 102-109.
- Monego, M., Menin, A., Fabris, M., & Achilli, V. (2019). 3D survey of Sarno Baths (Pompeii) by integrated geomatic methodologies. Journal of Cultural Heritage, 40, 240-246.
- Pena-Villasenin, S., Gil-Docampo, M., & Ortiz-Sanz, J. (2020). Desktop vs cloud computing software for 3D measurement of building facades: The monastery of San Martin Pinario. Measurement, 149, article number: UNSP 106984.
- Perez-Gomez, R., & Aragon-Velasco, A. (2016). Evaluating regional education systems performances in Spain and their influence in the socioeconomic system. A geomatic approach. 6th International Conference on Cartography and GIS, 1 and 2, Book Series: International Conference on Cartography and GIS, 32-42.
- Prechtel, N. (2015). On strategies and automation in upgrading 2D to 3D landscape representations. Cartography and Geographic Information Science, 42(3), 244-258.
- Rus, G.-M., Dulamă, M. E., Ursu, C.-D., Colcer, A.-M., Ilovan, O.-R., Jucu, I. S., & Horvath, C. (2019). Online apps, web sources and electronic devices: learning through discovery about Valea Ierii [Iara Valley]. Proceedings of the 14th International Conference on Virtual Learning, 110-119.
- Ursu, C.-D., Dulamă, M. E., & Chiș, O. (2019). The competences to explore, present and represent the urban space. European Proceedings of Social and Behavioural Sciences, LXIII, 349-357.
- Vartholomaios, A. (2019). A machine learning approach to modelling solar irradiation of urban and terrain 3D models. Computers Environment and Urban Systems, 78, article number: UNSP 101387
- Xie, X., Zhu, Q., Du, Z., Xu, W. P., & Zhang, Y.T. (2013). A semantics-constrained profiling approach to complex 3D city models. Computers Environment and Urban Systems, 41, 309-317.
Copyright information

This work is licensed under a Creative Commons Attribution-NonCommercial-NoDerivatives 4.0 International License.
About this article
Publication Date
17 June 2020
Article Doi
eBook ISBN
978-1-80296-084-6
Publisher
European Publisher
Volume
85
Print ISBN (optional)
-
Edition Number
1st Edition
Pages
1-814
Subjects
Teacher, teacher training, teaching skills, teaching techniques, special education, children with special needs
Cite this article as:
Dulamă, M. E., Ursu, C., Ilovan, O., Răcășan, B. S., Andronache, D., & Rus, G. (2020). Representing Urban Space: Constructing Virtual Landscapes And Developing Competences. In V. Chis (Ed.), Education, Reflection, Development – ERD 2019, vol 85. European Proceedings of Social and Behavioural Sciences (pp. 694-703). European Publisher. https://doi.org/10.15405/epsbs.2020.06.72