
Regional Investments Concentration In The Russian Federation: Statistical Analysis

Abstract
An increase in investment in all sectors of the economy is a prerequisite for economic growth in the Russian Federation. Attracting investment resources is a priority for the development of the country in the face of external economic constraints. The volume of investment in the national economic complex varies greatly in the regional context due to the differences in the subjects of the Russian Federation in terms of economic, social, and infrastructural development. Fixed capital investment is traditionally seen as the basic category, which characterizes the volume of investment. The paper assesses the regional concentration of fixed capital investment in the Russian Federation for 2010-2017. The research is conducted by calculating the Herfindahl-Hirschman index. Official state statistics has provided data for statistical evaluation. Over the period under study, the concentration of investments increased. The research revealed that the trend of the concentration index values demonstrated periodic fluctuations. These fluctuations agree with the periods of volatility at the macroeconomic level. Five out of eighty five constituent entities account for almost a third of investments in the country as a whole. Rank correlation method was applied to determine significant correlation between the volume of investments in fixed capital per capita and the average per capita income in the regions of the Russian Federation. It is concluded that there is a high degree of probability that geographic alignment in the distribution of investments in fixed capital by subjects of the Russian Federation can lead to an increase in the well-being of the population.
Keywords: Investmentsconcentrationaverage per capita incomecorrelation
Introduction
It is impossible to reach economic growth without an intensive influx of capital into the economy. Potential investors seek to maximize their possible return on financial investments while minimizing risks. The issue of investment attractiveness of Russia in general and its regions in particular has been given thorough attention in a number of academic studies (Repina & Polyanskova, 2019; Kalinina & Kalinina, 2016; Bulatova, 2018). In (Kvon et al., 2017a; Kvon et al., 2017b) the nonstationary conditions of economic development in Russia, which are associated with the problem of attracting investments due to external adverse economic conditions, are considered. Thus, the study of differences in the investment attractiveness of the regions is of particular relevance taking into account the context of international economic restrictions introduced by a number of states towards the Russian Federation (Karelina, 2016).
It is obvious that a breakthrough in the economic development of the country is not possible without a significant influx of investment, and moreover to all the constituent entities of the Russian Federation and not only to the most industrialized ones. In this regard, a statistical study of the concentration level for regional investment is seen as indisputably timely and important.
Problem Statement
Implementation of the measures to improve the comfort infrastructure for conducting business makes it possible to improve the investment climate in the regions of Russia (Shchepkina, 2019). An increase in investment attractiveness is most likely to lead to the dynamic growth in many sectors of the economy, including small and medium-sized businesses (Safiullin & Gubaidullina, 2018). In (Aleksandrov, Vyakina, & Skvortsova, 2014) the investment attractiveness of the region is understood as the synergy of factors and conditions that attract potential investors and the investment risks existing in the region. A certain uneven distribution of investments in fixed capital across the territory of the Russian Federation is obvious due to differences in the investment attractiveness of its constituent entities.
The uneven distribution of investments in fixed capital across the country is associated with different labor productivity in the regions, infrastructure security, per capita income, retail per capita turnover and other factors. Together, all these factors determine the quality of life of the population on these territories. Improving the quality of life of the population has been declared one of the most important national development goals of the country for the period until 2024 (Decree of the President of the Russian Federation №204 from May 07, 2018). One of the ways to achieve this goal is seen through sustainable growth in real income of citizens.
The quantitative indicator “investments in fixed capital” has been determined by different scholars as one of the indicators of public authorities’ efficiency in the regions. According to (Sukhanova, Shirnaeva, & Mokronosov, 2016), this indicator may reflect the course of stabilization processes taking place in the country's economy, and in the study (Kabanov, Zhilnikov, & Zablotskaya, 2018), the authors propose using fixed capital investments as financial tool to influence economic growth.
Research Questions
Thus, this study seeks to answer the questions that follow. What is the level of fixed capital investments concentration in the regional context in Russia? How has the level of fixed capital investments concentration changed over the past 10 years? Is there a correlation between the amount of investment in fixed capital per capita in the regions of Russia and the level of per capita income of the population in those regions?
Purpose of the Study
The study is aimed to statistically analyze fixed capital investments concentration by region in the Russian Federation for the period 2010-2017. It also seeks to identify the correlation between the level of investment in fixed capital per capita and the average per capita income of the population in the regions.
Research Methods
Among the research methods of the study there are statistical methods of analysis (index method, time series analysis, and correlation analysis), methods of system and logical analysis. The statistical array of the study is based on the data of state statistics published on the official website of the Federal State Statistics Service in the collection (Federal State Statistics Service, 2018). The volume of the statistical data amounted to 84 constituent entities of the Russian Federation for a time period of 8 years (2010-2017). Such constituent entities of the Russian Federation as the Republic of Crimea and the city of Sevastopol are excluded from the analysis due to data incomparability. “Investments in fixed capital per capita” and “per capita income” were chosen as indicators.
A certain statistical tool, namely the calculation of concentration indices, can be used to measure the concentration of investments in the regions of the country. In their study (Pinkovetskaia, Nuretdinova, Neif, & Treskova, 2019), the authors estimate the current level of industry and regional concentration of investments in the regions using the Krugman index. In practice, a number of other concentration indices are applicable, for example, the Herfindahl-Hirschman Index (HHI).
The HHI index was calculated as:
, where
The methods of rank correlation are applied to assess the correlation relationship between the average per capita income of citizens in the regions of the Russian Federation and the value of investments in fixed assets in these territories. These methods are relevant due to the unreliability of the assumption about the normal law of distribution of the features under study. Spearman coefficient of rank correlation between «fixed capital investment per capita» (I) and «average per capita income» (D) within the RF regions is calculated as: , where – ranks of the indices under study, – the number of the RF regions. Excel and Gretl programs were used to process and analyze statistical data.
Findings
In the framework of this study, the range of possible values of the HHI index is determined by the inequality:
, as
. The calculated values of the index for the Russian Federation for the period 2010-2017, as well as their dynamic changes, are presented in Figure
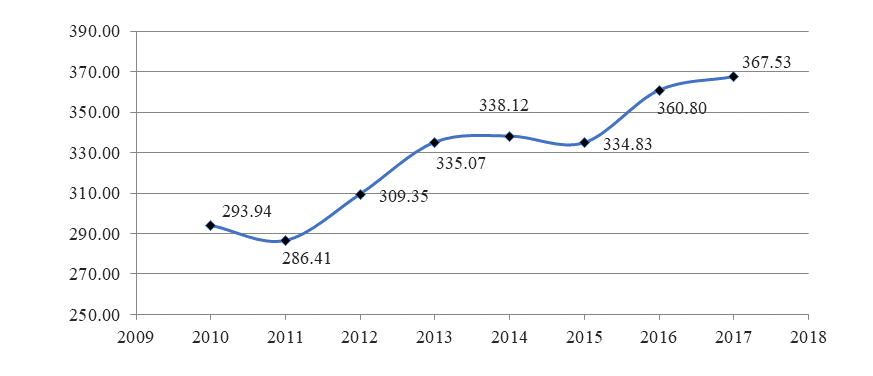
The HHI time series analysis suggests that the concentration of fixed capital investments increases with certain fluctuations, which agree with the time intervals of economic instability in the country. The results of the calculation of the analytical indicators of a number of dynamics of the HHI value (chain absolute growth (∆с) and chain growth rate (
The average annual growth rate of the HHI is 3.33% per year, i.e. the concentration of regional investments in the Russian Federation is increasing. Moreover, this process depends on the macroeconomic situation in the country. In times of economic hardship, investment concentration intensifies. Investors go to regions with the most stable investment climate. The average annual absolute increase in HHI was 10.51. It should be noted that in general for the period 2010-2017 the investment concentration index is in the vicinity of the right border of the possible index values range for the Russian Federation.
According to the data of the National Rating Agency (National Rating Agency, 2018), in 2017 the TOP 5 regions with the greatest investment attractiveness were: Moscow, Saint-Petersburg, Moscow Region, Yamalo-Nenets Autonomous Okrug, Sakhalin Region. The Republic of Tuva was an outsider. These rating leaders account for 29.38% of all investments in fixed capital in the Russian Federation (Figure
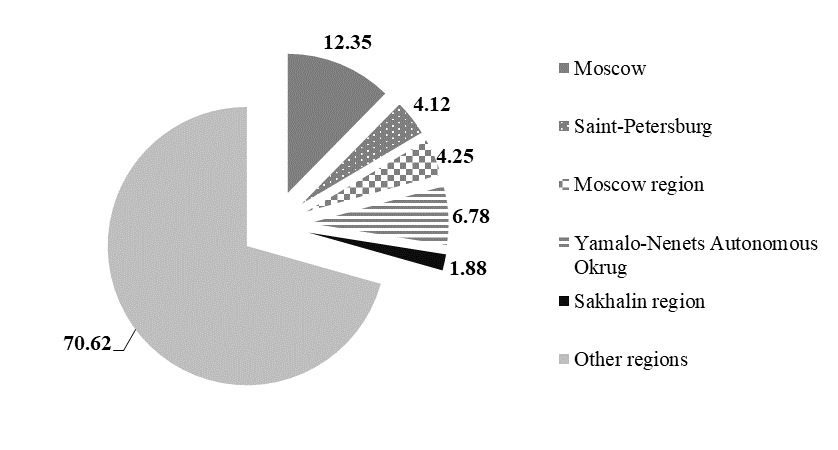
The investment advantages of these regions have historical, resource and natural, geographical, and technical-production prerequisites. In 2018 the TOP 5 investment attractive regions have slightly changed their composition. So, according to the data of the National Rating Agency the TOP 5 was left by Sakhalin Region, giving way to the Republic of Tatarstan (National Rating Agency, 2018).
The analysis of the correlation between the amount of investment in fixed capital per capita in the regions of Russia and the average per capita income of the population for the period 2010-2017 revealed that these indicators have an empirical distribution law different from the normal distribution law. This can be proved by the data shown in Table
Table
Based on the data from Table
Conclusion
Thus, based on the evidence the process of increasing the fixed capital investments concentration has been identified in Russia over the period 2010-2017. The geographical concentration of investments largely determines the distribution vectors of enterprises in the non-financial sector of the economy, which determines the stable economic development of some regions and the lag in the development of others. The most important strategic task on the path to economic growth is to reducing the concentration of investments available for a few “most wealthy” regions. The even distribution of financial investment resources throughout the country can positively affect the growth of the country's population prosperity.
References
- Aleksandrov, G. A., Vyakina, I. V., & Skvortsova, G. G. (2014). Formation of an attractive investment climate in the region: Concept, diagnostics, innovations. Moscow: Economics. [in Rus.].
- Bulatova, Y. I. (2018). Assessment of investment attractiveness of a subject of the Russian Federation: Content, necessity and comparative analysis of assessment methods. Economy: Yesterday, Today, Tomorrow, 8(11А), 199-210. [in Rus.].
- Decree of the President of the Russian Federation №204 from May 07, 2018. Retrieved from http://www.kremlin.ru/acts/bank/43027 Accessed: 11.10.2019. [in Rus.].
- Federal State Statistics Service (2018). Regions of Russia. Socio-economic indicators. Retrieved from: https://www.gks.ru/bgd/regl/b18_14p/Main.htm Accessed: 11.10.2019. [in Rus.].
- Kabanov, V. N., Zhilnikov, A. Y., & Zablotskaya, T. Y. (2018). Financial guarantees of the regional budget are growth potential for the investments in fixed capital. Economy of Region, 14(1), 315-325. DOI:10.17059/2018-1-25
- Kalinina, A. E., & Kalinina, V. V. (2016). Development of an information-analytical system for assessing the investment attractiveness of the regions of the Russian Federation. Volgograd State University Bulletin. Series 3: Economics. Ecology, 2(35), 7-17. [in Rus.].
- Karelina, M. G. (2016). Comprehensive assessment of integration activity of business structures in Russian regions. Economics and Social Changes-Facts Trends Forecast, 5(47), 103-121. DOI:10.15838/esc/2016.5.47.6
- Kvon, G. M., Faleeva, L. V., Pyrkova, G. K., Alyakina, D. P., Mustafina, A. A., Kryukova, N. I., & Blekus, V. V. (2017a). Strategis priorities of regional investment activity. Eurasian Journal of Analytical Chemistry, 12(7B), 1099-1106. DOI:10.12973/ejac.2017.00235a
- Kvon, G. M., Lushchik, I. V., Karpenko, M. A., Zaitseva, N. A., Galushkin, A. A., & Yakupova, N. M. (2017b). Regional investment policy: Analysis and assessment of the investment environment state. Eurasian Journal of Analytical Chemistry, 12(5B), 835-853. DOI:10.12973/ejac.2017.00215a
- National Rating Agency (2018). Investment attractiveness rating of the RF constituent entities. Retrieved from http://www.ra-national.ru/ru/taxonomy/term/3097?type=rating Accessed: 11.10.2019. [in Rus.].
- Pinkovetskaia, I. S., Nuretdinova, Y. V., Neif, N. M., & Treskova, T. V. (2019). Specialization and concentration of investments in fixed assets of enterprises: Information from Russia. Amazonia Investiga, 8(21), 52-61.
- Repina, E. G., & Polyanskova, N. V. (2019). Strategy as instrument of ensuring breakthrough in the regional social development. In V. V. Mantulenko (Ed.), International Scientific and Practical Conference “Global Challenges and Prospects of Modern Economic Development”. The European Proceedings of Social and Behavioural Sciences, 57 (pp. 814-825). London: Future Academy.
- Safiullin, A. R., & Gubaidullina, A. I. (2018). Approach to risk and investment attractiveness estimation for regional economic activity of Russia. International Transaction Journal of Engineering management & Applied Sciences & Technologies, 9(5), 455-467.
- Shchepkina, N. (2019). Influence of investment attractiveness of regions on the volume of direct investments in economy of the Russian Federation. International Journal of Applied Exercise Physiology, 8(3.1), 428-441.
- Sukhanova, E. I., Shirnaeva, S. Y., & Mokronosov, A. G. (2016). Econometric models for forecasting of macroeconomic indices. International Journal of Environmental and Science Education, 11(16), 9191-9205.
Copyright information

This work is licensed under a Creative Commons Attribution-NonCommercial-NoDerivatives 4.0 International License.
About this article
Publication Date
01 April 2020
Article Doi
eBook ISBN
978-1-80296-081-5
Publisher
European Publisher
Volume
82
Print ISBN (optional)
-
Edition Number
1st Edition
Pages
1-1004
Subjects
Business, innovation, management, management techniques, development studies
Cite this article as:
Repina, E. G., Sukhanova, E. I., & Shirnaeva, S. Y. (2020). Regional Investments Concentration In The Russian Federation: Statistical Analysis. In V. V. Mantulenko (Ed.), Problems of Enterprise Development: Theory and Practice, vol 82. European Proceedings of Social and Behavioural Sciences (pp. 177-183). European Publisher. https://doi.org/10.15405/epsbs.2020.04.23