
Infographics In Engineering Education: Methods Of Professional Communicative Context Development

Abstract
The article describes the tool of infographics in relevance to teaching post graduate engineering students a foreign language. Apart from the illustrative function, educational and cognitive potential of using infographics as a learning tool are examined. The didactic potential of this tool for developing a professional communicative competence is analyzed. During our research study aimed at improving professional foreign language communicative competence of engineering master students of polytechnic university it was noticed that there is a small number of visual supports in the authentic materials of the world's leading publications specializing in topics related to engineering field of studies. Thus the stages of creating an infoposter are presented and the benefits of using this tool in class are explained as well. The article also provides information on experiment aimed at enhancing the communicative activity of students through the study of professionally oriented vocabulary and the implementation of exercises related to text analysis using the infographics tool. The results of experiment demonstrate positive dynamics in the aspects of forming professional thesaurus and developing communicative competence. Obtained results allow to make a conclusion that the use of cognitive-visual technology and infoposters can be considered an effective tool in engineering education in high school.
Keywords: Communicative competenceengineering educationinfographicsprofessional development
Introduction
Nowadays a good knowledge of English is at indispensable prerequisite for anyone aiming to achieve some great goals in his/her career and therefore has to keep up with new technologies in the professional sphere and be able to communicate with foreign colleagues.
Nevertheless, while teaching English to engineering master students at the polytechnic university we face up with some major issues, such as: the lack of class hours, overall rather low level of English together with inhomogeneity of the groups in terms of level of foreign language communicative competence that, in its turn, leads to decrease in students’ motivation of studying a foreign language.
Besides the specifics of the educational environment at the polytechnic university, there are also some issues related to the changes of students` perception and processing of information that, according to the recent research, are connected with the new way of thinking – mosaic thinking (Howe & Strauss, 2000; Semenovskikh, 2014; Shamis & Nikonov, 2016; Toffler, 2006). The main characteristics that distinguish it from other types and are relevant for our research are: preference of non-verbal (visual) representation of information, decrease of the attention span and as a result – inability to focus and work with longer pieces of information (O’Neil, Perez, & Baker, 2014).
One of the main objectives of teaching English to technical students at the polytechnic university is to create educational environment that will help to satisfy students` needs and will enable them to improve professional foreign language communicative competence for continuing professional development and networking.
As can be seen from the above, modern educational tools need to be found and implemented in the educational process to accomplish these goals. One of the adequate ways of adapting to the needs and requirements of the current generation of students could be visualization of educational material with the help of infographics (Chernyak, 2013; Glukhov & Vasetskaya, 2017; Kondratenko, 2013).
Problem Statement
Historically, infographics used to be a rather popular tool of visualization in the field of journalism where it was employed to make long pieces of text more comprehensible and thus attract more readers (Chernyak, 2013). In our research we focused on the cognitive and educational functions of visualization that could be executed with the help of infographics.
Visualization is based on the cognitive-visual technology that is a system of actions, logically aligned and sequential, aimed at visual transformation of educational material, the purpose of which is to increase the effectiveness of work with educational information by activating cognitive processes (Lupyan, 2015). With the introduction of cognitive-visual technology, one of our objectives is to create learning conditions that pay great attention to using the reserves of visual thinking of students. Thus, within the framework of this technology, the visualization can become one of the leading methodological training aids and infographics will be the main tool to implement it.
During our research study aimed at improving professional foreign language communicative competence of engineering master students of polytechnic university it was noticed that there is a small number of visual supports in the authentic materials of the world's leading publications specializing in topics related to engineering field of studies. Most often graphs or tables with statistical data are provided in the article materials; however, visualizations that directly reflect key points are extremely rare. Being adequately composed these non-verbal components could be of a great help in working with complex authentic scientific texts (Almazova, Barinova, & Ipatov, 2018; Pavlova, 2015). By replacing and refining lengthy texts, the graphical representation of educational information can simplify the meaning of the material presented while preserving the information integrity, denoting and integrating ideas, facts, connections and conclusions. Together, the illustration and the explanatory inscription can act as an independent element, which makes it possible to not only reduce the text, but also to structure it better. The use of graphics promotes a more successful perception and memorization of educational material, since in this case both hemispheres of the brain are involved: the left one, which is responsible for logical thinking, and the right one responsible for emotional perception (Lupyan, 2015). Considering all the above mentioned points, it seems reasonable to add the necessary visualization to selected authentic articles with the help of infographics.
The use of infographics could assist not only in presenting information in non-verbal form, but also in developing abstract and critical thinking. Furthermore, visual representation could lessen the difference in foreign language linguistic competence of students while carrying out oral communicative tasks and thus increase their motivation and as a result overall efficiency of educational process.
Research Questions
With the purpose of examining the effectiveness of using infographics for teaching English to engineering students there was conducted a pedagogical experiment at the Institute of Energy and Transport Systems of Peter the Great St.Petersburg Polytechnic University (SPbPU). Four groups of engineering master students (12 students each) were participating in the experiment during one academic year.
The experiment included ascertaining, training and control stages and passed within the framework of teaching the discipline "English for Specific Purposes". Based on the curriculum and syllabus of the discipline, our main focus was on the formation of students` professional thesaurus and improvement of their skills in professional intercultural communication.
To broaden professional thesaurus authentic texts dedicated to nuclear engineering, heat power energy, alternative energy, energy conservation etc. were used. As it was mentioned earlier, because of lack of class hours and students inability to work with long pieces of text, there were created infoposters for each article to illustrate the key points, highlight important details and provide students with a short well-structured “text” with no excessive information. Such approach was supposed to assist with processing big volume of information, quickly grabbing the main idea, and to spur further discussion while performing communicative tasks based on the information extracted from the article. Furthermore, this way of presenting the information enabled us to save time, as students did not have to read carefully the whole text (which usually takes a lot of time because of a big amount of new terms and more complicated syntax of the written text) (Rubtsova, 2018). At a later stage, “extra time” was used to perform some productive language activities like brainstorming in mini-groups, dialogues, case studies and round-table discussions. Overall, the scheme of working with infographics looks as follows (Figure
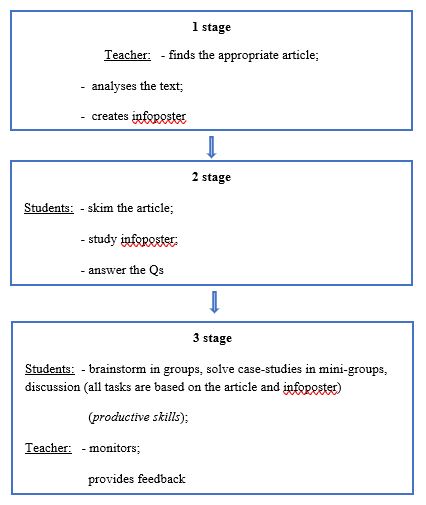
In the process of creating infoposters, two stages can be identified: the preparatory stage and the stage of implementation.
The first stage includes the choice of strategy for composing the infoposter, i.e. determination of what exactly and why we would like to be displayed there, the selection of illustrative material and, finally the development of style and design. The second stage consists of the process of creation the infoposter and its implementation in the educational process.
As can be seen from Figure
Potential difficulties that may arise during each of these stages are as follows.
1 stage: while searching for the article that will later be presented in the form of infoposter, it is vital to find a text that already has rather good and comprehensive structure and does not contain too much excessive details, diagrams, calculations etc. Otherwise, it will be complicated for students to skim it quickly and it will require extra time to process the text.
2 stage: while working with infoposters students may focus more on infographics, ignoring information from the article. On the contrary, our aim is to make students read and analyze the article more profoundly with the help of infoposter. Infographics is supposed to be some sort of foundation or “skeleton” of the text and to present it in more comprehensive and well-structured manner, but not to replace it.
3 stage: while performing communicative group tasks such as case-studies, discussions etc., students tend to have some issues connected with lack of skills in using adequate communicative strategies, so some participants dominate the others in communication process. Therefore, teachers have to monitor this more carefully and pay more attention to the practice of using different communicative strategies (Akhmetshin et al., 2019; Kostin, Pokrovskaia, & Ababkova, 2017).
Purpose of the Study
Results of the pedagogical experiment proved that this approach is entitled to further research and positive development.
At the beginning of the experiment there was conducted a survey with the purpose of exploring the sorts of difficulties students usually face up with while working with authentic professionally oriented texts.
As can be seen from Figure
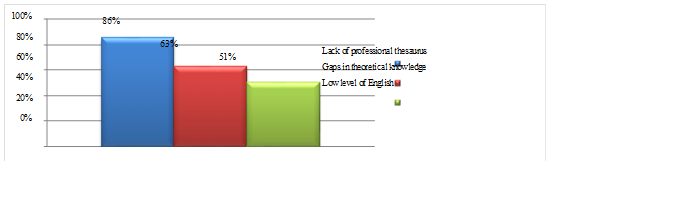
Figure
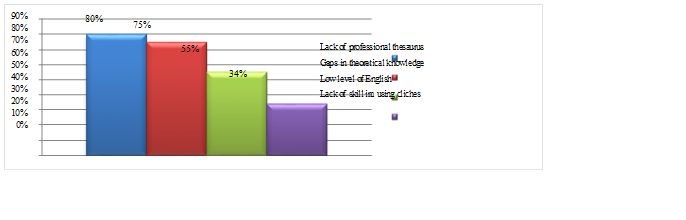
Similarly to the first part of the survey, most of the students pointed out the need to develop the professional thesaurus (80%), extend their knowledge of the subject itself (75%) and increase the overall level of English (55%). Some students (34%) also stated that the better knowledge of communicative clichés would help them to be more active in communication.
Based on the students` results and pedagogical observation, it was identified that the problem of both reading authentic professionally oriented texts and further carrying out of communicative tasks touches upon not only the sphere of low level of communicative competence, but also the lack of knowledge in field-specific disciplines. Therefore, it seems rational to strengthen the collaboration between staff teaching English and the ones teaching field-specific disciplines.
Additional attention should also be paid to drilling language clishes and working more on using different communicative strategies, as these components are vital for students who are going to make presentations in front of the international audience and/or are planning to continue their studies or work abroad in the international team.
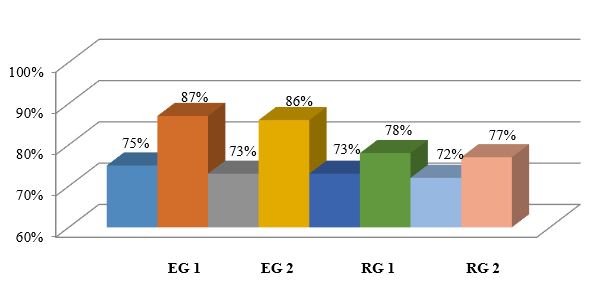
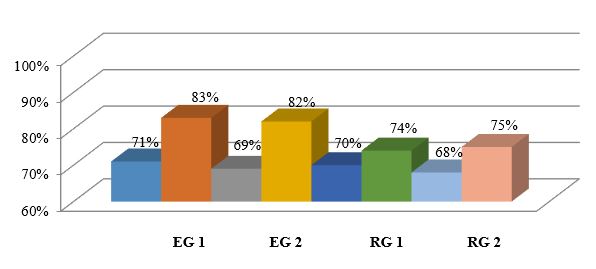
With the help of the placement test at the start of our course 4 groups were selected for the experiment. Placement test consisted of 3 main blocks. The first ‘Reading section” included an authentic professionally oriented text with tasks that require skimming, skanning and reading for detail skills and a good knowledge of terms in the field of energetics. The second “Listening section” was based on part of the real university lecture on energy grids: students had to listen to it only once and fill in multiple choice questions. Section three “Discussion” provided students with the case study; they had to brainstorm and come to an agreement in solving the described problem. Final test had the same structure and type of tasks.
Figure
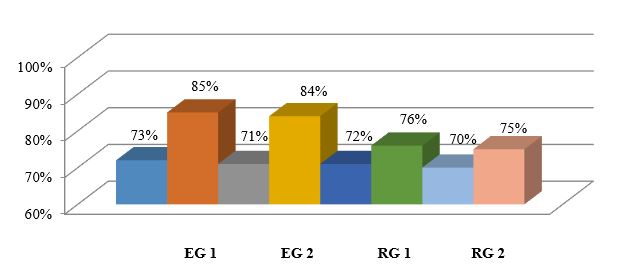
As can be seen from Figures
Such tendency could probably be connected with the fact that more time is usually dedicated to training reading skills at school and during bachelor studies. Another reason goes back to the situation when students are used to listen to some audio texts twice and therefore have some difficulties in adjusting to the new format, especially when it concerns real life audio recordings that were not meant to be used specifically for teaching and learning English. Consequently, more time should be dedicated to training listening skills, especially while working with authentic audio recordings and longer duration of these audio materials.
Research Methods
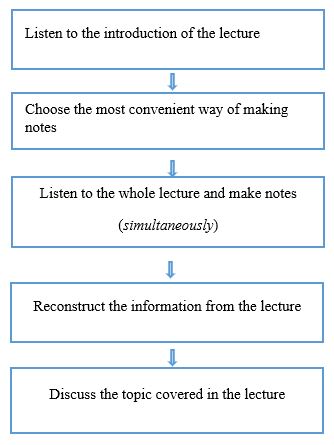
To help students overcome the difficulties with listening tasks the following set of exercises was introduced (see Figure
To assist students with enhasing their attention and keeping records of the infromation while doing the listening tasks the “making notes” exercises were introduced. As a pre-listening task, students were asked to name different ways of structuring information while reading the article or listening to the lecture that could later be used for other purposes. For example, making notes during the lecture and using them later on while preparing for the exam. With the help of a teacher the following types of diagrams and visuals were named: tree diagram, flow chart, spidergram, table, timetable and 2 columns. Each of the visuals matches one or several particular types of information that it could be “recorded” with.
Then, students were asked to listen to the introductions of several lectures and choose the most appropriate type of making notes for each one. During the next stages students had to listen to the whole lecture or fragment and simulteniously take notes. The goal was to make students focus more attentively on the text and structure it so that after the listening part they would be able to reconstruct the information from the recordings.
The final stage included 2 parts: summarizing of the lecture based on the notes made by students and further discussion of the topic covered in the lecture with teacher and other students.
Findings
These exercises enabled us to demonstrate students how crucial the skill of structuring big volumes of information is and help them to work with inforgraphics more effectively.
Similar to professional thesaurus formation range of results was demonstrated by experimental and reference groups in terms of developing communicative competence (see Figure
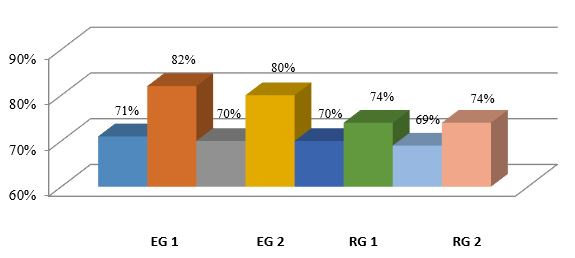
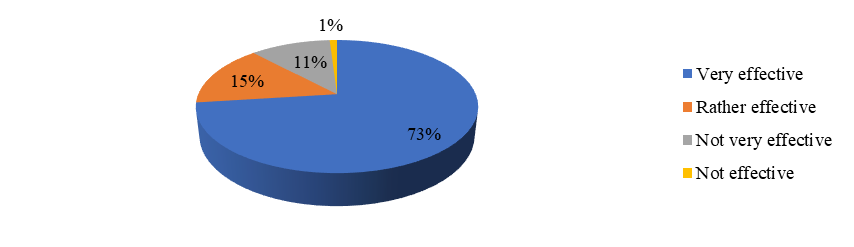
After completing the course students were asked to pass the survey in order to find out the level of infographics effectiveness use from student’s point of view.
One of the questions was aimed at measuring the level of students` satisfaction of using infographics as an additional tool that was supposed to help them make the process of reading and analysis of the authentic texts easier (Necheukhina, Matveeva, Babkin, & Makarova, 2017; Shipunova, Berezovskaya, Mureyko, Evseev & Evseeva, 2018). As can be seen from Figure
Another question was about students` willingness to use infographics in self-study while, for instance, preparing presentations (see Figure

Therefore, the vast majority of students highly appreciated this innovative educational tool which allows us to evaluate the first stage of implementing infographics into educational process of teaching English as successfull one and search for other ways of implementing this technology.
As for areas for improvement, we see them in:
1. Teaching students of creating infoposters and using them for presenting information (ex. replacing power point presentations with infoposters while making summary and presentation on the scientific article);
2. Creating short educational videos that will serve the same aims as infoposters, but will add more dynamics into educational process and could also be used for training listening skills.
While analyzing students` work with infographics during the term and final results, the following benefits of using infographics in teaching English to engineering students were formulated:
Besides above mentioned advantages, the process of creation of infoposters is relatively fast and easy-to-learn skill for teachers. Moreover, nowadays on the Internet there could be found a lot of free of charge and user-friendly applications for creating infographics (Almazova, Rubtsova Krylova & Almazova-Ilyana, in press; Shipunova, Mureyko, Berezovskaya, Kolomeyzev, & Serkova, 2017).
Conclusion
Theoretical research and results of pedagogical experiment demonstrate that current generation of students require different approach to the way of presenting and processing information. Considering the factors related to specifics of teaching English to engineering students at polytechnic university, the search for new educational technologies and tools becomes a necessity.
Visual-cognitive technology and infographics represents one of the possible solutions of that situation. We see the essence and perspectives of cognitive-visual technology in shifting the emphasis from an exclusively illustrative function to the development of its educational and cognitive function.
Further perspectives of development of this technology can be seen in using infographics for self-study. While independently constructing infographics, students could potentially improve their analytical and creative skills.
Currently, infographics as a tool of cognitive-visual technology can be used in higher education to increase the motivation and intensification of students learning activities. This will be especially relevant in the face of a low level of foreign communicative competence, large groups and a lack of classroom hours which leads to a decrease in the students' motivation.
References
- Akhmetshin, E. M., Mueller, J. E., Yumashev; A. V., Kozachek, A.V., Prikhodko, A. N., Safonova, E. E. (2019). Acquisition of entrepreneurial skills and competences: Curriculum development and evaluation for higher education. JEE, 22 (1), Retrieved from https://www.abacademies.org/articles/acquisition-of-entrepreneurial-skills-and-competences-curriculum-development-and-evaluation-for-higher-education-7814.html.
- Almazova, N., Barinova, D., & Ipatov, O. (2018). Forming of Information Culture With Tools of Electronic Didactic Materials, In B. Katalinic (Ed.), 29th DAAAM International Symposium, (pp.0587-0593), Vienna, Austria: DAAAM International. DOI:
- Almazova, N., Rubtsova, A., Krylova, E., & Almazova-Ilyana, A. (in press). Blended Learning as the Basis for Software Design. In B. Katalinic (Ed.), 30th DAAAM International Symposium, Zadar, Croatia: DAAAM International.
- Chernyak, L. (2013, May 25). Infografika: ot istokov k sovremennosti [Infographics: from the beginnings to the present]. Magazine about the design, creation and operation of information systems, 5. [in Rus.] Retrieved from http://www.osp.ru/os/2013/05/13036001.
- Glukhov, V. V., & Vasetskaya, N. O. (2017) Improving the teaching quality with a smart-education system. In S. Shaposhnikov (Ed.), IEEE VI Forum Strategic Partnership of Universities and Enterprises of Hi-Tech Branches (Science. Education. Innovations) (SPUE), (pp. 17–21). St. Petersburg: IEEE.
- Howe, N., & Strauss, W. (2000). Millennials Rising: The Next Great Generation. New York: Vintage.
- Kondratenko, O. A. (2013). Didakticheskiye printsipy realizatsii kognitivno-vizual'noy tekhnologii v distantsionnom obuchenii studentov [Didactic principles of realization of cognitive-visual technology in distance learning of students]. Theory and Practice of Social Development, 6, 83 – 90. [in Rus.].
- Kostin, G. A., Pokrovskaia, N. N., & Ababkova, M. U. (2017). Master-chain as an intellectual governing system for producing and transfer of knowledge. In S. Shaposhnikov (Ed.), IEEE II International Conference on Control in Technical Systems (CTS), (pp.71-75). St. Petersburg, Russia: IEEE. DOI:
- Lupyan, G. (2015). The centrality of language in human cognition. Language Learning, 66(3), 1–38.
- Necheukhina, N. S., Matveeva, V. S., Babkin, I. A., & Makarova, E. N. (2017). Modern approaches to the educational process aimed at improving the quality of highly qualified personnel training. In Shaposhnikov S. (Ed.), IEEE VI Forum Strategic Partnership of Universities and Enterprises of Hi-Tech Branches (Science. Education. Innovations) (SPUE), (pp. 192–195). St. Petersburg; Russian Federation;
- O’Neil, H., Perez, R., & Baker, E. (Eds.) (2014). Teaching and Measuring Cognitive Readiness. Los Angeles: Springer. doi
- Pavlova, I. P. (2015). Kak sdelat' autentichnyy tekst dostupnym dlya studentov [How to make an authentic text accessible to students]. Vestnik of Moscow State Linguistic University, 14(725), 152–168). [in Rus.].
- Rubtsova, A. V. (2018). Socio-linguistic innovations in education: productive implementation of intercultural communication. In V. Sergeev V. (Ed), International Scientific Conference "Digital Transformation on Manufacturing, Infrastructure and Service", IOP Conference series: Material science and engineering, vol. 497, (012059). St. Petersburg: IOP. Retrieved from https://iopscience.iop.org/article/
- Semenovskikh, T. V. (2014). Fenomen «klipovogo myshleniya» v obrazovatel'noy vuzovskoy srede [The phenomenon of "mosaic thinking" in the educational high school environment]. Naukovedenie, 5, 1-8. [in Rus.].
- Shamis, Y., & Nikonov, Y. (2016). Teoriya pokoleniy: Neobyknovennyy Iks [Theory of Generations: an Unusual X]. Moscow: Sinergiya.
- Shipunova, O. D., Berezovskaya, I. P., Mureyko, L. M., Evseev, V. V., & Evseeva, L. I. (2018). Personal intellectual potential in the e-culture conditions. Espacios, 39(40), Retrieved from http://www.revistaespacios.com/a18v39n40/18394015.html.
- Shipunova, O. D., Mureyko, L. V., Berezovskaya, I. P., Kolomeyzev I. V., & Serkova, V. A. (2017). Cultural code in controlling stereotypes of mass consciousness. European Research Studies Journal, 20 (4), 694-705. Retrieved from https://ersj.eu/dmdocuments/2017-xx-4-b-52.pdf
- Toffler, A. (2006). The third wave. New York: William Morrow & Company.
Copyright information

This work is licensed under a Creative Commons Attribution-NonCommercial-NoDerivatives 4.0 International License.
About this article
Publication Date
02 December 2019
Article Doi
eBook ISBN
978-1-80296-072-3
Publisher
Future Academy
Volume
73
Print ISBN (optional)
-
Edition Number
1st Edition
Pages
1-986
Subjects
Communication, education, educational equipment, educational technology, computer-aided learning (CAL), Study skills, learning skills, ICT
Cite this article as:
Almazova, N., Rubtsova, А., Radchenko, Y., & Barinova*, D. (2019). Infographics In Engineering Education: Methods Of Professional Communicative Context Development. In N. I. Almazova, A. V. Rubtsova, & D. S. Bylieva (Eds.), Professional Сulture of the Specialist of the Future, vol 73. European Proceedings of Social and Behavioural Sciences (pp. 372-382). Future Academy. https://doi.org/10.15405/epsbs.2019.12.40